Mortgage Stress And Probability Of Default Is Rising

We have just finished the December update of our mortgage stress and probability of default modelling for the Australian mortgage market.

Our model has been updated to take account of the latest employment, wage, interest rate and growth data, and we look are the current distribution of mortgage stress (can households settle their mortgage repayments, on time without financial pressure?) and make an estimate of the probability of households defaulting on their repayments by more than 30 days. The former uses our survey data on mortgages held, interest rates applied, and income available in the light of other financial commitments. Probability of default overlays the broader economic drivers. The base analysis is completed at a customer segment level by post code then rolled up to form various data views. In the next few days, we will discuss the findings in some detail. You can read more about our approach here. We also also reveal the current top 100 post codes for mortgage stress and mortgage defaults across the nation.

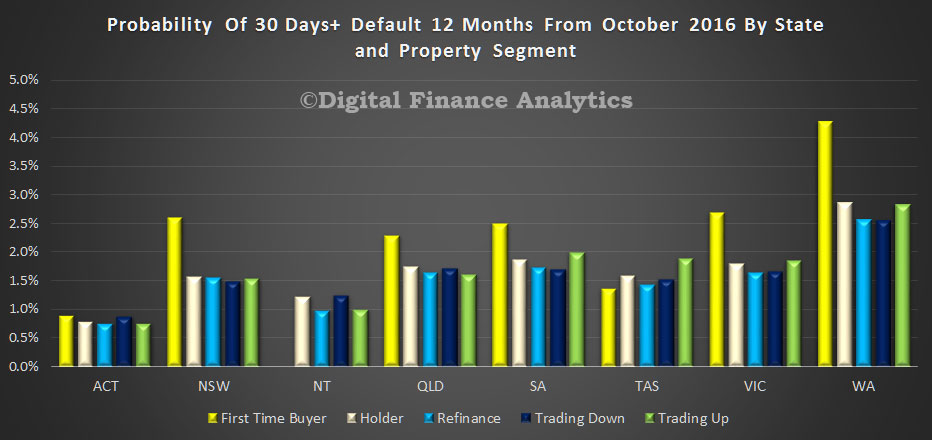
To begin, here is a summary by states, split down by CBD and rest of state.

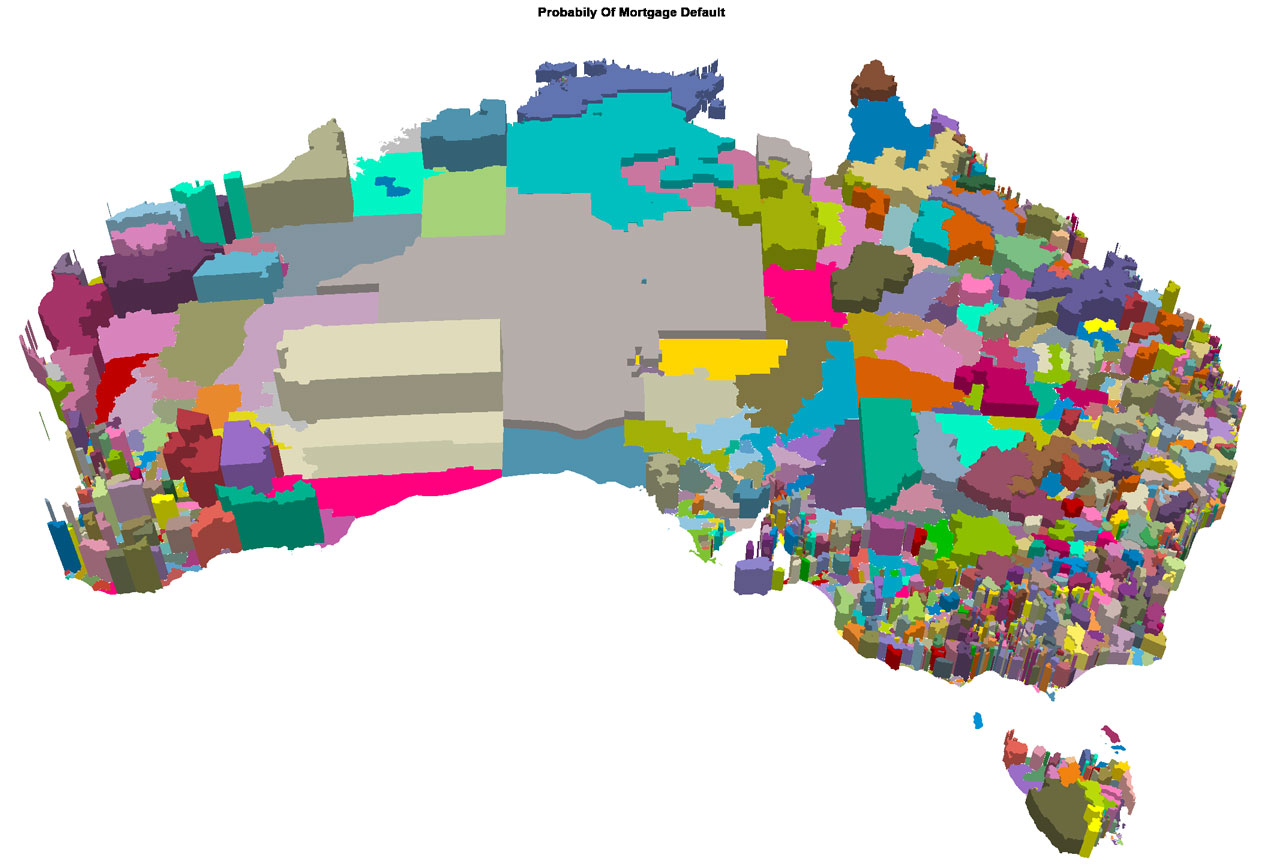
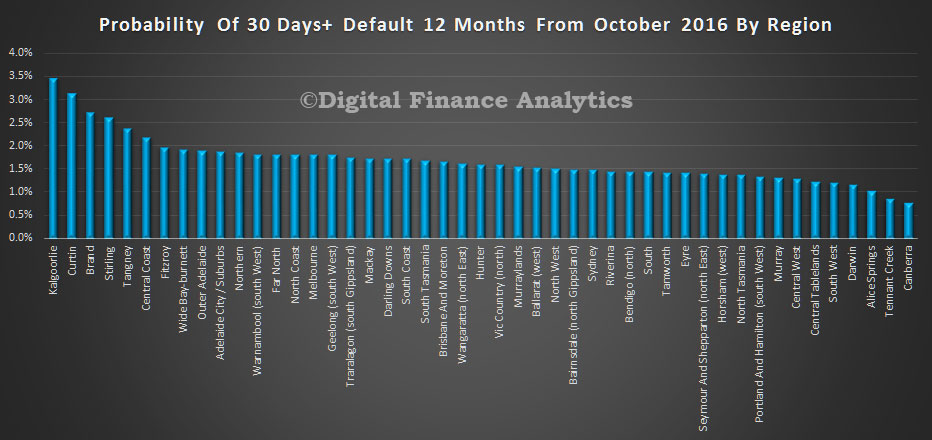
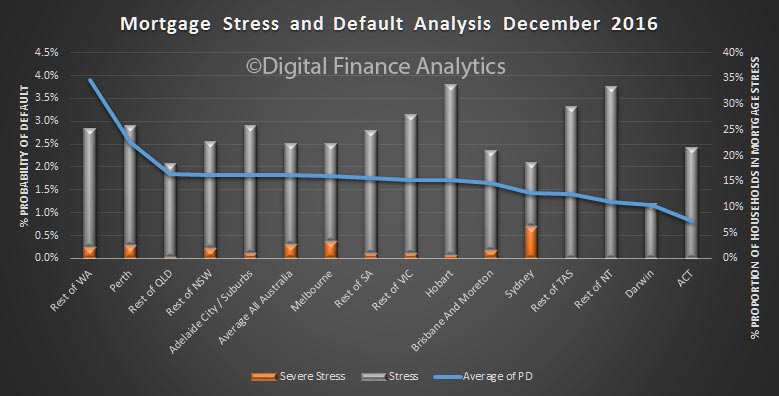
The highest probability of default can be found in regional WA, thanks to pressure in the mining belt. 30 days defaults will be close to 4%. Here, around 25% of households are in mortgage stress, including some in severe stress – see our descriptions here.

Default expectations are also high in and around Perth, where employment prospects are faltering, and incomes under pressure. In QLD, away from Brisbane, we see similar issues. The ACT has the lowest level of default probability.

The highest levels of mortgage stress are found in Tasmania, and across Regional NT, where more than 30% of households are under pressure. We also see hot spots in regional areas.

Of note is the high proportion of households in greater Sydney in severe mortgage stress – at 6.2% of borrowing households. This is a function of large mortgages (driven by high prices), rising interest rates AND flat incomes. By way of comparison, Melbourne households in severe stress sit at 3.3%, as mortgages are a little smaller. They are both higher than the national average of 2.8% of households.

Combined, across the country, more than 22% of all households are now in some degree of mortgage stress.

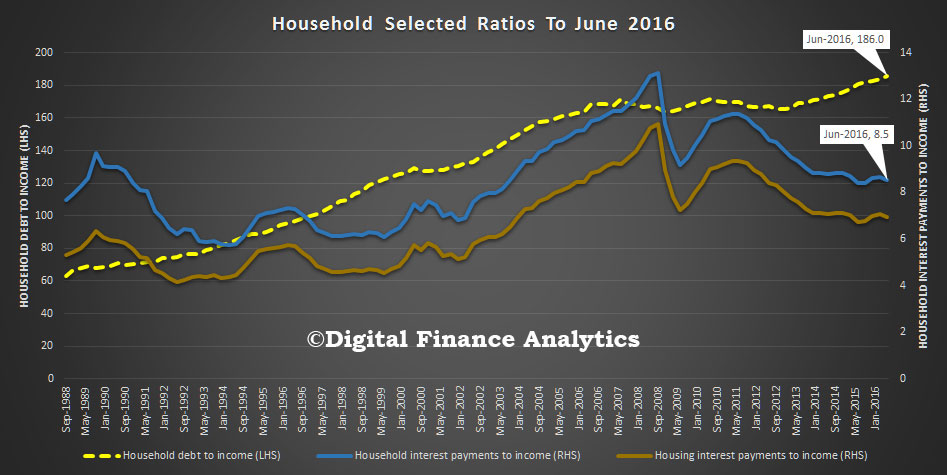
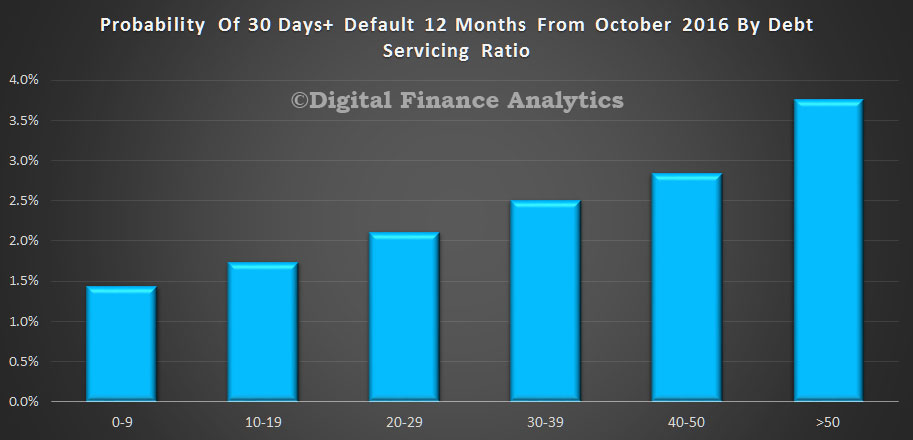
Next time we will dig into the more specific geographic footprints, because you really have to get granular to make sense of what is going on. Averages across the national simply mask what is going on.  Later will will look at loan-to-income and debt servicing ratios which are also deteriorating for many.  Then finally we will look at the loss implications for the banking sector.


Australian mortgage arrears up 25%: S&P

From InvestorDaily.

S&P Global Ratings has found prime home loan arrears for the third quarter of 2016 were 25 per cent higher than the same quarter last year, owing to lower wage growth, higher indebtedness and underemployment.

According to the ratings agency, 1.14 per cent of mortgages underlying Australia’s prime residential mortgage-backed securities (RMBS) transactions were more than 30 days in arrears in Q3 2016, compared to the same period in 2015 and 2014.

The ratings agency found that lower wage growth and higher household indebtedness were “undoubtedly contributing to mortgage stress for some borrowers, in addition to declining growth in full-time employment pushing some borrowers into part-time employment” (known as ‘underemployment’).

The mining downturn was also found to be a large contributing factor to the rise, with arrears most evident in Western Australia and Queensland.

For example, arrears fell in all states and territories during Q3 except in WA, where arrears breached the 2 per cent threshold to a national high of 2.03 per cent.

South Australia also had high arrears, at 1.55 per cent, followed by the Northern Territory (1.48 per cent).

Despite this, seven of Australia’s 10 worst-performing postcodes in the third quarter were in Queensland, up from Q2, when five of the state’s postcodes were in the top 10.

This was partly attributed to the “spill-over effect” from the downturn in mining investment in areas with a greater exposure to the resources sector.

While mortgage arrears in Q3 were higher this year, the ratings agency noted that they remain below their peak of 1.69 per cent and decade-long average of 1.25 per cent.

Further, comparing the figures quarter-on-quarter, the agency revealed that the percentage of home loans more than 30 days in arrears had declined from the second quarter of 2016 (when arrears were around 1.19 per cent), as expected.

S&P added that, while unemployment levels are relatively stable and interest rates low, the agency expects that “most of the borrowers whose loans underlie RMBS transactions [would] stay on top of their mortgage repayments”.

“We expect arrears to decline during Q3 before rising again … as Christmas approaches,” it added.

Measuring the weighted-average arrears more than 30 days past due on residential mortgage loans in both publicly and privately rated Australian RMBS transactions, S&P found the total value of loans (including non-capital market issuance) to be $134.28 billion in Q3.

More Australians are behind on their housing loans, how worried should we be?

From The Conversation.

The number of Australians who are 30 days behind in their mortgage payments is at the highest level in three years, according to ratings agency Moody’s. It projects this will keep rising.

The question is, how worried should we be?

The increase in mortgage delinquencies is a warning sign for lenders. Moody’s analysed mortgages in residential mortgage-backed securities, which may differ from the loans on the books of the major banks. So it’s hard to say exactly how problematic this is right now.

But there are a number of factors that could make this situation worse, regardless of the current risk. My colleagues and I recently published research exploring the causes of loan losses. We found a lack of ready funds and declining housing prices to be key contributors. Future interest rate rises, then, are a concern.

Further, a key driver behind the rise of delinquencies is that wage increases have not kept up with recent house price increases, and this trend, too, is looking rather dire.

How banks report bad loans

Bank risk reports reflect a number of different metrics of how their loan books are doing. Let’s focus on loan delinquencies, impaired assets and provisioning.

In Australia, housing loans are defined as delinquent if the borrower does not meet scheduled payments. For example, they could be 30 days or more than 90 days late. A loan is considered impaired if it is likely to result in a loss to the bank – generally because there is not sufficient collateral backing the loan.

Provisioning is the money that banks allocate to cover the losses on bad loans, whether delinquent or impaired.

This chart, based on recent Commonwealth Bank reports, shows that none of these numbers are particularly high right now – representing less than half a percent of all the loans on the bank’s books.

Commonwealth Bank of Australia Basel III Pillar 3 reports. Commonwealth Bank

How bad loans affect banks

That chart isn’t the end of the story.

Generally speaking, delinquencies are forward looking. A 30-day delinquency has a strong potential to become a 90-day delinquency, eventually forcing the bank to start setting aside more and more money, and prepare for an impairment.

Bank provisioning follows guidelines set by the Australian Prudential Regulation Authority (APRA). The longer the loan is in arrears, the more money banks have to set aside.

For example, for a mortgage loan with an outstanding amount of 80-100% of the property value, the bank does not have to set aside any additional money for the first 90 days it is in arrears. But they must set aside 5% of the loan after 90 days, and 20% after a year. Larger provisions apply for commercial loans, especially if they are not secured against other assets.

This is why the Moody’s warning has to be taken seriously – 30 days can quickly become 90 days, putting more pressure on banks.

The state of the economy is also a factor

Not every delinquent loan results in a loss, however. Banks and borrowers often come to agreement on more lenient payment schedules which ‘cure’ delinquent loans and borrowers are able to make scheduled payments again.

The rate at which delinquent loans are cured often reflects the state of the economy. The following charts are based on US data and show us how the economy can factor into whether a loan is cured or goes bad. In a boom, cure rates are high and foreclosure rates low.

Another thing to note in these charts is that cure rates decrease significantly as the number of days in arrears increases.

Delinquencies that are ‘cured’ during a boom. author's analysis

In an economic bust, however, cure rates are low and foreclosure rates are high. There are many reasons for this – during a bust it is much harder for the unemployed to find jobs, for delinquent borrowers to sell other assets, and lenders are less willing to refinance.

Delinquencies that are ‘cured’ during a bust. author's analysis

Are Aussie banks in trouble?

In Australia the delinquency rates are currently well below those seen in the US during the global financial crisis (GFC). The delinquency rates there and then exceeded 5%.

But the conditions are there for bank losses to be realised. First, borrowers need to become delinquent (often as a result of job losses or interest rate increases). Second, house prices need to drop below outstanding loan amounts as banks only have losses if the houses do not repay the impaired loans.

Such a bust scenario may be unlikely but within reach. The job market is under pressure, interest rates are low and hence likely to rise in the longer term, and the outlook for house prices is mixed – with Melbourne and Sydney on the rise but cities associated with the mining sector heading down.

It is important to keep a close watch on these all factors, especially if they start to combine.

Author: Harry Scheule, Associate Professor, Finance, UTS Business School, University of Technology Sydney

Mortgage arrears nine times higher in rural Australia

From Mortgage Professional Australia.

Mortgage arrears in rural Australia increased by 18% over the past 12 months, according to a new report by international ratings agency Standard & Poors. Over the same period arrears in metropolitan areas grew by just 2%, S&P found. Furthermore, the ratings agency warned that despite historically low interest rates “we expect the performance of arrears in capital cities and regional areas to continue to diverge; regional unemployment persists in many parts of the country, with no signs of abating.”

broker-concept-pic

S&P looked at regional areas in New South Wales, Queensland and Victoria but not Western Australia, on the basis that those three states account for 80% of residential mortgage backed securities. It found that arrears were highest in Townsville (2.13%), Widebay (2.07%) and Cairns (1.55%), with regions geared to manufacturing and mining the most affected. Conversely, regional NSW had the lowest rate of arrears (0.89%) due to its more diversified local economies and coastal regional areas generally fared better overall.

Despite forecasting further rises in mortgage arrears, the report was adamant that the ratings for prime loan back residential securities would not be affected: “the majority of senior tranches of prime Australian RMBS transactions are unlikely to be impacted by rising arrears in regional areas given the credit support available to senior notes, relatively modest loan-to-value ratios and reasonable geographic diversity across most prime RMBS transactions.”

Mortgage Delinquencies Continue To Rise

From The NewDaily

Stress cracks are starting to appear in the housing market with mortgage delinquencies rising to the highest level in three years. And in some states the number of people falling behind on payments has reached record levels.

The figures come from research produced by ratings agency Moody’s Investor Services and demonstrates that, despite record low interest rates, home buyers are facing an increasingly impossible stretch.

“The proportion of Australian residential mortgages that were more than 30 days in arrears rose to 1.50 per cent at 31 May 2016 compared to 1.34 per cent at 31 May 2015,” the report found. The agency warned investors that “the increase raises the risk of mortgage defaults and is therefore credit negative”.

WA, Tasmania and the Northern Territory have been hardest hit as their incomes have declined with the end of the mining boom. Delinquency rates there “climbed to the highest levels since our records began in 2005, while in South Australia, the delinquency rate was just 0.1 percentage point below the state’s record-high reached in April 2013”, Moody’s said.

1103delinquencyWA fared the worst with the delinquency rate increasing 0.69 percentage points to 2.33 per cent. In the epicentres of the housing boom, NSW and Victoria, things deteriorated, but more slowly.

Victorian arrears rates rose 0.08 percentage points to 1.4 per cent, while NSW saw delinquency up 0.04 percentage points to 1.05 per cent, the country’s lowest outside the public service bubble of the ACT.

Here's the delinquency deal.Here’s the delinquency deal

The fragility of the housing equation has been underlined by Moody’s research which highlights the yawning gap between income and house prices.

Home prices in Australia have risen 30.69 per cent over the three years to 31 August 2016 while average weekly earnings have increased only 5.06 per cent.

“The large differential between home price and wage growth – particularly in Sydney and Melbourne where home prices have increased the most – means that households have had to take on more debt to fund home purchases,” Moody’s warned.

Regulators look worried

The prospect of cracking what looks like an increasingly fragile property market has regulators worried and seemingly fearful about interest rate rises. The Australian Prudential Regulation Authority (APRA) recently delivered the banks what looks like a ‘get out of jail free’ card with its implementation of international rules around balanced funding.

The definition of the newly introduced Net Stable Funding Ratio, a measure designed to ensure banks rely more on deposits and less on volatile international bond markets for their funding, has been watered down by APRA in recent times.

Initially, APRA’s definition would have seen banks dramatically boost their reliance on customer deposits to fund their mortgage lending. But this reliance has been reduced by the final definition of the ratio, released after consultation with the banking industry, taking a less hardline stance against some assets.

“In particular, APRA has modified its proposed required stable funding for certain self-securitised assets and certain higher quality liquid assets in offshore jurisdictions,” the regulator said.

That means the change “will lift funding costs a little. But we will not see the strong hikes we were expecting to see three months ago”, analyst with Digital Finance Analytics, Martin North, told The New Daily.

It’s mortgage rates, stupid

Had that original hike taken place then mortgage rates would have risen on the back of hikes in deposit rates. And that is a much greater danger to the property market than the moderate rises in unemployment in the mining states.

“Those rises in mortgage arrears are not something we need to worry too much about at this stage. We would have much more to worry about if interest rates started to rise,” said Nicki Hutley, chief economist with Urbis group.

The fragile cocktail of rising house prices and ballooning personal debt levels has another ratings agency, S&P Global, worried. It has cut the ratings outlook from stable to negative on 25 Australian financial institutions, largely due to growing risks from the housing sector.

Household debt growth.

Those hit include larger institutions – such as AMP Bank, Macquarie, Bendigo and Adelaide, and Bank of Queensland – through to smaller credit unions, building societies and mutual banks.

“In our opinion, economic risks facing all financial institutions operating in Australia are rising due to the strong growth in private sector debt and residential property prices in the past four years, notwithstanding some signs of moderation in growth in recent months,” S&P said.

Home loan stress to rise despite low rates

From News.com.au.

IF YOU’RE already starting to feel the mortgage pinch, this is bad news. New economic modelling shows mortgage defaults are set to rise over the next 12-18 months, and those who will be most affected will surprise you.

The research conducted by Digital Finance Analytics, based on its extensive household surveys, shows those falling behind in their mortgage repayments will continue to increase thanks to low wage growth and employment changes. This is despite record low interest rates.

pd-oct-2016-segment

This news follows a warning by Moody’s Investors Service that mortgage delinquencies have already hit a three-year high across the country.

“Incomes are just not growing and that is creating considerable difficulties for many households,” Principal of Digital Finance Analytics, Martin North told news.com.au.

“What I’m predicting is that incomes are going to remain static for the next 12-18 months … That means that households are in this difficult situation were they can just about afford their mortgages, but things like the general cost of living, which is going up faster than incomes, is going to create considerable pressure on many households.”

Western Australia and Queensland mining areas will bear the brunt, with New South Wales, Victoria and ACT being the best placed.

WHO IS MOST AT RISK?

First home buyers will unsurprisingly be in the firing line, as they are entering the housing market now when prices are so inflated and going in with the assumption that their income will grow.

However, interestingly, those hit the hardest will be affluent young buyers and wealthy seniors. Disadvantaged households on the edge of cities, and battling urban households are at lower risks of default.

“People with large mortgages, so young affluent buyers who bought in Bondi, for example, are finding it much more difficult to keep that property out of default because their income is not growing. Even in the more affluent areas in the states where there is a greater economic momentum, you still have the hot spots of difficulty,” Mr North told news.com.au.

“Interestingly, it is not necessarily the more stressed households — the ones you would expect out on the fringe. And the reason for that is those households never got the pay rises and they never got the big mortgages because they couldn’t afford to.”

Wealthy seniors who own property will also face more mortgage stress due to a combination of stagnating income and lower returns from deposits and the sharemarket.

Mr North said he is concerned this could spell disaster for the economy.

“The reason is we have never had household debt as high as it is. This is new territory,” he told news.com.au.

“We’ve got this very high level of debt and we’ve got very flat incomes so it could work out in a rather bad way.”

He said retail spending and financial stability are going to take a hit as Australians will not have the discretionary income to spend and the performance of our major banks is heavily reliant on mortgages.

3D Mapping Mortgage Default Probability

Here is a map of Australia, showing the relative probability of default by post code, looking ahead over the next 12-18 months.  This is a 3d visualisation of the relative default risk, the higher the relief, the higher the risk. It nicely shows the potential issues across WA, as the mining boom subsides, some the risks in the mining heavy areas of QLD, and some pockets of concern in other regions.

This view is based on an average across all our household segments – if you started to drill down on the segment lens, you would see some interesting variations.

pd-oct-2016-mapping However, as we highlighted on Monday, higher risks are not necessarily correlated to those households who are expected to be in difficulty – for example, battlers on the urban fridge – there are other more affluent, more leveraged households who are finding their lower income growth is really cramping their style.  They remain optimistic because of the paper profits from their property holdings.  Remember this is a picture based on ultra-low interest rates, but it shows again the problem with high household debt in a low growth environment.

rba-june-household-ratios

We discussed this recently.

Which Loans Are Most At Risk?

Following yesterdays post on our latest Probability of Default Modelling, we received a number of requests for more detailed information, and especially where the risks of default are highest within the portfolio.

So today we provide some further analysis, cutting the probability of default metrics by some additional dimensions. We make the point that granular analysis is required to really understand what is going on, portfolio level analysis masks too many differences to be useful!

We start with age bands. This chart shows the relative distribution of owner occupied loans by age bands, (the red line) and the relative default probability as estimated by our models. More mature households are relatively better placed, but younger households, and those who are entering retirement still holding a mortgage have a higher risk score.

pd-october-2016-ageTurning to household income, we see elevated risks of default among lower income bands, but it does not go away as we go up the income scale. This is because those households with larger incomes generally are more leveraged and are more likely to be holding interest only loans.

pd-october-2016-incomeWe find that generally households with interest only loans are more likely to default, but the difference is relatively small, on average.

pd-october-2016-loan-typeChannel of origination does influence the probability of default, with those using a mortgage broker slightly more likely to default. We think there are a number of factors below the waterline here which explains the differences. For example brokers know where to look for the larger loan, can help position the application for approval, and households choosing to use brokers are often after a bigger loan on the same income, compared with those via a branch.

pd-october-2016-channelTwo other perspectives. Loan to income has a significant impact, with those putting more than 60% of their income to repay the mortgage most at risk. As the LTI reduces, so does the risk. We think the LTI and DSR ratios should become the cornerstone of mortgage underwriting. APRA please note!

pd-october-2016-ltiFinally, Loan To Value ratios are linked to risk, but it is not a straight forward relationship. In fact some of the lower LVR loans are more likely to default than those in the 50-70% LVR range. This is simply a function of constrained incomes. At the upper end risk rises again, thanks to larger loans relative to income, and lower net assets held.

pd-october-2016-lvr

Probability Of Mortgage Default Rises

We have re-run our Probability of Mortgage Default modelling, based on our most recent household surveys. This modelling takes the basic household finance data in our survey, and models the impact of economic changes, inflation, income growth, and other factors, to estimate the probability of 30+ day mortgage default at a post code level.

As part of our household surveys, we capture data on mortgage stress, and when we overlay industry employment data and loan portfolio default data, we can derive a relative risk of default score for each household segment, in each post code. This data covers mortgages only (not business credit or credit cards, which have their own modelling). We use this to develop a percentage risk of default measure.

There are some significant variations across the data, though overall, we expect mortgage default rates to continue to rise over the next 12-18 month, thanks to low wage growth, employment changes, and other factors. This despite record low interest rates.

Western Australia and Queensland mining areas will bear the brunt, whereas New South Wales, Victoria and ACT are best placed. Households with units in the CBD and surrounds will also be under pressure. This will likely put some downward pressure on home prices in these areas.

Here is a summary of default probability by state, and owner occupied household segments. First Time Buyers in WA are at highest risk.

pd-oct-2016-stateLooking at the same data, by Lender Mortgage Insurance (LMI) status, we see that those needing LMI (generally with an LVR above 80%) are at a higher level of risk, compared with those who do not have LMI.

pd-oct-2016-lmiLoans with a higher debt servicing ratio (DSR) are more at risk. We think DSR is the better risk measure, as our modelling highlights.

pd-oct-2016Probability of default does vary by mortgage provider. Here is a sample from lenders from our database. Clearly lenders have different underwriting rules and standards, as well as different channels to market.

pd-oct-2016-providerLooking at our master segmentation, we see that more affluent younger and wealth seniors are at risk. This is because they are more highly geared, and therefore most sensitive to changes in income.

Interestingly, those disadvantaged households on the edge of cities, and battling urban households are at lower risks of default. This is because they have not been able to gear up as much as other household groups as lending standards have tightened.

However, as expect many young growing families are finding it difficult to make their mortgage repayments, and with incomes static, this will only get worse.

pd-oct-2016-segmentFinally, here is a view by region across Australia. Locations in WA have the highest potential risk, whilst Canberra has the lowest.

pd-oct-2016-regionsWe should say this is an estimate, as of course economic predictions do change. That said, it has proven to be quite an accurate tool for risk assessment purposes.

Mortgage arrears at three year high: Moody’s

From Australian Broker.

The percentage of Australian residential mortgages which are more than 30 days in arrears has risen to its highest level in three years, according to Moody’s Investor Service. These results were of 31 May this year and are likely to climb further.

“The increase in the 30+ delinquency rate across Australia raises the risk of mortgage defaults and is therefore credit negative for Australian residential mortgage-backed securities or RMBS,” said Alena Chen, vice-president and senior analyst at Moody’s.

Underemployment and the slowing pace of home price growth will constrain mortgage performance for the remaining months of the year, the agency said.

The report, titled RMBS – Australia: Mortgage Delinquency Map: Arrears Will Continue to Rise from Three-Year High is authored by Chen.

It notes that mortgage performance decreased in all eight states and territories in the 12 months prior to 31 May 2016 reaching 1.50% from 1.34% the year before.

Levels in Western Australia, Tasmania and the Northern Territory reached their highest levels since Moody began taking records in 2005. In South Australia, the most recent delinquency rate was just 0.1% below the state’s record high.

The worst performing state was Western Australia with the 30+ delinquency rate rising 0.69% to 2.33% in the year prior to 31 May 2016. This trend began in 2014 and follows the end of the mining boom. Poor housing market conditions have also contributed, Moody’s said.

Nationwide, the postcodes with the highest number of mortgage arrears were those exposed to the resource and mining sectors. Sydney had the lowest delinquency rates due to stronger housing market conditions.

Across all states, capital cities registered lower percentages of arrears than more regional areas.

However, Moody’s warned that the increasing supply of new-build apartments in Sydney and Melbourne will exert pressure on home prices and raise the risk of further mortgage delinquencies and losses.

However “while mortgage delinquencies will continue to rise, the deterioration in performance should be moderate,” the agency said.