Mortgage Stress Steady In August 2019

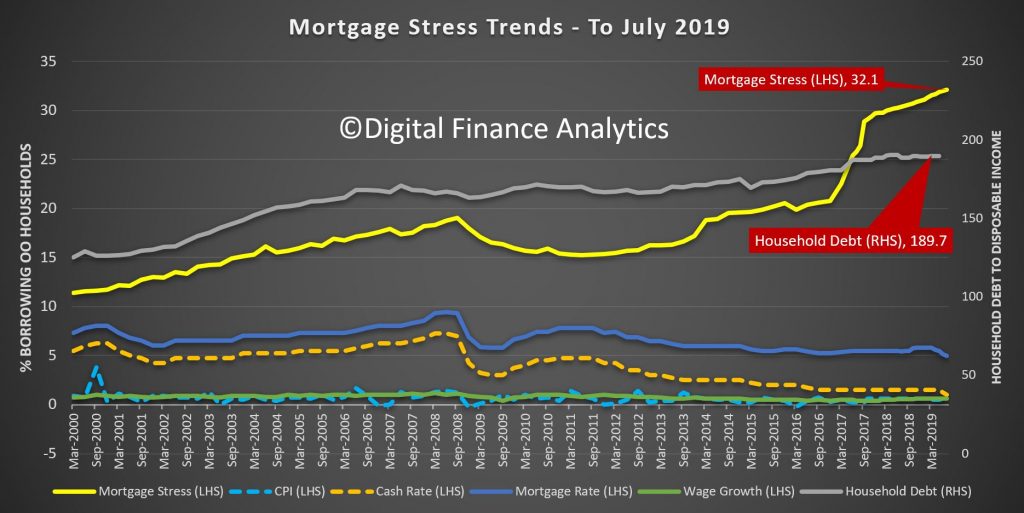
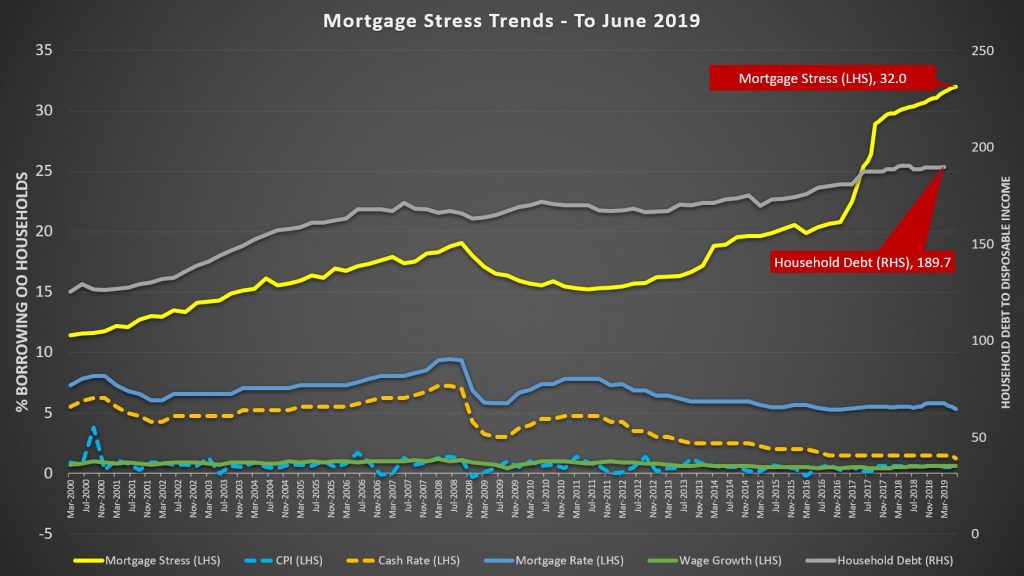
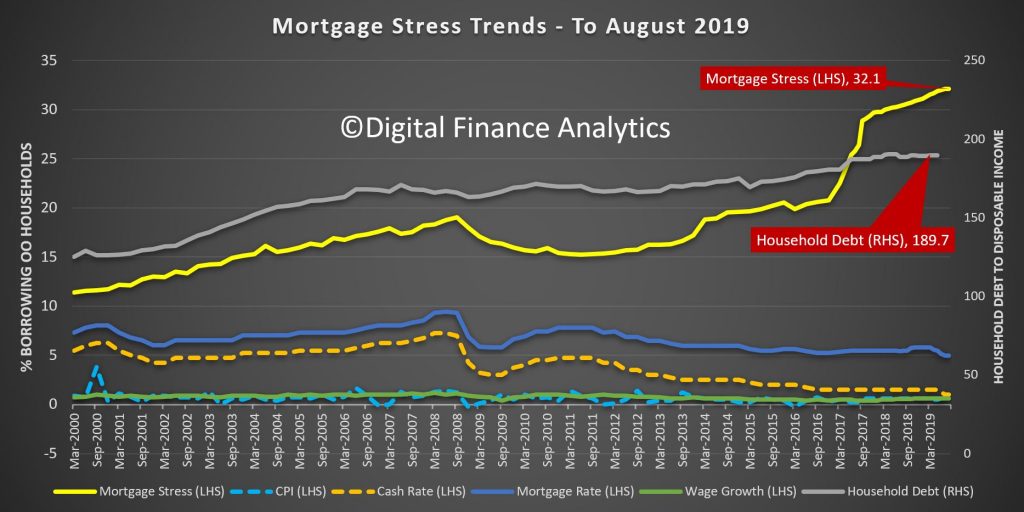
For the first time since 2015 the overall level of mortgage stress did not rise significantly in August, according to the latest research from Digital Finance Analytics, based on our rolling 52,000 household survey.

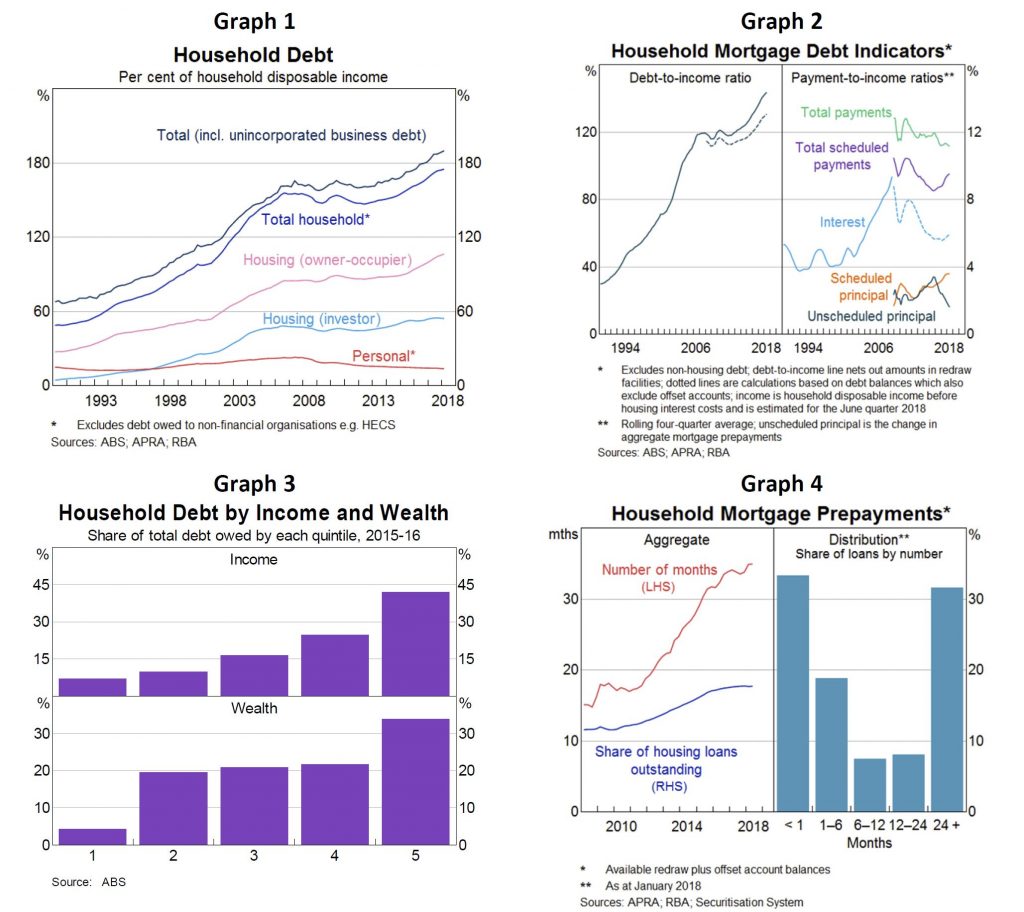
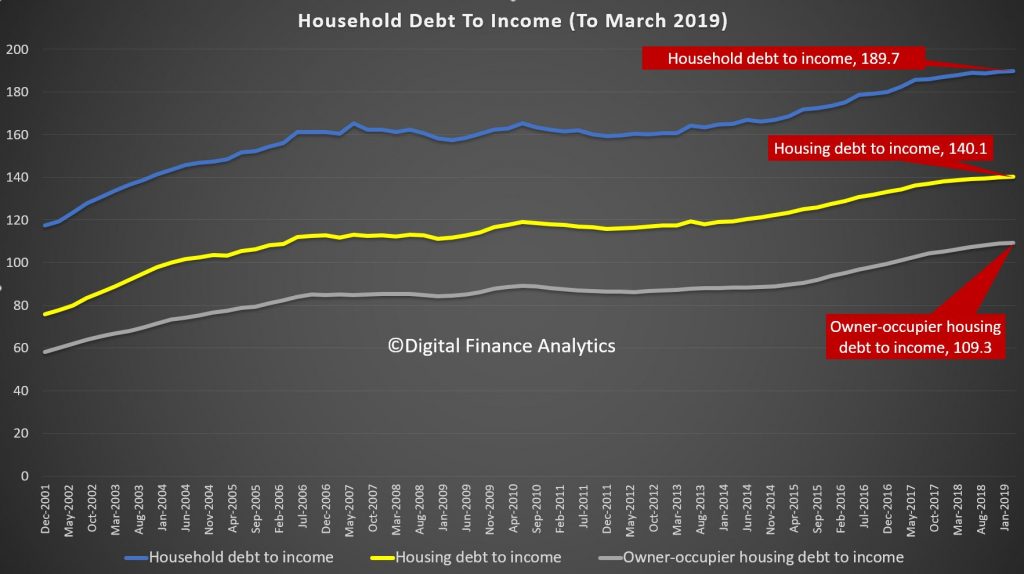
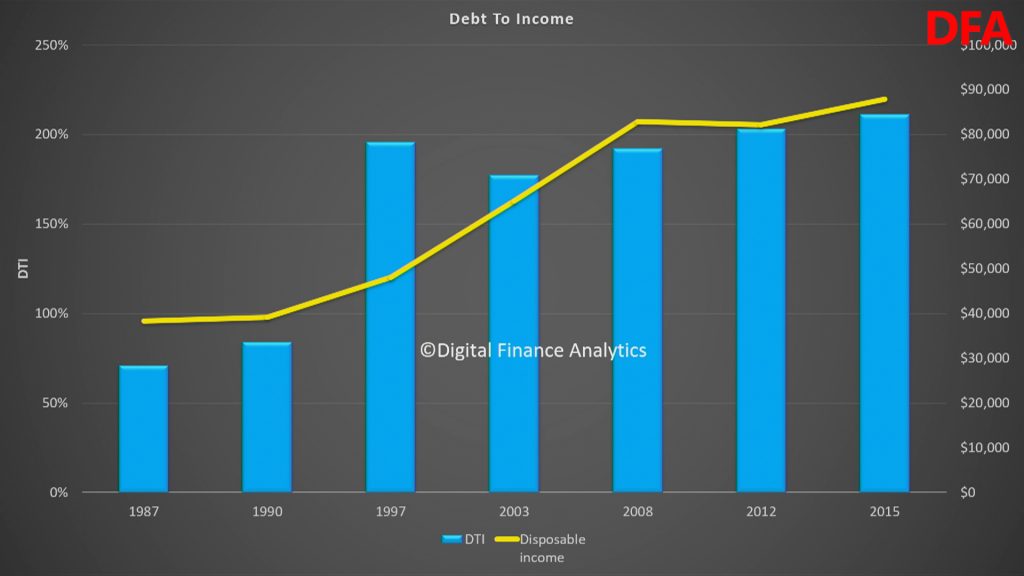
That said, the proportion of households whose cash flow is under pressure when servicing their mortgages remains elevated at 32.1% of borrowing households. This is still a record high. And average household debt to income ratios continue to rise – reaching 189.7 according to recent RBA data. This ratio, reported quarterly, includes all households, not just borrowing ones, and SME’s as well. For the one third of households borrowing the average ratio is at 550 according to our data. Banks are still willing to write loans above six times income in some circumstances.

The combination of lower mortgage rates and the tax refunds, plus some more significant wage increases in some sectors helped to stabalise the results.

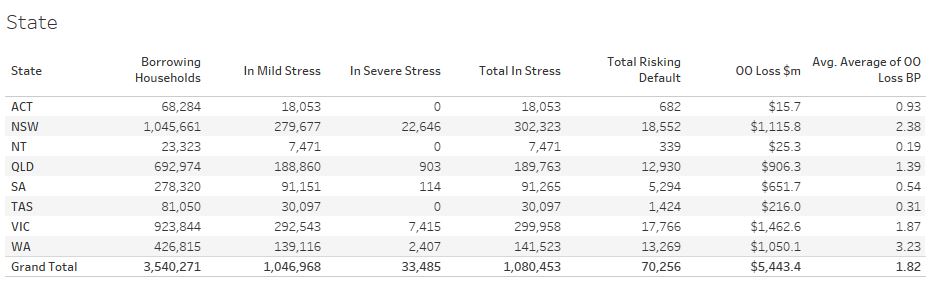
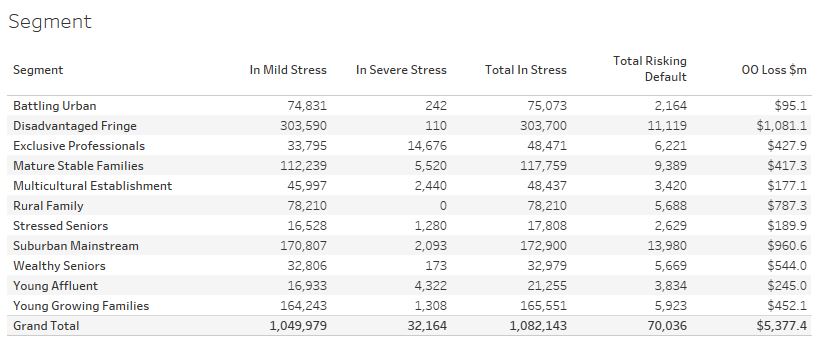
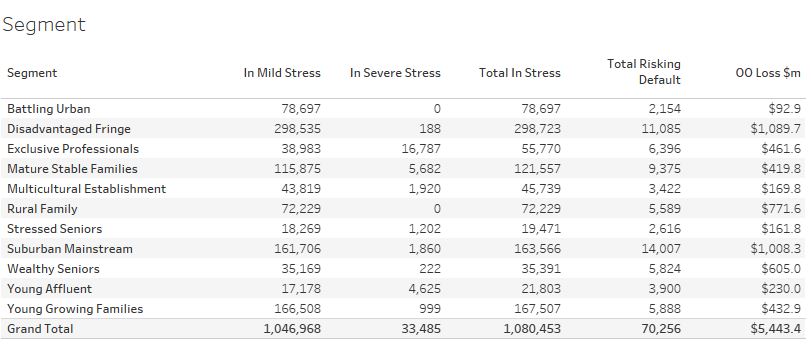
The total number of households in stress is now 1,082,000, compared with 1,080,000 last month. We continue to see households across our segments coping with the financial pressures resulting from large mortgages, flat incomes and rising costs. There are a growing number of older households in difficulty.

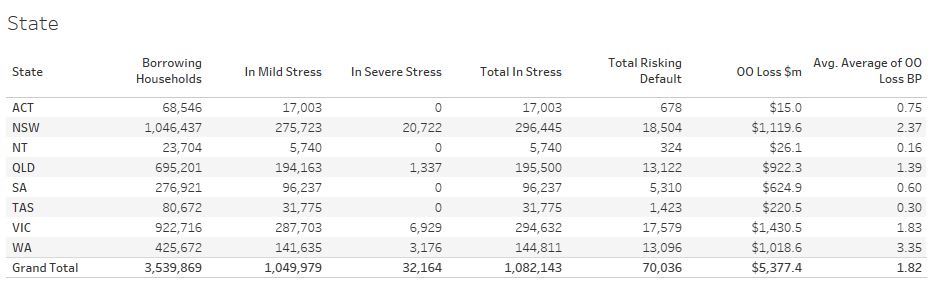
Across the states, pressure is rising in NSW and VIC, as the broader economic trends deteriorate. The trajectory of unemployment and underemployment will be critical ahead. Relatively speaking losses remain higher in WA, where the economy has been in the doldrums for several years, but it is plausible we will see economic weakness spreading. The construction sector is under pressure, and job losses are to be expected ahead.

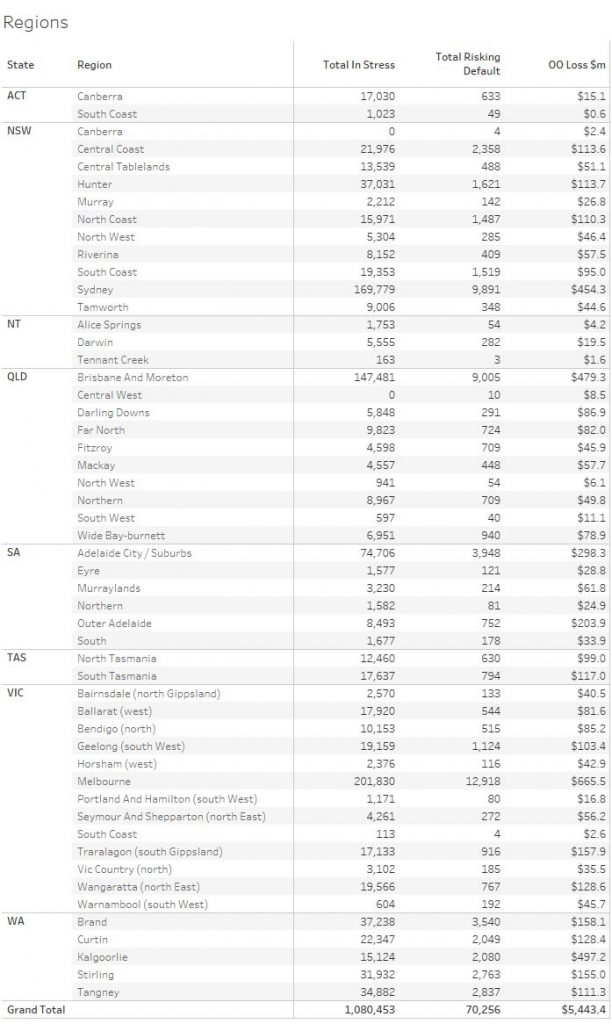
Mortgage stress is not just concentrated in the main urban centres, we continue to see signs in regional centres as well.

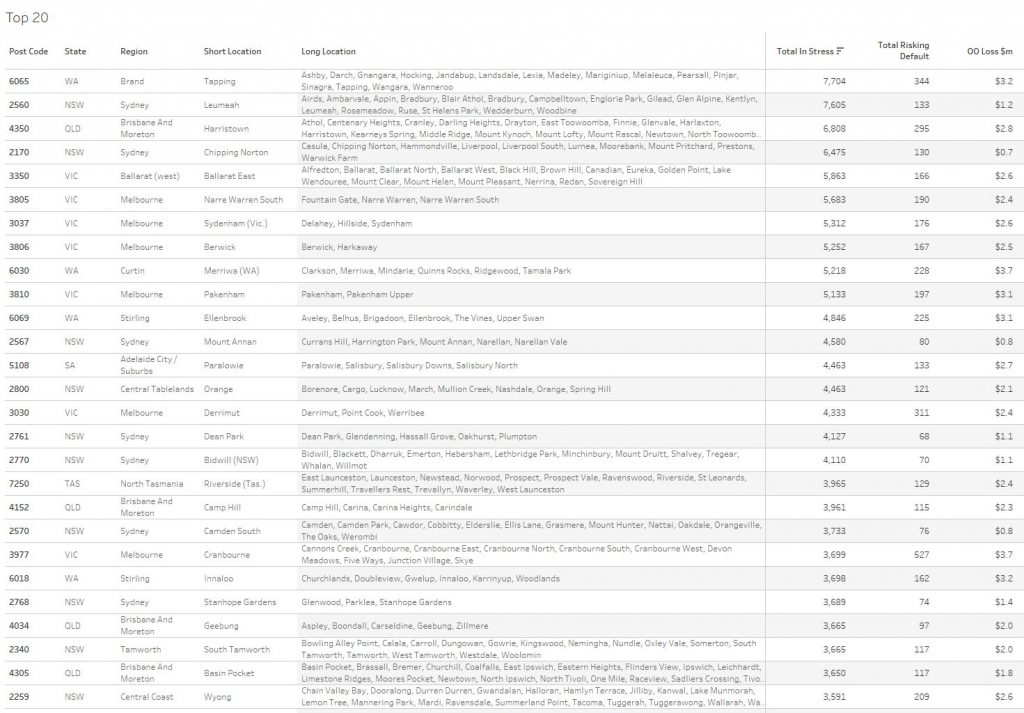
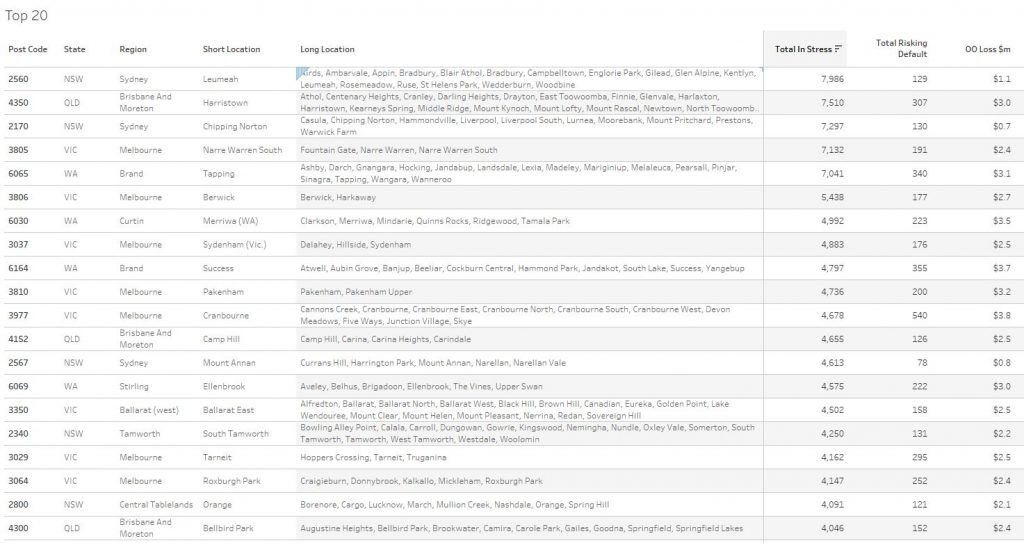
The current top 20 post codes by mortgage stress shows that Liverpool 2170 has the highest count, followed by post code 6065 in WA.

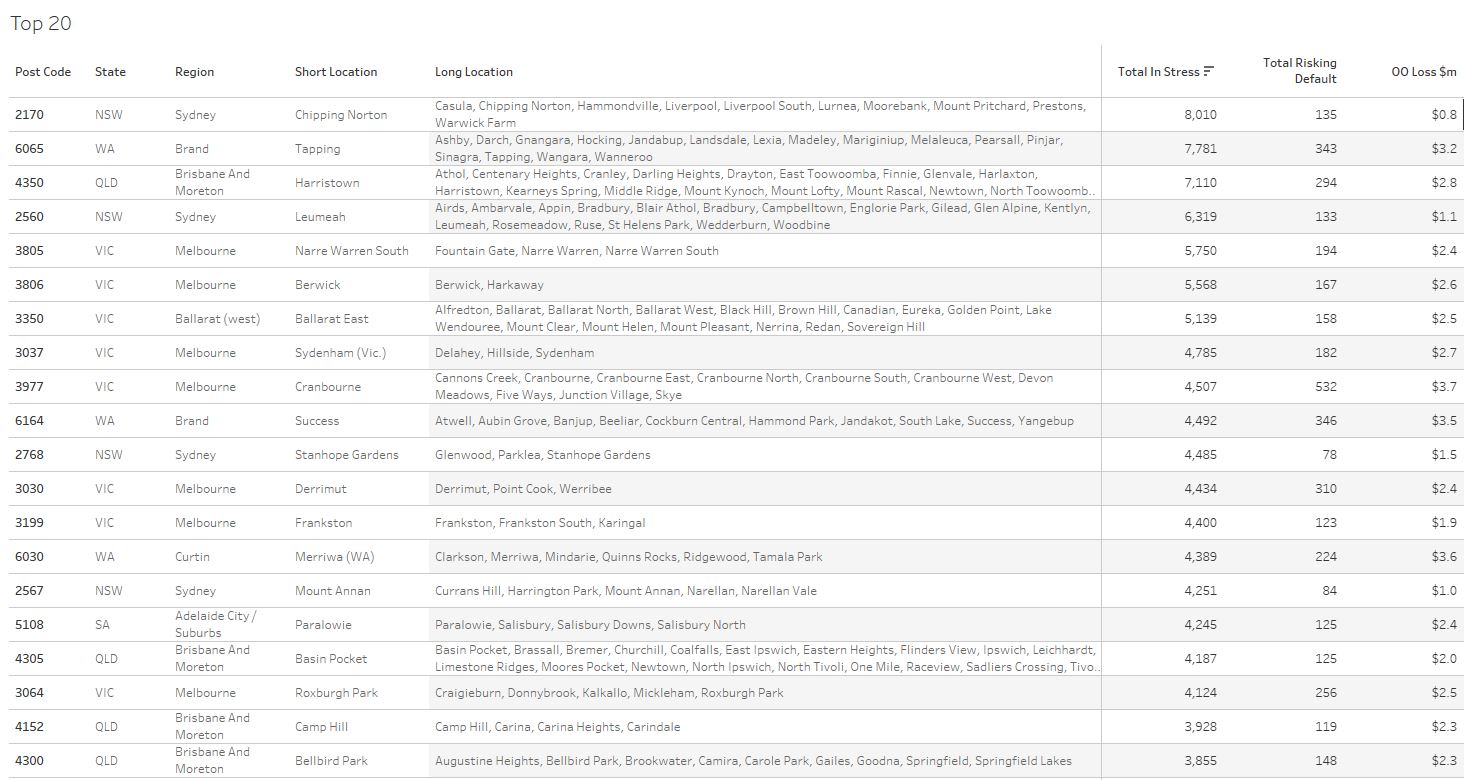
Another way to look at the top 20 is by defaults. Here Cranbourne in VIC, 3977 comes at the top of the list followed by 6210 in WA, which includes Mandurah.

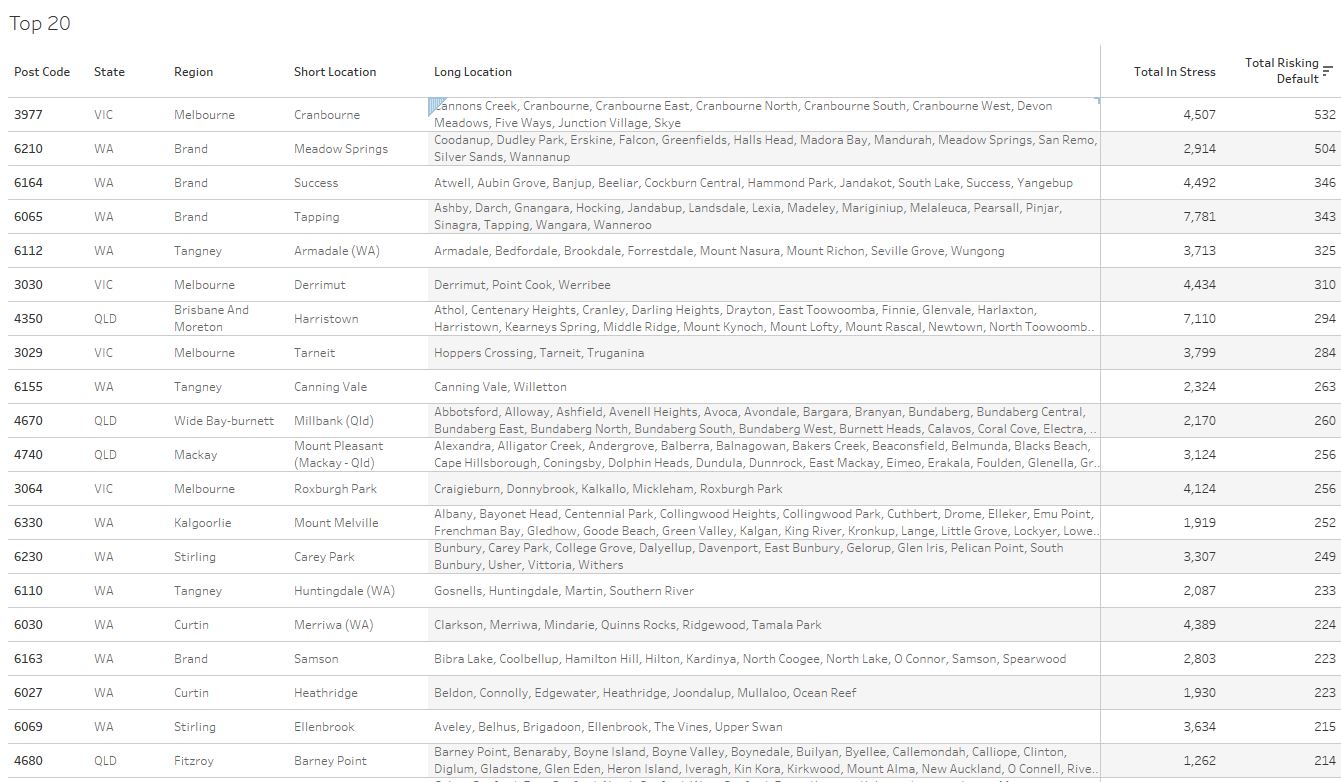
Many on the list are in the urban fringe where there has been high rates of construction, often on small plots. The peak of distress is from the 2015 and 2016 cohorts, before the lending standards were tightened, but it is also the case that the journey many households take from stress, severe stress to default is one which can play out over years, not months.

We will update the results again next month.

The Housing Debt Trap Is Sprung On Older Australians

The new AHURI report highlight the fact that more Australians are taking mortgage debt into retirement, will have to us superannuation to repay the debt, and so put more pressure on Government in terms of future support.

High debt into retirement is also leading to more stress.

Our surveys show the relative debt by age cohorts. The trends are “moving to the right” as people buy later, get larger loans, and hold them into retirement. Overall debt has never been higher.

As a result the debt to income ratio of those over 55 years has deteriorated significantly.

The final point to make is households as they enter retirement will be more reliant on fixed incomes, at a time when savings rates on deposits are at a record low. So servicing this debt into retirement will be a major issue.

Combined this explains why mortgage stress is lurking among older households, as our July stress data revealed. This includes more than 35,000 “Wealthy Seniors” across the country.

Older Australians Mortgage Debt Up 600 per cent; Impacting Mental Health

Between 1987 and 2015, average real mortgage debt among older Australians (aged 55+ years) blew out by 600 per cent (from $27,000 to over $185,000 in $2015), while their average mortgage debt to income ratios tripled from 71 to 211 per cent over the same period, according to new AHURI research.

The research, Mortgage stress and precarious home ownership: implications for older Australians, undertaken for AHURI by researchers from Curtin University and RMIT University, investigates the growing numbers of older Australians who are carrying high levels of mortgage debt into retirement, and considers the significant consequences for their wellbeing and for the retirement incomes system.

‘Our research finds that back in 1987 only 14 per cent of older Australian home owners were still paying off the mortgage on their home; that share doubled to 28 per cent in 2015’, says the report’s lead author, Professor Rachel ViforJ of Curtin University.

‘We’re also seeing these older Australians’ mortgage debt burden increase from 13 per cent of the value of the average home in the late 1980s to around 30 per cent in the late 1990’s when the property boom took off, and it has remained at that level ever since. Over that time period, average annual mortgage repayments have more than tripled from $5,000 to $17,000 in real terms.’

When older mortgagors experience difficulty in meeting mortgage payments, wellbeing declines and stress levels increase, according to the report. Psychological surveys measuring mental health on a scale of 0 to 100 reveal that mortgage difficulties reduce mental health scores for older men by around 2 points and an even greater 3.7 points for older women. Older female mortgagors’ mental health is more sensitive to personal circumstances than older male mortgagors. Marital breakdown, ill health and poor labour market engagement all adversely affect older female mortgagors’ mental health scores more than men’s.

‘These mental health effects are comparable to those resulting from long-term health conditions,’ says Professor ViforJ. ‘As growing numbers of older Australians carry mortgages into retirement the rising trend in mortgage indebtedness will have negative impacts on the wellbeing of an increasing percentage of the Australian population.’

High mortgage debts later in life also present significant challenges for housing assistance programs. The combination of tenure change and demographic change is expected to increase the number of seniors aged 55 years and over eligible for Commonwealth Rent Assistance from 414,000 in 2016 to 664,000 in 2031, a 60 per cent increase. As a consequence the real cost (at $2016) of CRA payments to the Federal budget is expected to soar from $972 million in 2016, to $1.55 billion in 2031. The unmet demand for public housing from private renters aged 55+ years is also expected to climb from roughly 200,000 households in 2016, to 440,000 households in 2031, a 78 per cent increase.

There are also challenges for Government retirement incomes policy. The burden of indebtedness in later life is growing; longer working lives and the use of superannuation benefits to pay down mortgages are increasingly likely outcomes.

The Latest Mortgage Stress And Rate Cut Data [Podcast]

We review the latest data from our rolling household surveys for July 2019.

Digital Finance Analytics (DFA) Blog
The Latest Mortgage Stress And Rate Cut Data [Podcast]
Loading
/

July 2019 Mortgage Stress Still Up, Despite Rate Cuts

The DFA mortgage stress tracker to the end of July 2019 is released today. This is based on our rolling 52,000 household surveys and includes data up to the 31st July. More than 70,000 households risk default over the next 12 months.

Despite the two RBA rate cuts, and the tax refunds which some can claim, (after the legislation was passed in Parliament in July), the impact on household budgets with mortgages has yet to translate into a meaningful easing in mortgage stress. In fact, we doubt it will.

This is because the reductions in variable mortgage rates for existing customers have yet to work through the system, and the tax refund claims take some time to be processed. Meanwhile costs of living continue to escalate.

We also note that many households who have attempted to refinance to the much lower attractor rates and are in mortgage stress are being declined. In an absolute sense many of these households are locked into higher rates than the best available, and fall outside the revised (even if loser now) underwriting standards. We estimate there are more than 300,000 households who are mortgage prisoners as a result.

The total number of households estimated to be in mortgage stress in July 2019 is 1,080,000 or 32.1% of borrowing households. This is another record.

The RBA data to March 2019 showed that the ratio of household debt to income rose again to 189.7, and credit growth is still running at a faster rate than household incomes. And yet APRA reduced underwriting standards!

Analysis of stress across the country shows Western Australia still leads, but more households in New South Wales, Victoria and Queensland are under financial pressure.

We define households as “stressed” when current income does not cover current expenditure, including mortgage repayments. Households manage this deficit by cutting back on spending, putting more on credit cards and other loans, or try to refinance to a cheaper loan. Those in severe stress are deeply in deficit. It can take a household many months to slide from stressed to severely stressed, beyond this point, bank foreclosure or a forced sale in more likely.

We note that households in this severely stressed state are now much more likely to be forced to sell, as bank hardship schemes only protect households for a period. We note that in some post codes in Western Australia, where this has been an issue now for some time, defaults and foreclosures are running at three to four times the national average.

We also continue to see stress breaking out across most of our household segments, this is not just a factor running in battling households. Indeed, banks have been treating more wealthy groups very generously in terms of loan amounts, because they have other assets (even if they are also mortgaged). Risks in the affluent groups are rising still, and as the share market reverses, this will become significant.

Stress does vary across the regions.

And finally, here are the top post codes in terms of mortgage stress.

WA postcode 6065, the area around Tapping and Hocking has the largest count of stressed households this month, followed by Cambelltown in NSW 2560, Toowoomba in QLD 4350, Liverpool in NSW 2170, Ballarat 3350 in VIC and Narre Warren in VIC, 3895. All these areas are locations where there has (and continues to be) considerable new construction. Many households purchased close to the top of the market, and are now experiencing negative equity, with prices in some locations down more than 30%. Some were first time buyers, others traded up to a new property.

We will discuss the drivers of stress when we publish the next edition of our surveys, but we note that households are reporting significant ongoing rises in fuel costs, child care costs, healthcare costs (especially health insurance), school fees, and local authority rates. In many cases any relief from lower mortgage rates is blotted up by other living costs. The truth is only significant increases in take-home pay would alleviate their financial pressures, but in the current situation, this is unlikely.

Finally, as I often say, many households do not maintain a household budget, so they do not know their true financial position. This is an essential first step to managing financial issues. The ASIC Money Smart Web site offers some useful tools.

Next, it is important to prioritise spending, and avoid using high rate credit cards. Pay these off first.

Third, if households are getting into difficulty financially, its important to act early, rather than hoping things will work out. And Banks have an obligation to help, to talk to them. So talk to your lender.

RBA On Household Debt And Financial Stress – FOI

The RBA released a freedom of information request today. They say:

Household debt-to-income has drifted up, to 190 per cent (Graph 1 – broad measure, includes debt of unincorporated enterprises, new migrants’ offshore debt, HECS and to non-financials).

More frequently we cite housing debt-to-income which has increased to over 140 per cent (up 23 percentage points over five years) (Graph 2); net of offset accounts this is around 130 per cent (up 16 percentage points over five years).

High income and wealthy households hold a large proportion of household debt (Graph 3). In 2015-16 the top income quintile accounted for about 40 per cent of total debt and the top wealth quintile owed one-third of total debt; this share has been stable over time.

Debt servicing ratios have been broadly steady: falling rates offset rising debt.

Aggregate mortgage prepayments (offsets and redraws) are equivalent to 18 per cent of outstanding mortgages and nearly 3 years of scheduled repayments at current interest rates (Graph 4). One-third have no buffer: many are investors, on fixed-rate or new borrowers. Largest buffers typically: wealthier, higher income and more seasoned mortgages.

The housing non-performing loan (NPL) ratio has increased since the end of 2015 (mostly WA), but remains below the most recent peak in 2011 (Graphs 5 and 6).

NPL ratios for personal loans and credit cards remain high relative to recent history (personal credit is only about 4 per cent of banks’ household lending).

Broad data sources suggest the number of households experiencing financial stress has fallen over the past decade, but there are regional variations. Household Expenditure Survey (2015/16): the number of households experiencing financial stress has fallen steadily since the mid-2000s (Graph 7). HILDA (2016): measures of financial stress are little changed over the decade and are lower than the early 2000s (Graph 8).

ASIC’s recent report on credit cards links problematic debt with multiple credit card usage, corroborating messages from liaison (but overall more households are paying off each month).

Some private surveys point to rising mortgage stress. These surveys are timely but their methodologies often seem to overstate financial stress (e.g. using actual, rather than required mortgage payments, which include prepayments).

Concerns about stress when IO loan converts to a principal-and-interest (P&I) loan. Required repayments are estimated to increase by 30-40 per cent (about $7,000 per year) for a ‘representative interest-only borrower with a $400,000 mortgage converting to P&I.

Based on loans in the Securitisation Dataset, a large share of borrowers should qualify for an IO extension or could refinance with a different lender.

Borrowers that can’t meet new lending standards and are unable to service P&I repayments might sell their properties or default. We estimate this is a small group (eg borrowers with multiple highly leveraged investment properties).

Tighter lending standards are unlikely to bind for borrowers that: undertook a serviceability assessment at loan origination that already took into account the step up in repayments at the end of the interest-only periods (as APRA has required for all such assessments since end 2014); Did not borrow (close to) the maximum loan size available to them; Have experienced income growth since the loan was originated; Have made prepayments on their loans; and/or Were assessed for their original loans at significantly higher interest rates than current assessment rates.

Most borrowers will have positive equity given the rate of housing price growth over the last five years.

The Economic Massacre Of Mandurah

Economist John Adams, analyst Martin North and the CEC’s Robbie Barwick discuss their recent visit to Mandurah, in WA, a post code which a couple of years back registered as highly mortgage stressed.

So what has happened since then?

The Four Corners program from 2017, where Mandurah was featured.

Household Debt And Mortgage Stress Both Move Higher [Podcast]

We review the latest data from the RBA, and the June results from our household surveys relating to mortgage stress.

Digital Finance Analytics (DFA) Blog
Household Debt And Mortgage Stress Both Move Higher [Podcast]
Loading
/

Household Debt Ratios And Mortgage Stress Continues To Rise

We have released the June 2019 mortgage stress results, based on our running 52,000 household surveys. We found that 32% of households are now dealing with mortgage stress, a record, meaning they are having cash flow issues managing their finances and mortgage repayments.

This translates into more than 1,063,000 households spread across the country, and nearly 71,000 risk default in the year ahead, even taking into account the fall in mortgage repayments represented by the recent rate cuts. Banks loses will rise.

This is because the costs of living continue to run ahead of incomes, while households have larger debts (and are being enticed to buy in the current complex risk environment).

The top post codes in stress are those in the outer suburban fringe areas, where many large estates are still being built, and households are super-highly leveraged.

The RBA released their March 2019 data on household ratios. Whilst these series include small business finance, and include households not borrowing, the trends continue to tell the story of debt, and more debt.

The household debt to income ratio is at a record 189.7, while the housing debt to income ratio was 140.1, again a record and the owner occupied housing debt to income ratio was also up, to 109.3. These are high numbers, on a trend and international comparable basis. Households are drowning in debt.

However the asset to income ratios tell another story. As home prices have fallen, so the ratio has decreased, assets are down relative to income. The exception are financial assets, which benefited from the rise in stock prices this year.

The ratio of interest to income continues to rise because households are borrowing at a faster rate than their incomes are growing, helped of course by lower interest rates. This ratio is below that before the GFC because rates have dropped. And this is the one ratio spruikers turn to to defend the high debt levels – but it is myopic, and going in the wrong direction.

Finally, the RBA data debt to assets shows the pincer movement as home prices fall, and debt rises. This is now heading towards the highest we have seen.

The obvious conclusion is that the debt burden is too great, mortgage stress will go on rising, until the balance between debt and income is restored.

The recent loosening of lending standards simply pours more fuel on the fire. Households are being used a canon fodder in the vein attempt to keep the faltering economy afloat.