Domain has released its Rental Report for March, which delivered more bad news for tenants, on top of the data I released recently which showed three quarters of those renting already have cash-flow issues. Younger families and first-generation Australians are being hit really hard, but as I discussed in my live show, other household categories are also being caught in the rental squeeze. And despite the rise in rents, some investors are selling due to poor net returns.
With net overseas migration forecast to remain historically high, albeit lower than last year, Australia’s rental crisis will continue, even if vacancy rates and rental inflation ease a little.
As a result, more Australians will be plunged into rental stress, group housing, or homelessness.
The solution is to cut net overseas migration hard to a level well below the nation’s capacity to build homes and infrastructure.
The other factor no one is talking about is that renters under extreme pressure are being coerced into buying property, even if its poor quality or in the wrong area, just to exit the rental sector and try to get some control. With borrowing power down about 40-50%, these households are leveraging up, as see by the larger loan balances against income. But this could be an issue of jumping from the frying pan into the fire!
http://www.martinnorth.com/
Go to the Walk The World Universe at https://walktheworld.com.au/
Today’s post is brought to you by Ribbon Property Consultants.
Digital Finance Analytics (DFA) Blog
Tenants Caught In The Python-Like Property Squeeze Have To Pay More!
Domain has released its Rental Report for March, which delivered more bad news for tenants, on top of the data I released recently which showed three quarters of those renting already have cash-flow issues. Younger families and first-generation Australians are being hit really hard, but as I discussed in my live show, other household categories are also being caught in the rental squeeze. And despite the rise in rents, some investors are selling due to poor net returns.
With net overseas migration forecast to remain historically high, albeit lower than last year, Australia’s rental crisis will continue, even if vacancy rates and rental inflation ease a little.
As a result, more Australians will be plunged into rental stress, group housing, or homelessness.
The solution is to cut net overseas migration hard to a level well below the nation’s capacity to build homes and infrastructure.
The other factor no one is talking about is that renters under extreme pressure are being coerced into buying property, even if its poor quality or in the wrong area, just to exit the rental sector and try to get some control. With borrowing power down about 40-50%, these households are leveraging up, as see by the larger loan balances against income. But this could be an issue of jumping from the frying pan into the fire!
http://www.martinnorth.com/
Go to the Walk The World Universe at https://walktheworld.com.au/
Today’s post is brought to you by Ribbon Property Consultants.
We look at the rental crisis which is full swing across the country. Unfortunately, the data shows things are getting worse – when one in three households are renting, and new rents are up by more than 10%.
We look at the latest trends and discuss what is really going on.
It reeks of policy failure!
Go to the Walk The World Universe at https://walktheworld.com.au/
Today’s post is brought to you by Ribbon Property Consultants.
If you are buying your home in Sydney’s contentious market, you do not need to stand alone. This is the time you need to have Edwin from Ribbon Property Consultants standing alongside you.
Buying property, is both challenging and adversarial. The vendor has a professional on their side.
Emotions run high – price discovery and price transparency are hard to find – then there is the wasted time and financial investment you make.
Edwin understands your needs. So why not engage a licensed professional to stand alongside you. With RPC you know you have: experience, knowledge, and master negotiators, looking after your best interest.
Shoot Ribbon an email on info@ribbonproperty.com.au & use promo code: DFA-WTW/MARTIN to receive your 10% DISCOUNT OFFER.
A deep dive into rental stress across Australia, as more households wrestle with costs of living and rising rents. There is simply not enough focus on the 2 million households struggling with meeting rental payments, as real incomes are eroded by higher inflation. Go to the Walk The World Universe at https://walktheworld.com.au/
As requested following our recent mapping analysis of mortgage stress, here is a series of maps relating to rental stress – again measured in cash flow terms.
Overall more than 2 million households have fallen into rental stress, and they are concentrated in a range of specific suburbs.
Go to the Walk The World Universe at https://walktheworld.com.au/
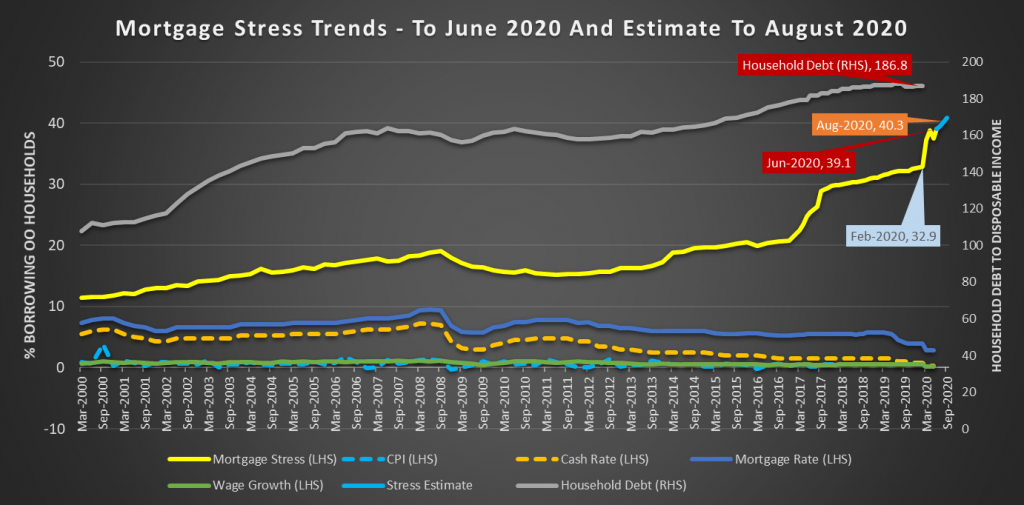
Digital Finance Analytics has released the results of our rolling 52,000 household surveys to the end of June, which reveals that mortgage stress rose to 39.1%, compared with 37.5% in May. In addition, rental stress was 39.4%. Moreover, a larger number of property investors with a mortgage (51.3%) are underwater from a cash-flow perspective. This is new analysis which suggests investors are caught in the financial crisis headlights.
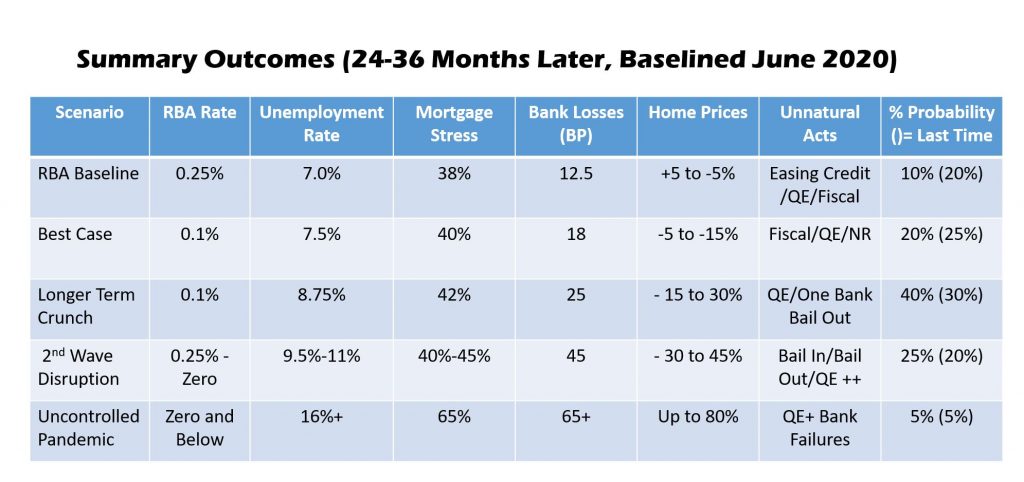
We discussed all this on our live stream last night, where we also updated our price scenarios:
June Mortgage Stress Update
We measure stress in cash-flow terms, money in, money out, rather than a set percentage of income dedicated to paying mortgage or rental payments. If the net income flows are lower than the net payment outflows, households are classified as stressed. These households will cut back on expenditure, put more of credit cards, or tap into deposits. While, they may have access to other assets – for example investment properties or share portfolios, negative cash flow remains a significant challenge.
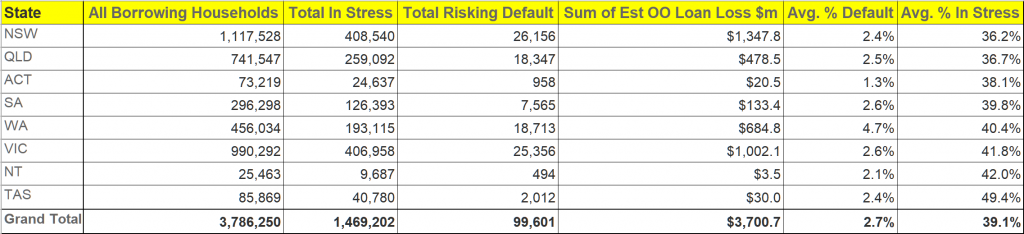
This equates to 1.47 million owner occupied mortgage holders under financial pressure, and 1.7 million households in rental accommodation. More than 820,000 property investors are in difficulty.
The complex interplay of higher unemployment, JobSeeker and JobKeeper, together with the 490,000 mortgages with payment deferrals provides the backcloth for our analysis. However, by examining the financial flow status of households we have noted some realignment of households in the past month, with more casual and part-time workers able to return to work, but a significant rise in structural unemployment as larger companies, such as larger retailers, big consulting firms, and finance firms, make reductions in staff. These permanent cuts reflect the rightsizing of businesses in reaction to the economic downturn. Then we have the new Melbourne lock-down.
Mortgage Stress
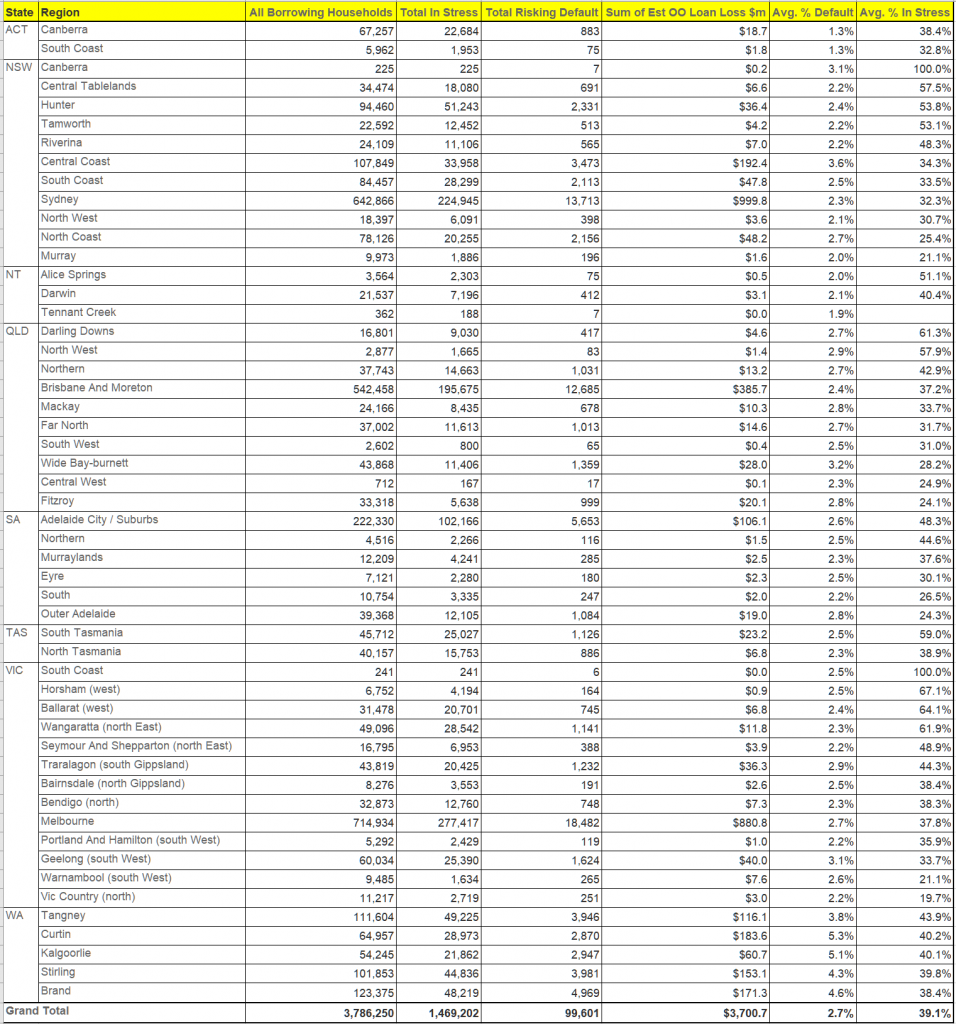
Turning to the detailed analysis, across the states, Tasmania has the highest proportion of households in mortgage stress, at 49.4%, followed by the NT and Victoria. However, the largest counts of stressed mortgage holders are in NSW, with 408,540 and VIC with 406,958. The highest risk of default rates are found in WA at 4.7%, VIC at 2.6% and SA at 2.6%.
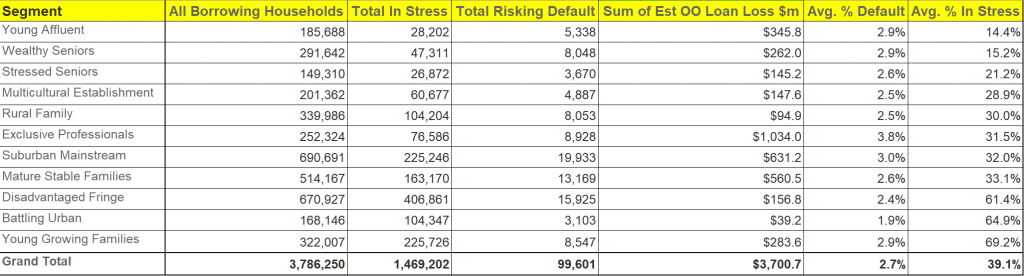
Within our household segments, the highest mortgage stress levels are among Young Growing Families, at 69.2% of households, which includes cohorts of recent first-time buyers, with more than 225,000 households at risk. Next, those on the urban fringe, are also exposed, along with more typical battlers. We are also seeing a rise in affluent stress, where households on higher incomes are experiencing significant issues. The Exclusive Professional segment, the top few percent on an income basis, include 31.5% stressed, which equates to more than 76,000 households across the country. Significantly, in value terms, they hold around 28% of all default risk to the banks by value.
Mortgage stress is apparent not just in the main urban centres, but across the regions. This is a structural not caused by COIVD, but amplified by it.
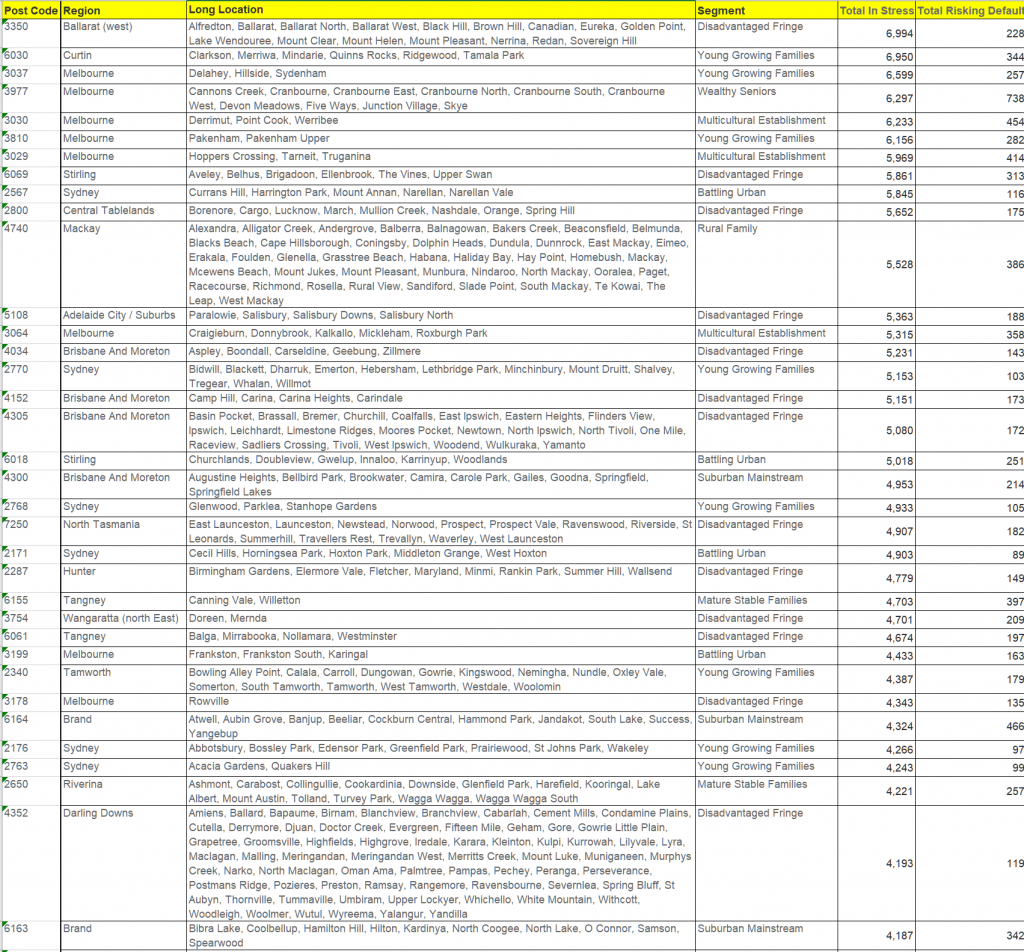
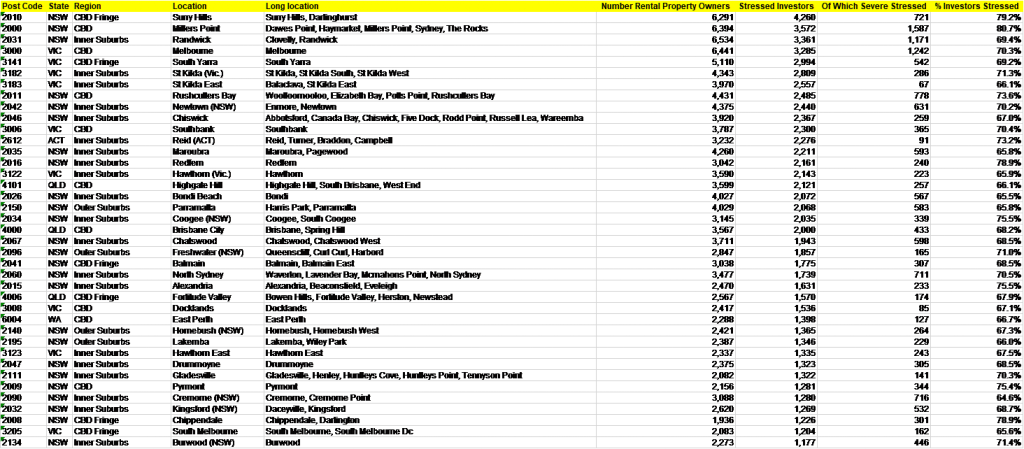
Stress varies by post code. Here are the top 30:
Rental Stress
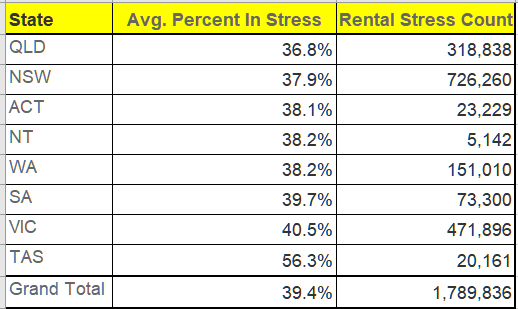
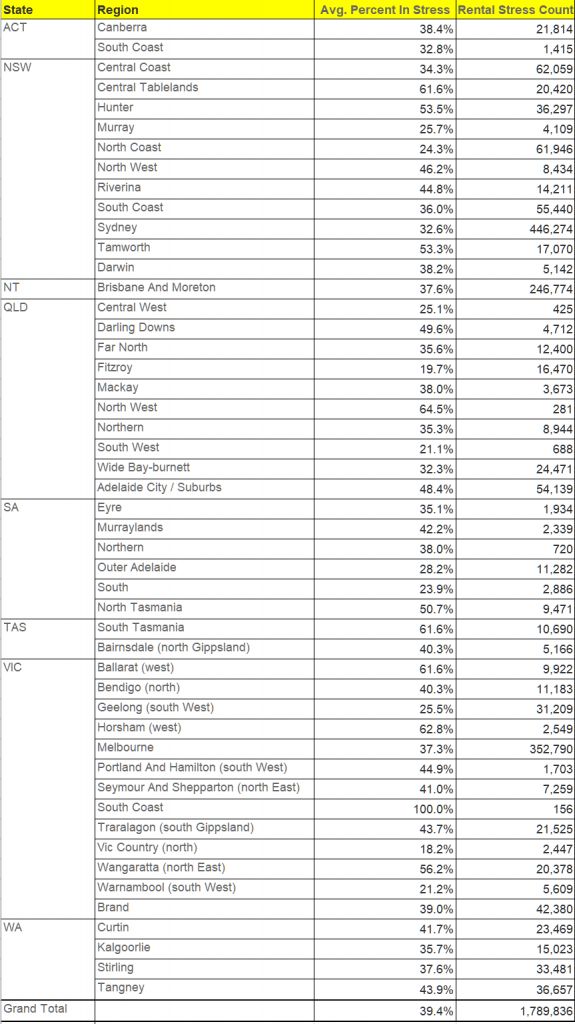
Turning to rental stress, the patterns are somewhat similar. The highest stress among renters is found in TAS at 6.3%, followed by VIC at 40.5% and SA at 39.7%. Whilst on a percentage basis the lowest levels of stress are in QLD (36.8%) and NSW, 37.9%, in fact the largest count of stressed households in also in NSW, as here the proportion of households renting is the highest (reflecting the poor affordability of housing in the state, despite rents falling in real terms.
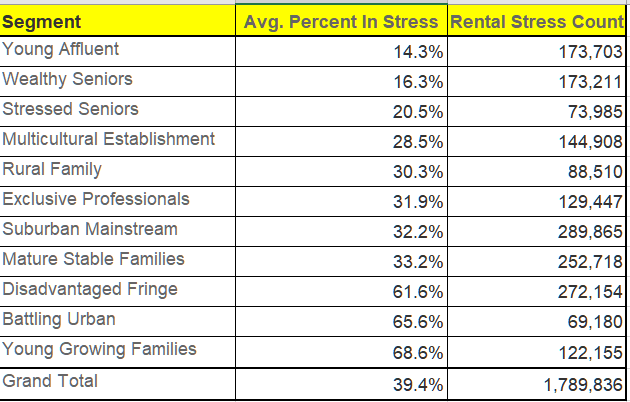
Across the DFA household segments, once again, Young Growing Families are most stressed, at 68.6%, whereas the largest counts are among suburban mainstream households (289,000), Disadvantaged Fringe (272,000) and Mature Stable (252,000).
Once again rental stress is widely distributed across the regions, and should not be regarded as a capital city problem.
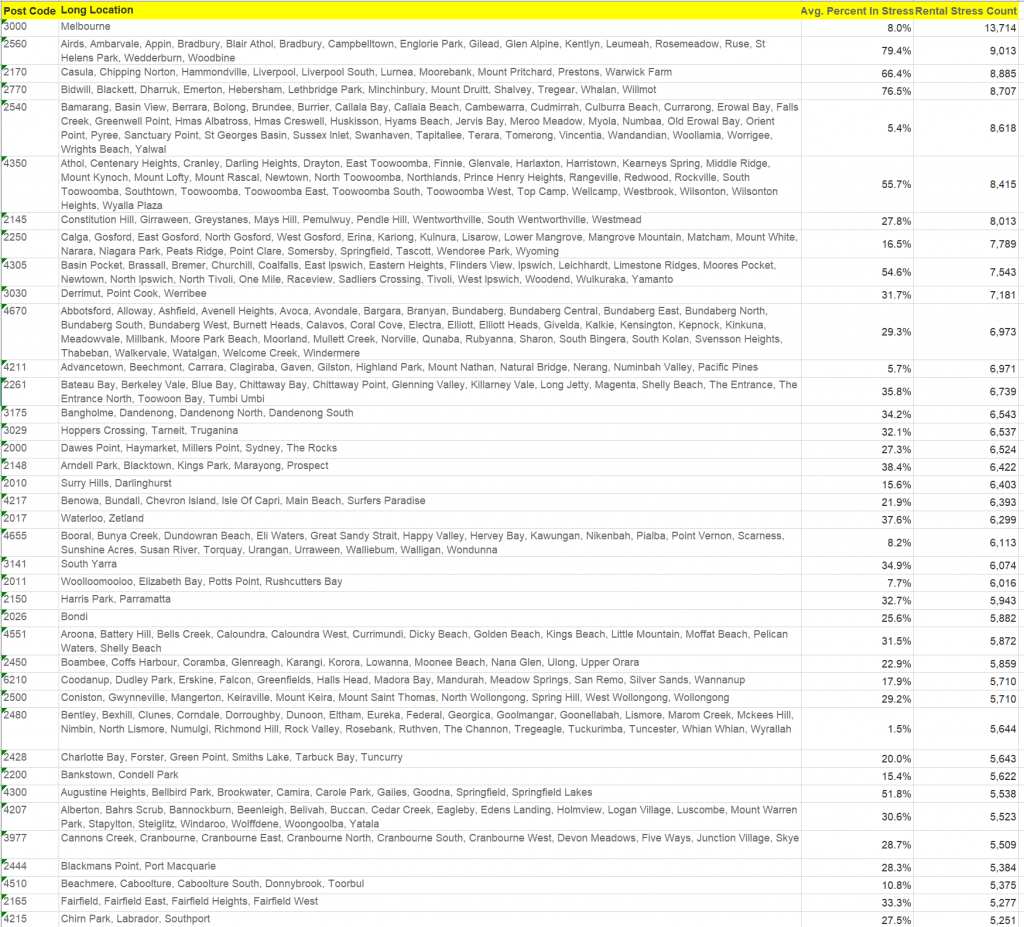
Rental stress by postcode
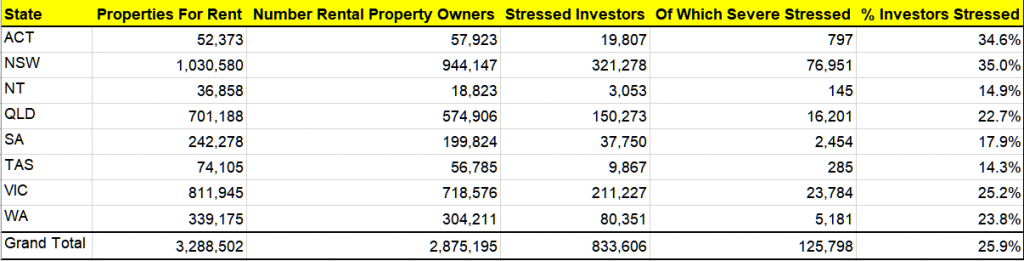
Property Investor Stress
Finally, for the first time we are also reporting on property investors, and their property holdings. Across Australia, there are around 3.2 million properties available for letting (including short-term AirBnB type rentals as well as longer term residential). This excludes motels and hotel accommodation.
These properties are owned by around 2.8 million entities, including households and businesses. Around half the property available is covered by investment mortgages, which equates to around 1.65 million borrowers.
Of these 2.8 million entities, around 830,000 on a cash-flow basis, are not making sufficient to recover the costs of owning and letting their properties (stressed investors) of which 126,000 are severely stressed, most often because of low occupancy, or high repair costs. This is around 25.9% of all investment property, and 51.3% of mortgaged properties.
One complexity when analysing the more detailed footprint of investment property is that many owners live in different post codes to the properties they own. To account for this, we report the number of properties based on the location of the property itself, while the number of property investors and their stress status are reported on the basis of their home address, not the address of the property. That said, more than half reside in the same post code as their investment property.
NSW has the highest proportion of stressed investors at 35%, or around 321,000.
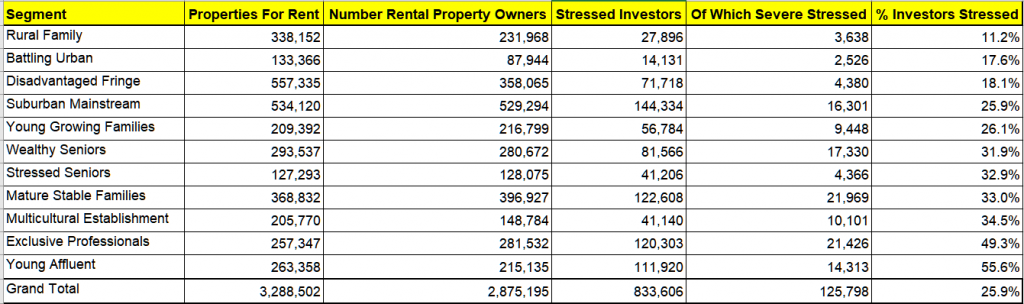
By segment, the most highly stressed investors are Young Affluent and Exclusive Professional investors (many of whom have multiple investment properties, so the pain is magnified).
The top stressed investor postcodes include areas close the CBD of Sydney and Melbourne, including Surry Hills, Millers Point and Randwick in Sydney and Melbourne CBD, South Yarra and St Kilda in Melbourne.
The full stress series is available via our Patreon page for US$50 plus GST. You can subscribe there to receive full monthly updates.
We have had a number of people asking for some analysis of the rental sector, (including on our recent Live Event, which by the way is still available to watch) as well as in the comments on the channel. So today we take a look, using data from our household surveys, and other sources. This is part one of our latest series.
And by the way, if you value the content we produce please do consider joining our Patreon programme, where you can support our ability to continue to make great content.
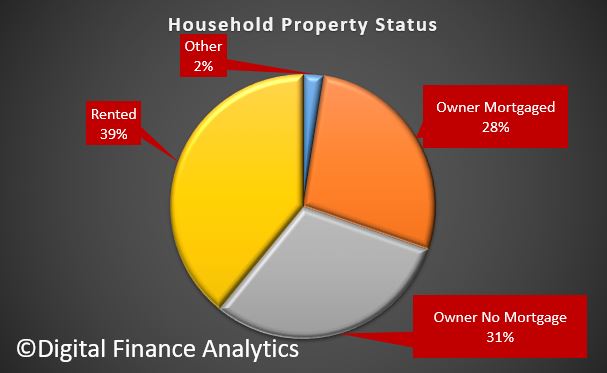
To start with, across our surveys, there are 31% of households owning property mortgage free, 28% who have owner occupied property with a mortgage, and 39% of households renting. In fact, in recent years the proportion of households renting has been rising, and faster than the mortgaged sector, which itself is growing.
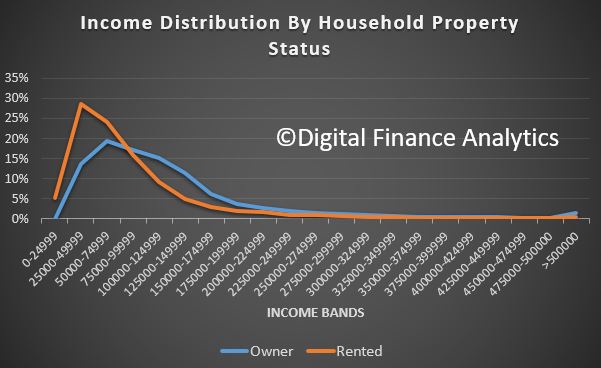
Looking at average household incomes across those who are owners and those who are renting, it is striking that relatively more households with an income below $100,000 are renting, whereas higher up the income ranges, more are owners. So income is one element which drives property choices, perhaps no surprise there.
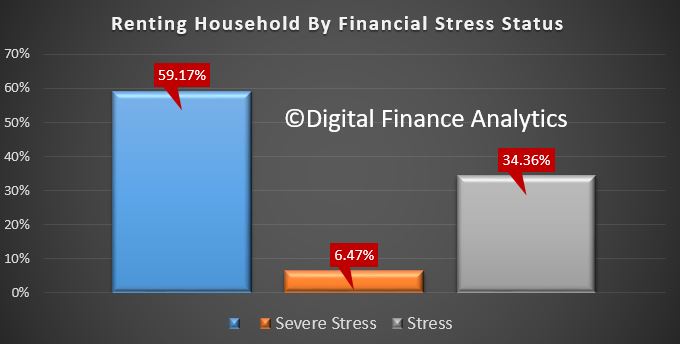
Turning specifically to the rental sector, we can look at household income and expenditure, just as we do with mortgage stress. Where expenses, including rental payments are lower than incomes, we classify these households as in severe rental stress. Where income and expenditure is borderline, they are in stress. And here’s the thing. 34% of renters are in stress and an additional 6% are in severe stress, meaning that close to 40% of those renting are living in financial stress, combined. This is compared with 30% of those in mortgage stress. So financial stress is more widespread among renters.
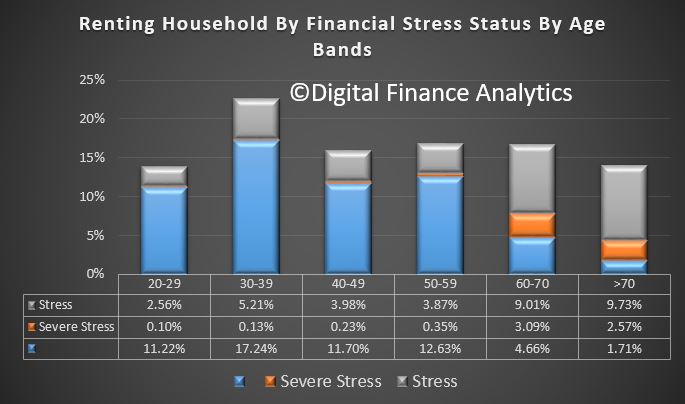
We can take the analysis further by looking at the relative stress distribution by age bands. While stress appears across all the age groups, we find that the bulk of households in severe stress are aged 60 or more. We also see a significant concentration of financial stress more generally here, as well as in those aged 30-39, where we see many young growing families are also under the gun.
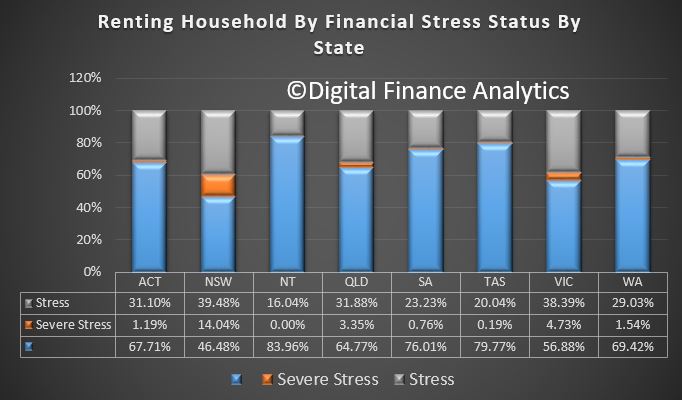
Looking across the states, we find that the state with the most stress is NSW, where just 46% of renters have no financial stress, compared with nearly 80% in Tasmania. In addition, we find that 14% of renters in NSW are in severe stress, compared with 5% in VIC and 3% in QLD. This can be directly traced to the average property value, and rental payments, which are highest in NSW.
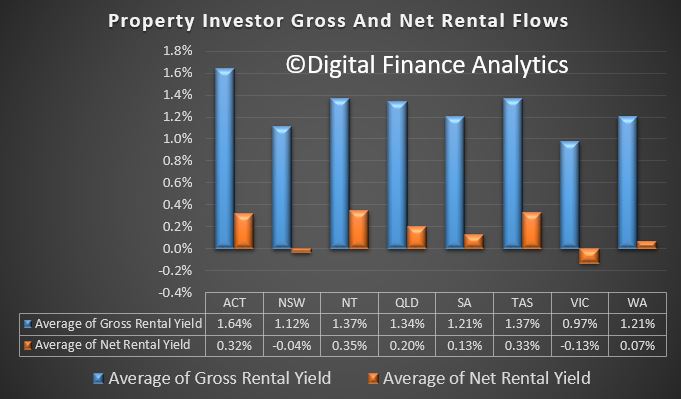
Now let’s flip the view to those providing rentals, by looking at investment property owners. We are able to calculate the gross rental yield and net rental yield, the latter after accounting for the costs of managing the property, repairs, etc. as well as repayments on the mortgage. On average, net rental yields are highest in ACT, TAS and NT, whereas those in VIC are most likely to be under water – in fact many owners, according to our surveys have not even tried to calculate these returns, preferring to look at the capital appreciation, and after tax position. We calculate our returns before any tax breaks, on a cash flow basis.
This means that many investors are NOT covering the full costs of owning a rental property, and of course if capital values fall in real terms, then this becomes a significant drain on household finances, and that’s before the upcoming changes in interest only loans, as they are switched to higher cost principal and interest loans.
So standing back, we can see the on one side renters are under pressure, and on the other so are many property investors, who despite owning the property are also feeling the pinch. This does not bode well for the future health of the market. In summary we are looking at a major policy failure.
There is much discussion of mortgage stress, some of which we highlight by our ongoing research into the growing numbers of households under financial pressure. The results for July will be out soon.
But rental stress is less discussed, but in our mind is equally significant, so today we explore some of the data in our Core Market Model to July 17. In fact there are more households in rental stress than in mortgage stress according to our analysis. We know their financial confidence on average is lower.
First, we need to define rental stress. Whilst some will use a “30% of income to pay the rent” as a benchmark, we do not think it is an adequate measure – not least because we see large numbers of households renting where more than 30% of income is paid away on rent, yet they are not in financial difficulty. Others pay less away, but are in stress. 30% is too arbitrary!
So we look at net cash flow. If households, once they pay their rent, tax and other outgoings have close to nothing left, or a small deficit, at the end of the month, they fall into our mild stressed category. Those with a severe cash deficit at the end of the month, are in serve stress.
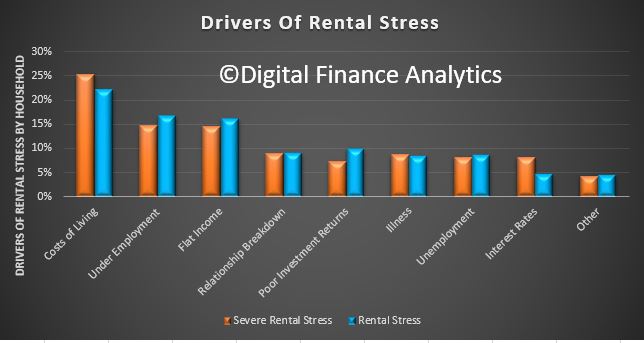
We start by looking at the causes of rental stress. Using data from our surveys, we find that costs of living, under employment and flat incomes are the main causes of rental stress.
Those renting tend to hold less financial assets, so are more exposed, especially where they are also responsible for bills (electricity, council rates etc). Those in difficulty will be more likely to hold multiple credit cards, and also access short term loans to get by. Those in the stressed categories will be less likely to spend at the shops, and so are a brake on economic activity. One strategy some use is to move to cheaper rented accommodation, with poorer facilities to reduce outgoings. The migratory nature of renters, especially those in stress are not well understood. The current tenancy regulations in Australia are pretty weak. Much of this movement is not reported, nor recorded.
So, lets look at some of the numbers, remembering one third of households are renting, in round numbers that is 3 million households.
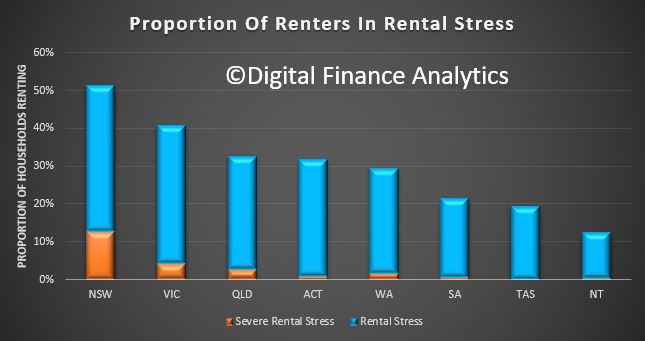
Looking by state, more than half of renters in NSW are in rental stress (on our definition), and the highest proportion of any state here are in severe rental stress. The proportion of households in stress fades away as we look across the other states and territories. But the three most populous states have the highest rental stress levels.
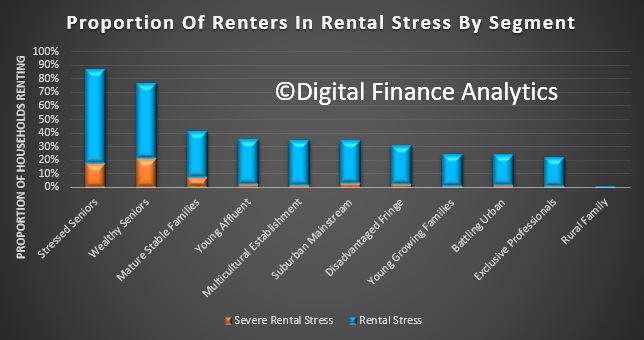
Looking across our segments, we see that older households are more under stress, and a significant proportion in severe stress. Whilst wealthy seniors may hold some savings, stressed seniors do not. Many are reliant on Government support.
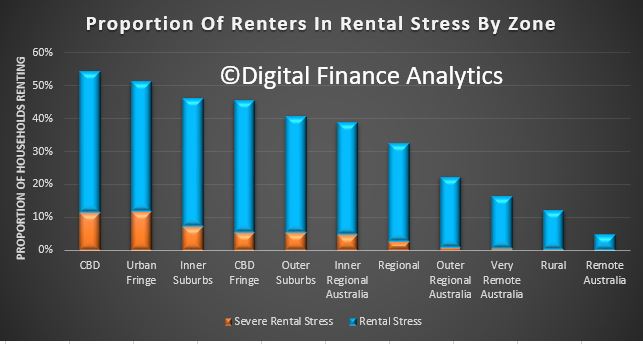
Looking across the geographic zones (a series of concentric rings around our main urban hubs) we see significant levels of stress in the urban centres, as well as on the urban fringe. The former is being created by high rents – especially in the newly constructed high-rise blocks being thrown up across the eastern states, often occupied by young affluent households; whilst in the urban fringe, it is more about depressed incomes. We see stress rolling out into the regions, but is less apparent in the more rural and remote areas.
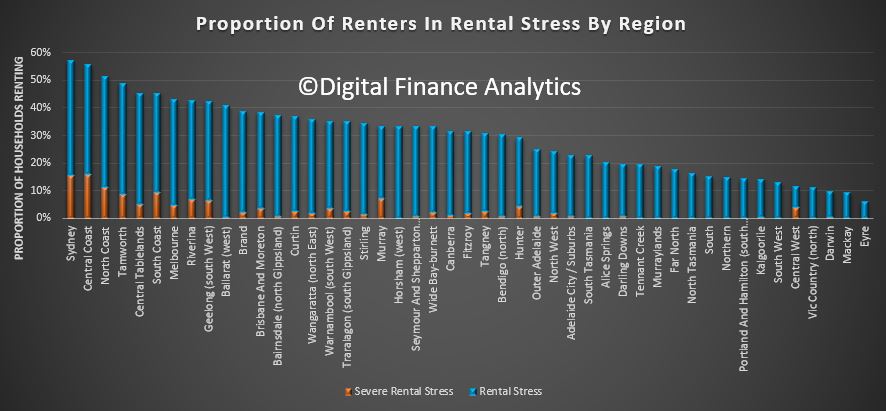
Finally, here is list of the regions across the country. Greater Sydney and the Central Coast have the highest representation of stressed renters as a proportion of all households renting.
All this highlights the issues we have due to the combination of flat incomes, and rising costs. It is also the obverse of the picture we revealed yesterday, where we showed rental growth is very low (causing more investors to have a net cash-flow problem).
Once again we see the outworking of poor public policy over a generation. With an internationally high proportion of property investors and a high proportion of people who are likely to never own their own property, rental stress provides another important perspective of the issues we face.
We have very granular data, down to post code, but that will get too detailed for this post.
Two new tools for measuring and visualising problems in our rental housing system are in the media this week. They have similar names – the Rental Affordability Index (RAI) and the Rental Vulnerability Index (RVI) – but use different methods to offer distinct but complementary perspectives. Together they reveal that almost nowhere in our capital cities can low-income households – and those on average incomes in Sydney – afford the median rent. Mapping rental vulnerability reveals households in regional areas are struggling too.
The RAI is a project of National Shelter, the peak housing NGO, and SGS Economics and Planning. It gives us a bird’s-eye view of rental housing costs over most of Australia. It does this by showing how affordable the median rent (the midpoint of all rents) is – or isn’t – relative to incomes in each postcode.
An alternative approach considers where and in what proportion renters are actually in stress. We might also consider a range of other factors that indicate where and in what proportion renters are vulnerable to problems in accessing and keeping decent, secure housing. This is the approach we’ve taken with the RVI.
What does the RAI tell us?
Affordability is a relative concept – it is about costs relative to incomes. The RAI considers median rents higher than 30% of a household’s income to be unaffordable. The index shows other grades either side of this benchmark (very affordable, very unaffordable) too.
The Rental Affordability Index web tool zoomed in on Queensland.SGS Economics and Planning
This is consistent with a widely used benchmark in housing policy, often known as the “30/40 rule”: housing costs should not exceed 30% of income for households in the lowest 40% of incomes.
The rationale is that when low-income households have to spend more than that on housing, they start to go without other things – meals, health care, outings – that they reasonably ought to have. For this reason, low-income households in unaffordable housing are said to be in “housing stress” or “rental stress”.
The RAI looks at median rents, not the rents individual households are paying. This means it doesn’t tell us where or how many households are actually in rental stress. But it does indicate where renters face different degrees of pressure, in terms of either rents or constraints on the size, quality or location of dwellings.
So, looking at the affordability of median rents for a number of typical low-income households – single and couple pensioners, single people on benefits, single-parent part-time workers – the RAI shows that almost nowhere in Australia’s capital cities is the median rent affordable for them.
The RAI also applies the 30% benchmark higher up the income scale. Even for average-income renters, all Sydney postcodes – except for Mt Druitt and in the Blue Mountains – have median rents that are unaffordable or worse.
Of the capitals, Sydney’s affordability problems are deepest and spread furthest, but much of Melbourne and Brisbane is unaffordable to average renters too. Outside the capitals, most of the regions are affordable.
The quick takeaway from this perspective would be support for policies to increase the supply of affordable rental housing, particularly in our capital cities. These measures would include:
changing planning rules to allow more residential development
using inclusionary zoning to ensure a proportion of new development is kept as affordable rental
making greater use of land tax, including on owner-occupied housing, to ensure land owners don’t speculatively sit on development opportunities.
What does the RVI tell us?
For a different perspective, the City Futures Research Centre produced the Rental Vulnerability Index (RVI) for Tenants Queensland. This shows (only for Queensland, at this stage) a range of “housing system” and “personal” factors that we know, based on a wider body of research on housing and legal needs, indicate vulnerability to housing problems.
The housing system indicators include: rental stress, availability of rental housing that is affordable on local incomes, social housing and marginal tenures such as boarding houses, as well as personal indicators including unemployment, low education, disability, single-parent households and both young and elderly renters.
As well as mapping each of these indicators, the RVI uses principal component analysis. This enables us to look across the indicators to see where they cluster together as a generalised “rental vulnerability”.
The Rental Vulnerability Index web tool.City Futures Research Centre
Mapping this out we see that rental vulnerability in Queensland is highest in the regions. In particular, it is high around Bundaberg, Fraser Coast and Gympie, with a band of vulnerability skirting the regions west and south of Brisbane. Cairns also has several highly vulnerable postcodes.
These places have high rates of unemployment, disability, low education and older people in rental housing. They also have high incidence of rental stress – even though median rents are low compared to Brisbane.
By contrast, Brisbane generally scores quite low on rental vulnerability. This isn’t because there aren’t any vulnerable households there – there are. But their presence is masked by renter households who are doing well in terms of income, employment, education and other indicators.
There is a substantial body of research on the “suburbanisation of disadvantage”. This is the phenomenon of high housing costs pushing out, and shutting out, low-income and otherwise disadvantaged households from city centres. The RVI indicates that this process, at least in Queensland, is extending into a “regionalisation of disadvantage”.
So what can we do about this?
The takeaway from this? Housing problems are multidimensional and extend beyond the capital cities.
Regional areas have a pressing need for services – such as tenants advice services – that give vulnerable households material assistance in dealing with housing problems.
But more than that, we need to build up the economic and social capital of these places – so that they offer greater opportunities for the vulnerable households who are concentrated there – just as we need policies to increase affordable housing opportunities in our cities.
Authors: Chris Martin, Research Fellow, City Housing, UNSW; Laurence Troy, Research Fellow – City Futures Research Centre, UNSW

 Blog")