Stage 3 Tax Revamp: A Speck In The Ocean?

Lots of noise this week about the revamped stage 3 tax cuts. It’s worth remembering first that 2 in five Australians pay no tax because they do not earn enough, so this is change is certainly not going to impact every household.

Anthony Albanese had repeatedly committed to delivering stage 3 as legislated by the Coalition – but told the National Press Club on Thursday, “When economic circumstances change, the right thing to do is change your economic policy. That’s what we are doing.”

At one level of course this is another broken promise – just like the superannuation tax cap which came in last year. Presumable the calculus is more people will benefit than not, and it’s a long time to the next election, so people will forget. We will see.

http://www.martinnorth.com/

Go to the Walk The World Universe at https://walktheworld.com.au/

Digital Finance Analytics (DFA) Blog
Stage 3 Tax Revamp: A Speck In The Ocean?
Loading
/

A Taxing Time For Queensland Investors… [Podcast]

Queensland has been a state where property investors have traditionally made better returns on a net and gross basis, from investment property in the state, compared with those in New South Wales and Victoria.

To recap, gross investment returns is the ratio of current property market value compared with the current rental paid, assuming the property is fully let. The Net Investment return is a more real-world measure, which takes account of actual vacancy rates, cost of mortgage, maintenance, and management of the property. In our surveys, many property investors have no feel for their true net returns, clinging to the prospect of eternal capital gains.

Those in Victoria are worst placed, which explains the very strong interstate investment in Queensland, one reason why prices and rents had shot up in the past couple of years.

But there is something afoot in Queensland, which could change this picture, possibly significantly. Indeed, those following the AFR will have noted its fever pitch campaign against an Australian-first move whereby landholders will have to voluntarily disclose their interstate holdings in other states before being taxed for their Queensland holdings. These land tax changes were first announced in the 2021-22 budget update on 16 December 2021. Queensland Treasury has said the tax change will raise only $20 million a year from 2023-24 and impact about 10,000 landholders, most of whom who live interstate.

Investors are irate with the changes, saying they will drive investors out of Queensland as well as push up rents and that they felt like they were being taxed twice in two different states. A spokesman for Mr Dick acknowledged this week the tax change would affect some Queensland investors.

So now Queensland owners are now working out how they will be stung by the tax.

Go to the Walk The World Universe at https://walktheworld.com.au/

Digital Finance Analytics (DFA) Blog
A Taxing Time For Queensland Investors... [Podcast]
Loading
/

A Taxing Time For Queensland Investors…

Queensland has been a state where property investors have traditionally made better returns on a net and gross basis, from investment property in the state, compared with those in New South Wales and Victoria.

To recap, gross investment returns is the ratio of current property market value compared with the current rental paid, assuming the property is fully let. The Net Investment return is a more real-world measure, which takes account of actual vacancy rates, cost of mortgage, maintenance, and management of the property. In our surveys, many property investors have no feel for their true net returns, clinging to the prospect of eternal capital gains.

Those in Victoria are worst placed, which explains the very strong interstate investment in Queensland, one reason why prices and rents had shot up in the past couple of years. But there is something afoot in Queensland, which could change this picture, possibly significantly.

Indeed, those following the AFR will have noted its fever pitch campaign against an Australian-first move whereby landholders will have to voluntarily disclose their interstate holdings in other states before being taxed for their Queensland holdings. These land tax changes were first announced in the 2021-22 budget update on 16 December 2021. Queensland Treasury has said the tax change will raise only $20 million a year from 2023-24 and impact about 10,000 landholders, most of whom who live interstate.

Investors are irate with the changes, saying they will drive investors out of Queensland as well as push up rents and that they felt like they were being taxed twice in two different states.

A spokesman for Mr Dick acknowledged this week the tax change would affect some Queensland investors.

So now Queensland owners are now working out how they will be stung by the tax.

Go to the Walk The World Universe at https://walktheworld.com.au/

Held Out To Dry By The Powerful!

The head of the United Nations has accused oil and gas companies of “grotesque greed” and urged every government to impose a windfall tax on their “immoral” record profits. António Guterres, UN secretary-general, said money made “on the backs of the poorest” must be returned to the most vulnerable households just days after BP and Shell reported massive profits in the wake of the Ukraine crisis.

Tony Wood, the head of the energy program at the Grattan Institute in an opinion piece in the AFR, says that the latest, six-monthly Gas Inquiry Report released on Monday by the Australian Competition and Consumer Commission (ACCC) does not go far enough. The findings of the latest Gas Inquiry Report make for depressing reading. The concerns identified are severely harming both gas and electricity consumers, and we have not yet seen the worst.

We covered this report in an earlier show, and also discussed it last Tuesday on our live show with David Llewellyn Smith. Put simply the Energy cartel are taking Australians to the cleaners, and making excess profits in the process – largely war-induced thanks the Russia Ukraine situation. 97% of the Gas conglomerates are offshore owned, and so the excess profits are going offshore, whilst crippling the local economy, businesses and households.

Tony Wood makes the point that the stated objective of Australia’s national gas market is to supply natural gas services for the long-term interests of consumers. But this is simply not the market described in the latest ACCC report.

Today’s post is brought to you by Ribbon Property Consultants. If you are buying your home in Sydney’s contentious market, you do not need to stand alone. This is the time you need to have Edwin from Ribbon Property Consultants standing along side you. Buying property, is both challenging and adversarial. The vendor has a professional on their side. Emotions run high – price discovery and price transparency are hard to find – then there is the wasted time and financial investment you make. Edwin understands your needs. So why not engage a licensed professional to stand alongside you. With RPC you know you have: experience, knowledge, and master negotiators, looking after your best interest. Shoot Ribbon an email on info@ribbonproperty.com.au & use promo code: DFA-WTW/MARTIN to receive your 10% DISCOUNT OFFER.

Stamp Duty Take On The Decline

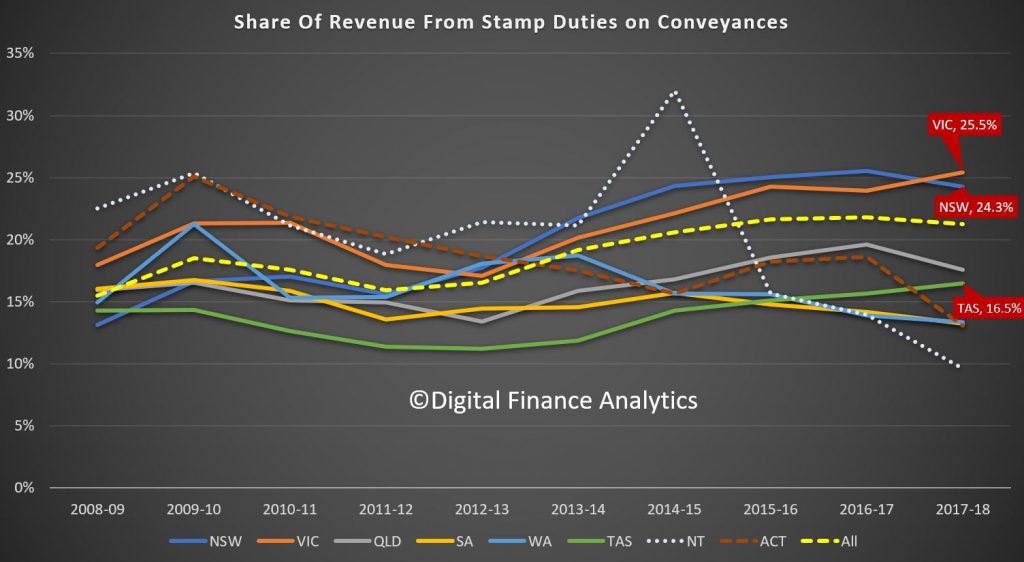
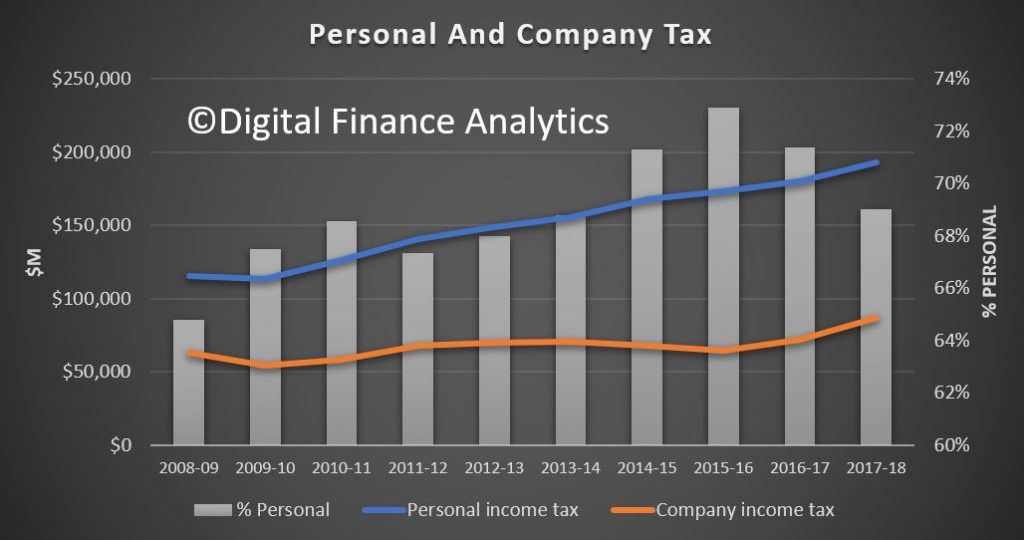
The ABS released their taxation revenue statistics to 2017-2018 today. The series contains many interesting nuggets of insight, but there were two which stood out for me.

First, the share of revenue for the states, drawn from stamp duty is falling, but still makes up 25.5% of Victoria’s take and 24.3% of New South Wales. Guess what will happen in the housing sales momentum continues to ease.

State coffers will be under pressure (so expect to see ways to entice people to transact ahead).

The other relates to the mix of personal income tax and corporate tax, bearing in mind that in real terms, personal income is flat, while company profits are pretty healthy (for now).

We see that back in 2008-9 the proportion of personal tax sat at 64.8%, rose to a peak of 72.9% in 2015-16, and sat at 69% in 2017-18. Bracket creep will explain much of the rise of course.

Puts the drive to reduce company tax further into a different context, given the current financial pressures on households.

Australian Homebuyers Paid Out Over $21 billion In Stamp Duty Last Year

HIA’s Stamp Duty Watch report, released today, reviews the latest developments around stamp duty across Australia’s eight states and territories.

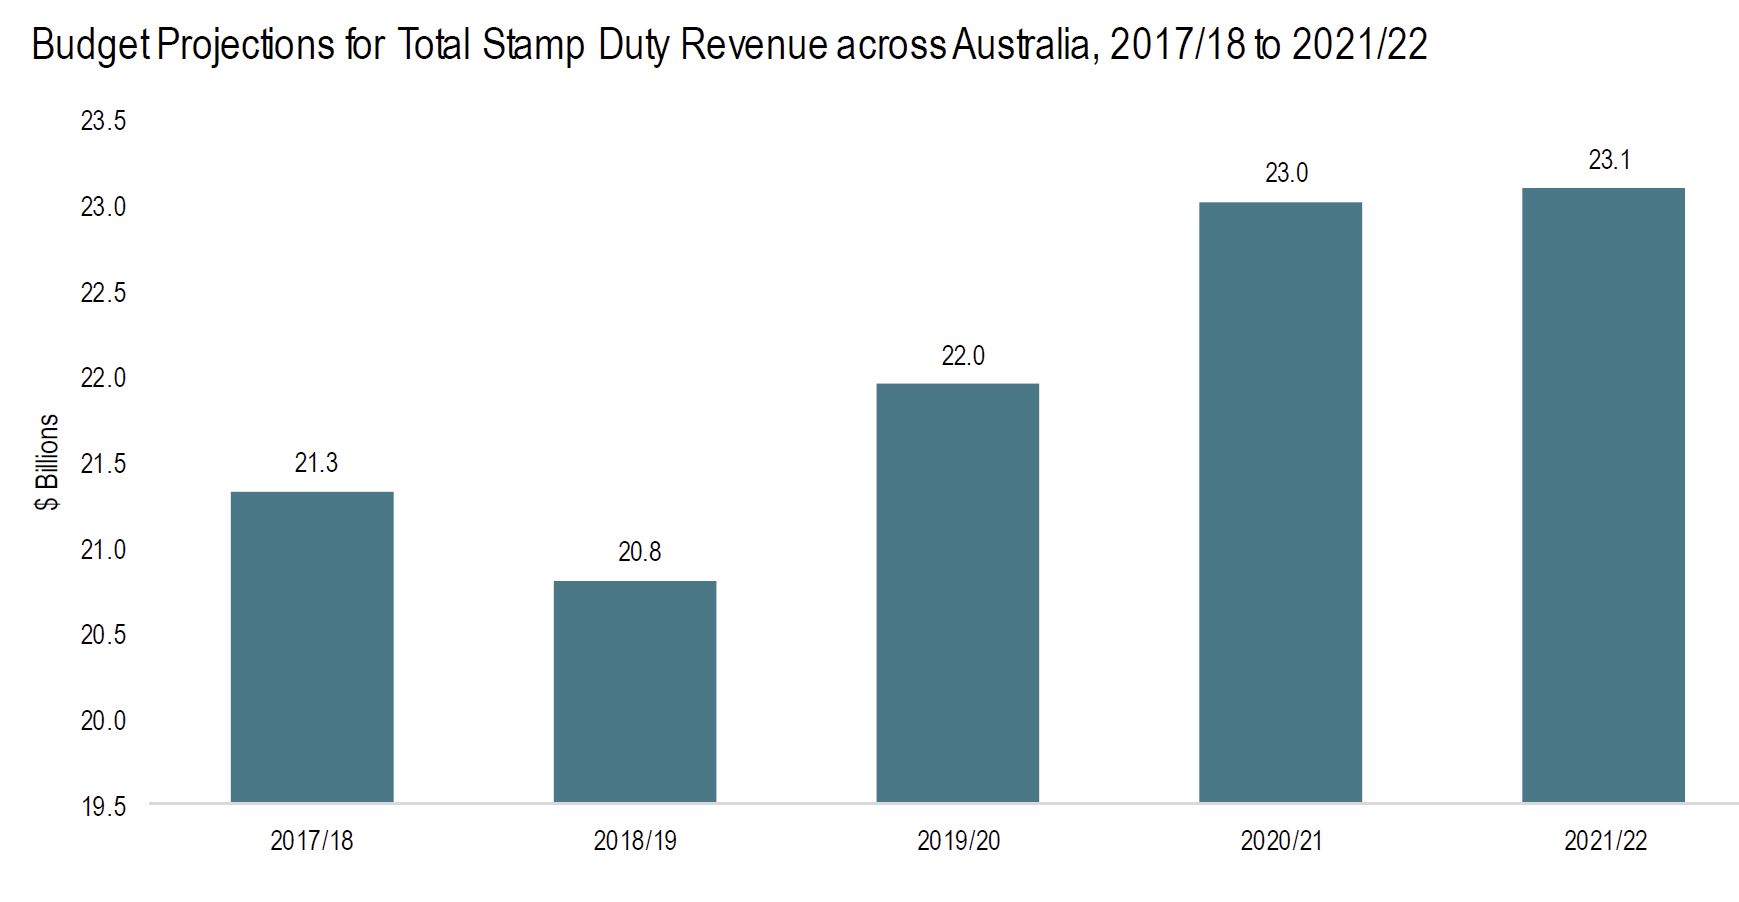
“Australian homebuyers paid out over $21 billion in stamp duty to state governments during the 2017/18 financial year – and the total cost of the tax is expected to get even bigger over the next few years,” explained HIA Senior Economist, Shane Garrett.

“The Report shows that revenue from stamp duty across the states and territories has doubled over the past 8 years. This has added considerably to the cost of buying a home and represents a real setback for affordability.

“The recent set of state Budgets envisage stamp duty revenues increasing by another 11 per cent over the next four years.

“This will involve homebuyers’ having their pockets drained to the tune of $23.1 billion annually by 2021/22 through stamp duty.

“State governments are more dependent on stamp duty than at any time in the last decade. Stamp duty is notoriously unstable and Australia’s largest states are heavily exposed to any downturn in duty receipts should economic conditions change.

“Housing affordability and the sustainability of government finances would both be winners if stamp duty was replaced by better revenue-raising designs. Australian governments really need to tackle this issue once and for all,” concluded Shane Garrett.

How incomes, taxes and benefits work out for Australians

From The Conversation.

The Australian Bureau of Statistics has just released its latest analysis of the effects of government benefits and taxes on household income. Overall, it shows government spending and taxes reduce income inequality by more than 40% in Australia. Disparities between the richest and poorest states are also greatly reduced.

The ABS analysis provides the most up-to-date (to 2015-16) and comprehensive figures on the impacts of government spending and taxes on income distribution. As well as direct taxes and social security benefits, it estimates the impact of “social transfers in kind” – goods and services that the government provides free or subsidises. These include government spending on education, health, housing, welfare services, and electricity concessions and rebates.

The figures also include a wide range of indirect taxes. Among these are GST, stamp duties and excises on alcohol, tobacco, fuel and gambling.

The 2015-16 results are the seventh in a series published every five to six years since 1984. The methodology is based on similar studies by the UK Office of National Statistics since the 1960s. The latest UK analysis coincidentally also came out on Wednesday.

How do the calculations work?

The ABS analyses income distribution in a number of stages.

First, it calculates the distribution of “private income”. This includes wages and salaries, self-employment, superannuation, interest, dividends and income from rental properties, among other items. It also includes net imputed rent from owner-occupied dwellings and subsidised private rentals.

Next the ABS adds social security benefits, such as the Age Pension, unemployment and family payments, to give “gross income”.

Then it deducts direct taxes – primarily income tax – to give “disposable income”.

The next stage is to add the estimated value households derive from government services. This is mainly the value of public health care and education spending.

The final stage is to deduct the estimated value of indirect taxes.

So what are the impacts on income inequality?

It is possible to calculate measures of economic inequality at different stages in this process. By implication, the difference between inequality measures is the result of the different government policies taken into account.

Figure 1 shows the Gini coefficient, which ranges between zero – where all households have exactly the same income – and 100% – where one household has all of the income. The Gini coefficient for private income in 2015-16 was 44.2. The addition of social security benefits, which mainly increase the incomes of low-income groups, reduces the coefficient by 8.1 percentage points.

Deducting income taxes – which are progressive – further reduces inequality by 4.5 points. Government non-cash benefits reduce the Gini coefficient by nearly as much as the social security system. However, indirect taxes slightly increase income inequality.

The Gini coefficient for final income is 24.9. So, compared to a coefficient of 44.2 for private income, government spending and taxes reduce overall income inequality by more than 40%.
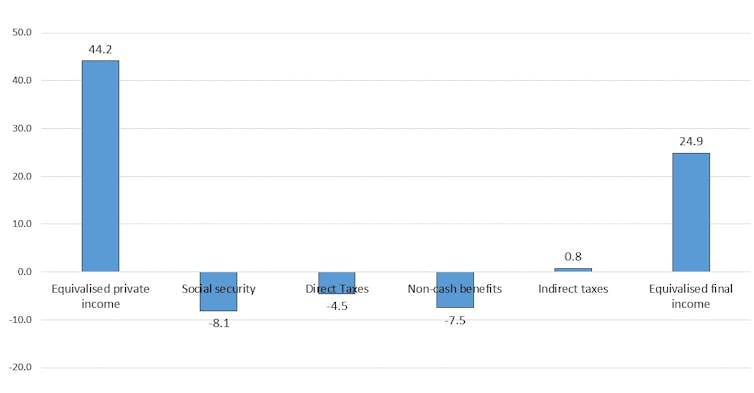
Figure 1: Effects of government spending and taxes on income inequality, measured by Gini coefficient Australia 2015-16. Data source: ABS Government Benefits, Taxes and Household Income, Australia, 2015-16, Author provided

While most of the reduction in inequality is due to government spending, taxes are obviously important to pay for this spending.

The social security system reduces income inequality (and poverty) because Australia targets benefits to the poor more than in any other high-income country.

Figure 2 shows the distribution of social security benefits and government services across income groups, from the poorest 20% to the richest 20% of households. The poorest 20% receive about seven times as much in benefits as the richest 20%. The average for OECD countries is close to one, with rich and poor receiving about the same amount.
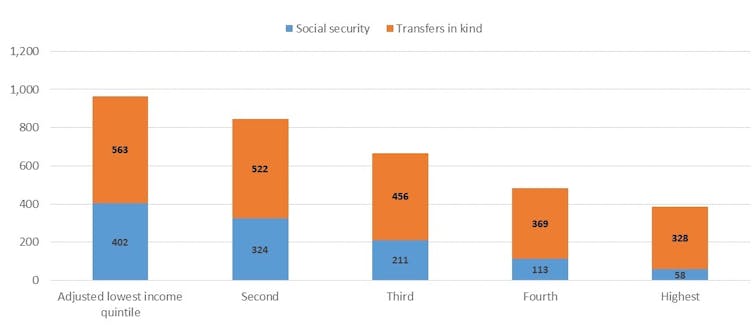
Figure 2: Distribution of social spending ($ per week) by equivalised disposable household income quintiles, Australia 2015-16. Data source: ABS Government Benefits, Taxes and Household Income, Australia, 2015-16, Author provided

Government spending on social services is also progressively distributed. This spending is considerably greater than social security spending and includes both Commonwealth and state spending on education and health.

The poorest 20% receive about 70% more in non-cash benefits than do the richest. This is not due to income-testing. Instead, it’s largely a result of the greater value of public health spending on hospitals and Medicare for older people, who tend to be in the bottom half of the income distribution.

Taxes, of course, work to reduce income inequality, as high-income groups pay a higher share than low-income groups. Figure 3 shows that the poorest 20% pay about 5% of their disposable income in direct taxes, while the richest 20% pay about 30% of their disposable income.

In contrast, indirect taxes – particularly those on tobacco and gambling – are regressive. Low-income groups pay more than high-income groups as a share of their disposable income. However, the undesirable effects of smoking and gambling on the wellbeing of low-income households need to be borne in mind.

When direct and indirect taxes are added together the overall tax system is less progressive, but the richest 20% still pay nearly twice as much of their disposable income as do the poorest 20%.
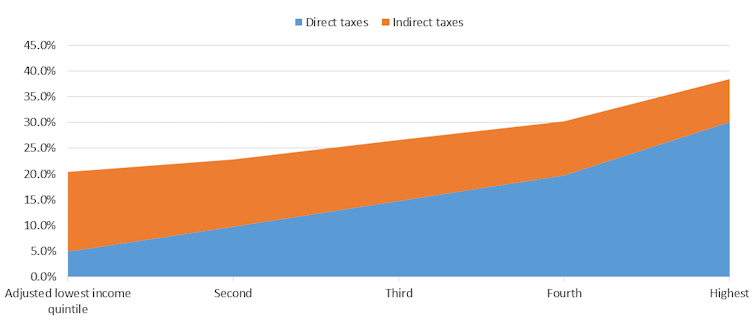
Figure 3: Distribution of direct and indirect taxes (% of disposable income) by equivalised disposable household income quintiles, Australia 2015-16. Data source: ABS Government Benefits, Taxes and Household Income, Australia, 2015-16, Author provided

Redistribution also happens between age groups and states

In addition to reducing inequalities between income groups, government spending and taxes redistribute across age groups. Government spending is much higher for households of Age Pension age than for younger households. This is because of both the Age Pension and older households’ use of the healthcare system.

For example, households where the reference person is 75 or older receive on average just over $1,000 a week in government spending but pay about $180 a week in direct and indirect taxes. Households with a person aged 45 to 54 pay the highest taxes on average – about $800 per week – and on average receive about $620 a week in social spending.

There is also redistribution across states and territories. For example, average private income is about 65% higher in Western Australia than in Tasmania. However, on average, Western Australian households receive about two-thirds of the social security benefits that Tasmanian households get. This reduces the disparity in gross income to about 45%.

Western Australian households pay about twice as much in income taxes as Tasmanians, reducing the disparity to 35%. Households in the West receive only about 3% more in spending on social services than in Tasmania, which reduces the disparity in average incomes to 28%. West Australian households also pay about 20% more in indirect taxes than Tasmanian households (although as a percentage of disposable income, this is a higher share in Tasmania).

These figures suggest that while the financing of fairly equal social services across most parts of Australia reduces inequality between states, the income tax and social security systems also significantly reduce disparities. This is because income tax and social security are national systems and because Tasmania is the poorest state largely due to the higher share of age pensioners in its population.

Overall, this publication provides an invaluable picture of how government spending and taxes affect household economic well-being. Its results are relevant not only to the political debate about tax cuts, but also to long-term policy development to prepare Australia for an ageing population.

Author: Peter Whiteford, Professor, Crawford School of Public Policy, Australian National University

The Coalition’s income tax cuts will help the rich more, but in a decade everyone pays more anyway

From The Conversation.

Does the Coalition’s tax plan favour high earners over those with lower incomes?

Depending whom you listen to, the tax cuts, unveiled in last month’s federal budget, lead to either a flatter, more regressive tax system under which low-income earners will be even worse off relative to high earners, or the opposite, with a progressive outcome. It can’t be both.

While there are tax cuts proposed from July this year, the most substantial cuts are planned for 2022-23 and then 2024-25. As this is several years away, it becomes tricky to analyse their likely impact.

The main issue is wage inflation, which in turn leads to “bracket creep”. We tend to think about the change in terms of what it means for today’s incomes, but that’s not realistic. An annual income today of A$80,000 will be around A$110,000 by 2027-28 if the government’s wage projections prove to be accurate.

Using our model of the Australian tax and welfare system, PolicyMod, we projected the incomes of each person in the 20,000 families in the underlying model survey data (the Australian Bureau of Statistics’ Survey of Income and Housing 2015-16).

We did this for each year until 2028-29, using the federal budget’s wage assumptions. We then used this to forecast the outcome of the proposed tax cuts, and compared it with the effects of maintaining current tax rates.

Our results are remarkably similar to the forecasts of Treasurer Scott Morrison. He has projected a total tax cut between 2018-19 and 2028-29 of A$143 billion, whereas our model puts this figure at A$140 billion.

Whose tax is being cut?

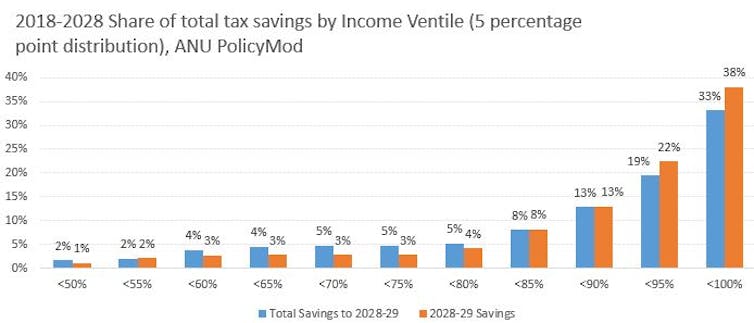
Who will actually receive these tax cuts, and will they really benefit? Our modelling shows around 50% of the adult population pays income tax in a given year. So clearly the benefit goes to the top half of the taxable income distribution.

What’s more, if the tax cuts are only returning bracket creep for many taxpayers, then they are not really tax “benefits”, because they will not make those people better off in real terms.

This is clearly shown in the chart below, where the bottom 50% of taxable income individuals will have a negligible share of tax savings. Around 33% of total savings between 2018-19 and 2028-29 go to people in the top 5% of incomes. In 2028-29 it is 38%.

If this were the end of the story, we might conclude that the tax cuts are grossly unfair. But it’s not quite as simple as that, because people with the highest taxable incomes are not necessarily the “wealthiest” people.

A more reasonable test considers whether the income tax cuts are real or “imagined”. If they are real, average tax rates should be lower. The fairness of the tax cuts can then be judged by the share of the tax burden across the income distribution.

If high earners are paying a larger share of tax than low and middle earners, then we have a more progressive tax system. A less progressive system, in contrast, is a flatter system – although not necessarily a totally flat income tax rate.But determining whether the proposals are progressive or regressive still doesn’t fully answer the question of whether they are “fair”.

Fair tax hikes for all?

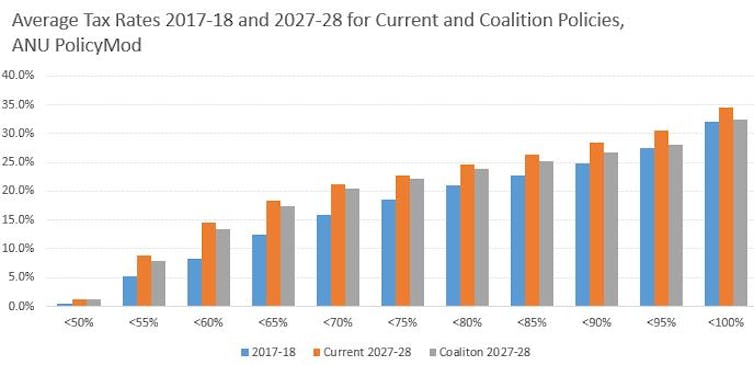
The chart below shows that tax rates will increase for all income groups, although they will rise more slowly if the Coalition’s tax plan is delivered. Crucially, higher earners will feel this difference most keenly. By 2027-28, the top 5% of earners average tax rate will be 2.1 percentage points lower than under the current regime, whereas for the bottom 50% the difference is just 0.2%.

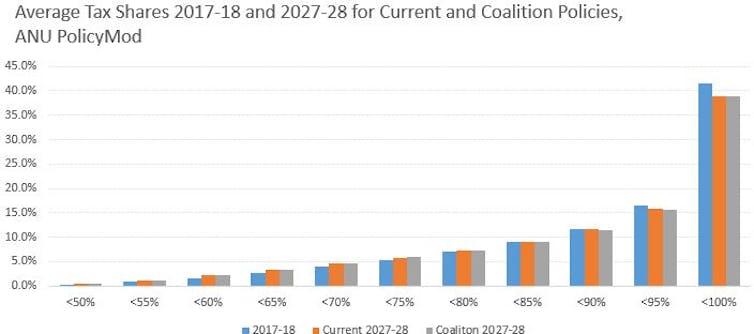
Another way of looking at progressivity is to consider the share of tax paid. The chart below shows that under the current policy trajectory, higher-income groups pay a lower share of tax in future years compared with 2017-18. This occurs naturally due to bracket creep, which tends to impact low- and middle-income people more than those with very high incomes.

In the current financial year the top 10% of earners pay 58% of personal income tax. By 2027-28 this is projected to fall to 54.8% if the tax regime remains unchanged. Under the Coalition’s tax plan it is only marginally lower still, at 54.3%.

Anyway, it is purely hypothetical to extrapolate the current tax regime as far ahead as 2027-28. It is highly likely that future governments will change the tax code for a range of reasons, including overcoming bracket creep.

Note also that some “low-income” people may live in high-income households. However, our earlier analysis looking at households rather than individual earners also suggests that the Coalition’s tax proposal is marginally less progressive than the current system.

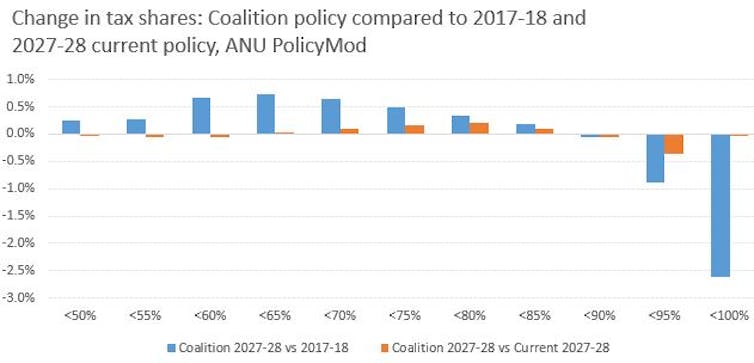
The chart below shows that the Coalition’s tax policy will have only a limited impact on the tax shares at different income levels by 2027-28. Perhaps a more relevant comparison is with the current tax shares for 2017-18, where a clearer pattern emerges of low- and middle-income earners paying a larger share of taxation.

The upshot is that the Coalition’s policy only partly overcomes bracket creep, with taxes still set to increase overall in the long term. The proposed policy does slightly more to overcome bracket creep for higher-income individuals. But it also locks in a higher tax share for those on low and middle incomes, and a lower share of the tax burden for higher earners.

On that basis, the proposals will lead to a slightly less progressive income tax regime than the one we currently have. But it will still be a long way short of a flat tax, and pretty much everyone looks set to be paying more income tax a decade from now.

Authors: Ben Phillips, Associate Professor, Centre for Social Research and Methods, Australian National University; Matthew Gray, Director, ANU Centre for Social Research and Methods, Australian National University

Will The Digital Economy Be Taxed?

From The Conversation.

The government is reportedly considering a new tax on the digital economy. While no details of the tax are available yet, the digital services tax recently proposed by the European Commission may give us an idea what the tax might look like.

In essence, the proposal will impose a 3% tax on the turnover of large digital economy companies in the European Union. Similar ideas have been suggested in the UK and France.

The current international tax system was designed before internet was invented, so this new tax is a response to this problem. Under the current system, a foreign company will not be subject to income tax in Australia unless it has a significant physical presence in the country. The key word here is “physical”.

It is well known that modern multinationals such as Google can derive substantial revenue and profits from Australia without significant physical presence here. It is no surprise that this 20th-century tax principle struggles to deal with the 21st-century economy.

This problem is well known but the solution is far more elusive.

Attempts to tax digital companies

The best solution in response to the rise of the digital economy is to reword the laws to take more into account than the “physical” presence of a company in the international tax regime. However, this reform would require international consensus on a new set of rules to allocate the taxing rights on the profits of multinationals among different countries.

In particular, it would mean more taxing rights for source countries where the revenue is generated. The formidable political resistance is not difficult to imagine.

The OECD has attempted to address this fundamental issue, but in vain so far. Its report on the taxation of digital economy in the Base Erosion Profit Shifting project did not provide any recommendation to improve the system at all. The recent report on its continuing work on the digital economy again shows little progress.

While the EU also recognises that the long-term solution should be a major reform of the international tax regime, the slow progress of the OECD’s effort is seriously testing the patience of many countries. Therefore, the EU has proposed the digital services tax as an “interim” measure.

Google as an example

The Senate enquiry into corporate tax avoidance revealed that Google is deriving billions of dollars of revenue every year from Australia but has been paying very little tax. In particular, the revenue reported to the Australian Securities and Investments Commission in Australia in 2015 was less than A$500 million, with net profits of A$47 million.

The government responded by introducing the Multinational Anti-Avoidance Law in 2016, targeting the particular tax structures used by multinational enterprises such as Google.

Google Australia’s 2016 annual report states that the company has restructured its business. Though not stated explicitly, the restructure was most likely undertaken in response to the introduction of this law.

As a result of the restructure, both revenue and net profits of Google Australia increased by 2.2 times.

However, here is the bad news. Though Google has reported significantly more profits in Australia, the profit margins of the local company remain very low compared to its worldwide group. For example, the net profit margin of Google Australia was 9% while that of the group was 22%.

Of course, a business may have different profit margins in different countries for genuine commercial reasons. However, based on our understanding of the tax structures of these multinationals, it’s likely that significant amounts of profits are booked in low-tax or even zero-tax jurisdictions.

This example suggests that while the Multinational Anti-Avoidance Law is achieving its objectives, it alone is unlikely to be enough.

A digital services tax in Australia

The digital services tax is a turnover tax, not an income tax. This circumvents the restrictions imposed by the current international income tax regime.

The targets of this tax include income of large multinationals from providing advertising space (for example, Google), trading platforms (for example, eBay) and the transmission of data collected about users (for example, Facebook).

If Australia follows the model of the digital services tax, the new tax may generate substantial amount of revenue. For example, Google Australia’s revenue reported in its 2016 annual report was A$1.1 billion. A 3% tax on that amount would be A$33 million.

Along with the digital services tax proposal, the EU proposed the concept of “significant digital presence” as the long-term solution for the international tax system. The exact details are subject to further consultation. However, the relevant factors may include a company’s annual revenue from digital services, the number of users of such services, and the number of online contracts concluded on the platform.

The destiny of this proposal is unclear, but it’s likely to be subject to fierce debate among countries. In any case, the proposals of the digital services tax and the digital presence concept suggest there may be a paradigm shift in the thinking of tax policymakers in response to the challenges imposed by the digital economy that would be difficult, if not impossible, to resist.

Author: Antony Ting, Associate Professor, University of Sydney

We still don’t have proof that cutting company taxes will boost jobs and wages

From The Conversation.

If you read these headlines you might think we finally have proof that cutting company taxes will boost employment and investment:

These stories are based on analysis of the 2015 company tax cut by consultants AlphaBeta. But the study, as well as some of the media coverage of it, show a worrying misunderstanding of how company tax cuts work.

Simply comparing companies that receive a tax cut with those that don’t isn’t the right methodology to conclude that the 2015 tax cuts created more employment or higher wages.

Cutting taxes lets companies keep more of their profits, allowing them to invest in new equipment and premises for example. The company then needs to hire more workers to work with these new assets. The newly created jobs require businesses to compete for workers and this increased demand pushes up wages across the entire economy.

Suppose a retail company gets a tax cut and opens a new store. It advertises for workers, many of whom are already employed by a rival store that didn’t get the tax cut. The first company will need to offer the workers higher wages to entice them away. The rival store will need to consider matching the wages in order to keep the workers.

In other words, even workers in companies that don’t receive the tax cut should see a wage rise.

Going through the AlphaBeta report

In 2015, the federal government cut the tax rate from 30% to 28.5% for businesses with less than A$2 million in revenue. Eligible businesses saved around A$2,940 on average because of the tax cut.

AlphaBeta used transaction data from 70,000 businesses to compare businesses just below the A$2 million threshold to companies that were just above it.

The analysis looked at the differences between the two groups of firms in terms of whether they hired new workers, invested in their businesses, increased worker wages, or kept some of the cash as a reserve.

AlphaBeta chalked any differences between companies that received the tax cut and those that didn’t to the company tax cuts.

As reported in The Australian, AlphaBeta found that companies that received the tax cut increased their employee headcount by 2.6%. The companies that didn’t receive the cut increased employment by just 2.1%.

This difference turned out to be “statistically significant”, meaning it is very unlikely to be the result of random chance.

As the Sydney Morning Herald pointed out, AlphaBeta also concluded that 51% of the tax cut was kept as cash, 27% went towards new investment, but only 3% was paid to workers in higher wages.

In other words, wages increased by just A$1.44 per week. This is not only a small amount, it was also found to be not statistically significant.

Problematic methodology

The main issue with this study’s methodology is actually noted by AlphaBeta in the report itself (and echoed in the coverage by the ABC and Sydney Morning Herald).

The problem is that we cannot draw any conclusions about the effect of company tax cuts on jobs or wages by studying a bunch of firms that received them and another bunch that did not, even if the firms are only slightly different.

This is because, as noted above, the effect of company tax cuts on jobs and wages take place in the entire labour market. An increase in demand for labour flows through to all business, and therefore, so do higher wages.

So we should not expect to see wages rising only in those businesses that receive the tax cuts. The finding that an increase in wages is small and insignificant is exactly what we would expect to see from this study.

Another problem is that we do not know whether the characteristics of the companies in AlphaBeta’s sample. Were some industries with particularly pronounced employment or wage increases over represented in one group but not the other, for instance?

Studying the effect of company tax cuts on employment and wages also requires a longer time period – sometimes years – and careful control of other factors affecting jobs and wages in some firms relative to others.

Blind review:

The analysis in this review is generally fair and reaches a sound conclusion regarding the AlphaBeta report. However, the logic behind company tax cut raising wages is somewhat simplified.

A cut in company tax lowers the costs of production and can flow to labour, capital (including equipment and buildings) and consumers. Economics tells us that who actually benefits from a tax cut depends on what is more responsive to the tax – labour, capital or output.

The lower production costs from a company tax cut can lead to greater output and lower prices as consumers buy more goods and services. This depends, of course, on how responsive consumers are to changes in price.

In the short-run labour is more mobile than capital, which is usually regarded as fixed. Therefore, in the short-run most of the benefit is borne by owners of capital (the companies) in the form of higher after-tax profits.

However, over the longer term, companies invest their after-tax profits in the business. So most of the benefit of the tax cut goes to workers though higher wages as the increased “capital stock” (such as equipment) makes labour more productive.

It follows that there is no reason to expect a significant increase in wages over a period of one or two years (as the AlphaBeta report covers). Indeed, such a result would be somewhat surprising. – Phil Lewis

Author: Ross Guest, Professor of Economics and National Senior Teaching Fellow, Griffith University

Reviewer: Phil Lewis, Professor of Economics, University of Canberra