Our Growing Tax Problem: What Abandoning Tax Reform Means For Taxpayers

From The Conversation.

As we move closer to Treasurer Scott Morrison’s third budget, what we do know is this – Australia has a revenue problem. A more global and digital economy; an ageing population with fewer taxpayers and sluggish wage growth make future predictions of revenue even more precarious. There’s never been a better time for tax reform.

But as governments have tried to reform (and stumbled) over the years the burden has shifted to individual taxpayers and the latest budget is likely to be no different.

We looked at revenue data over the last 20 years drawing from budget papers, government finance statistics and the Australian Tax Office. To compare revenue over time, we have adjusted for the effect of inflation by using real measures.

Tax revenues have risen 26% in Australia since the global financial crisis, from A$310.3 billion in 2009 to A$389.8 billion by 2016.

Income tax has contributed most to this growth and some is driven by rising wages and jobs growth. Between 2009-10 and 2016-17, individual income tax revenue grew by 37% – an average of 5% each year.

But bracket creep also comes into play as personal tax thresholds have not kept pace with inflation, causing average tax rates to rise among middle income earners in particular.

The growth in business tax revenue leading up to the global financial crisis was heroic – averaging 11% each year and well above any budget forecasts. In the ten years to 2007, business tax revenue grew by almost 130% – from A$41.4 billion to almost A$95 billion.

But what goes up must come down, and business tax fell by 6.3% between 2008 and 2016. However we can see strong growth between the last two periods, with business tax receipts growing by 10.7% from A$72.6 billion to A$80.3 billion.

Revenues from GST and sales taxes have risen, by 16% since 2009.

The relationship between Australia’s economic output and its tax revenue looks somewhat different. The tax-to-GDP ratio reached nearly 25% prior to the global financial crisis, but dropped to 20.5% in 2010-11. It recovered to around 22% by 2012 and has remained essentially flat since then.

A history of reform attempts

Successive governments have attempted to create an efficient tax system that’s fair and reliable with few distortions. Prior to the turn of the century the Howard government argued the tax system was out of date, complex and inequitable, heavily reliant on individual and company tax, and prevented Australia competing on a global level.

The Howard government’s new tax system in 2001 was an answer to this. This new tax system seemed to have all the reform solutions needed – income tax cuts for hard working Australians and at long last the introduction of a goods and services tax, along with some pretty big welfare reforms.

Everything appeared to be going quite well with the new tax system – revenue from company tax was way, way above any Treasury official’s forecast.

But fast-forward 10 years and cracks began to show, prompting a new review into the effectiveness of Australia’s tax system. The Henry Review, provided some 138 recommendations for tax reform, yet very few saw the light of day. And just five years later, another review was conducted with then Treasurer Joe Hockey at the helm, which since seems to have been not so much parked as abandoned.

Income taxes from individuals have always made up the greatest share of tax revenue in Australia. Prior to the introduction of the Howard government’s tax system, income tax from individuals made up 57.3% of the total tax pool – it now accounts for 51.0% of total tax revenue.

The Howard reforms included a reduction in personal income tax rates. During the next ten years Australian businesses shouldered a greater share of the tax burden, with their share rising from 17.9% in 2000-01 to 27.4% in 2007-08 at the peak of the resource boom. This has since fallen to 20.6%.

The contribution of taxes on goods and services has remained fairly steady since moving from sales tax to the GST in 2001. GST revenue is consistently around 16% of all tax revenue.

The share of tax revenue from customs duties, excises and levies has been falling since 2001, from 14.5% to 9.5%. Other tax revenue has been fairly consistent over time, contributing less than 2% of total tax revenue. However, in 2012-13 this increased to around 4%, with the introduction of the short-lived carbon pricing mechanism.

The problem with predicting future revenue

Taxation revenues were consistently underestimated prior to the global financial crisis, but have fallen below expectations since its end. The tax-to-GDP ratio has been anchored close to 22% since 2012-13. This is despite eight successive federal budgets since May 2010 projecting future tax revenues in excess of 24% of GDP.

And where does the greatest divergence lie between forecast revenues and out turns?

Company tax revenues are consistently – and by some margin – the most difficult to predict. Receipts fell short of forecast estimates of around 5% of GDP, by around one percentage point over four years, since the May 2010 budget.

Estimates of company tax receipts for 2017-18 were revised upwards by A$4.4 billion in the latest MYEFO update in December 2017. Should this eventuate, it will take total company tax revenues for 2017-18 to A$83.8 billion (around 4.6% of GDP).

The government may well feel that this creates space for a company tax cut and personal income tax cuts in the upcoming budget.

Revenue from individual income tax has been projected to rise to around 12.5% of GDP over the forward estimates, in each budget, since May 2013. Revenue has risen from 9.5% of GDP in 2009 to 11.4% by 2016 before dropping marginally by 0.2 percentage points in the latest Mid-Year Economic and Fiscal Outlook (MYEFO) forecasts.

But wages have not played the leading role that they have been cast in, in every budget going back to May 2011. Since this time wage growth has been forecast at an elusive 3% mark or thereabouts, yet has fallen well short of this each year and currently stand at 2.1%.

Tax thresholds remained fixed between the 2012 and 2016 budgets, and the only change since has been to lift the 32.5% tax threshold from $80,000 to $87,000, effective 1 July 2016. Tax revenue growth up to now has certainly been driven by the effects of bracket creep.


Unless tax thresholds in the future are increased at least in line with inflation, this means that average taxes will continue to rise.

Plans for a 0.5% increase in the Medicare Levy rate from July 2019 have been shelved, which would have raised around A$8.2 billion over the next four years to support the National Disability Insurance Scheme.

Expectations have been raised for tax cuts to businesses as the government advocates for the “trickle-down” benefits to Australian households.

It’s hard to see how this will lead to anything other than a shift in the tax burden towards individual taxpayers – at least in the short term. This is unless company tax cuts are balanced with substantial, not modest, cuts to personal income taxes as well.

It seems Scott Morrison will be banking ever more on a strengthening economy to support Australia’s taxation revenues into the future.

Author: Rebecca Cassells, Associate Professor, Bankwest Curtin Economics Centre, Curtin University; Alan Duncan, Director, Bankwest Curtin Economics Centre and Bankwest Research Chair in Economic Policy, Curtin University

How the government can pay for its proposed company tax cuts

From The Conversation.

There are ways the government can pay for a cut in the company tax rate. In a recent working paper, we worked with researcher Chris Murphy to model three different options: reforming Australia’s system of giving shareholders tax credits, allowing less tax deductions on interest for companies, and introducing a tax on the super-profits of banks and miners.

After taking economic growth into account, the budget cost of the tax cut could be net A$5 billion a year.

In the US, a company tax cut to 21% continues an inexorable global trend of cutting rates, making international tax competition even more pressing. As our working paper noted, Australia’s rate is now higher than most other countries, making tax avoidance even more attractive and deterring inbound foreign investment.

A cut in the Australian company tax rate to 25 or even 20% is important because it will attract foreign investment, boosting wages and the economy in Australia.

Remove dividend imputation

Australia has an unusual system of integrated company and personal tax, called dividend imputation. It has been in place since the 1980s.

Australian shareholders receive franking (imputation) credits for company tax. If shareholders are on a personal tax rate less than 30%, they receive a refund.

The company tax cut could be financed by removing dividend imputation. Our modelling indicates a company tax rate of 20% would mean the government breaks even, while halving imputation could finance a 25% rate.

It would be simpler to abolish dividend imputation and replace it with a discount for dividend tax, at the personal level.

Dividend imputation only makes sense if we assume Australia is a closed economy with no foreign investors. In reality, Australia depends on inflows of foreign investment. About one-third of the corporate sector is foreign owned.

The likely source of additional finance, especially for large Australian businesses, is a foreigner who does not benefit from dividend imputation. So the company tax pushes up the cost of capital and domestic investors benefit from franking credits for a tax they don’t actually bear.

But the politics of making a change to the system are difficult, because domestic investors, especially retirees on low incomes and superannuation funds would lose out. But this approach could benefit workers, jobs and Australian businesses.

Broaden company tax by removing interest deductibility for companies

Another approach is to remove or limit deductibility of interest for companies. This can raise the same revenue at a lower rate, by allowing less deductions. Excessive interest deductions are used by multinationals to reduce their Australian tax bill, as shown in the recent Chevron case.

This would be like imposing a withholding tax on interest paid offshore. We explore a comprehensive business income tax on all corporate income. Modelling shows that this tax would finance the rate cut to 25%.

The comprehensive business income tax raises some difficult issues for taxing banks. This is because their profit is interest income less interest expense.

But there are numerous policies to restrict interest deductions already in place, here and around the world. These restrictions could be expanded. For example the thin capitalisation rules limit of the amount of loans a business can have relative to equity.

We still need anti-abuse rules because businesses can use other methods to minimise tax, as canvassed by the OECD in its Base Erosion and Profit Shifting project, including transfer pricing, and deductible payments offshore for intellectual property fees.

A rent tax or allowance for equity

A third option for a company tax cut is to change to a tax with a lower effective marginal rate. This means that the return on a new investment is taxed less heavily than under a company income tax.

We could introduce an allowance for corporate equity, or corporate capital, which provides a deduction for the “normal” or risk-free return for capital investment. This is also called an economic rent tax because it only taxes the above-normal profit.

Modelling shows that the allowance for corporate capital encourages new investment, which helps economic growth, but there is a large budget cost. The extra deduction reduces the overall tax take and so a higher rate is needed for the same revenue.

It is unlikely Australia would want to maintain or increase our company tax rate, as this directly contrary to the global trend and can lead to even more tax planning by businesses.

For Australia, a supplementary rent tax aimed at the financial and mining sectors – where above-normal returns are known to occur – could be combined with a lower company income tax. Modelling this option for the finance sector shows a large welfare gain and sufficient revenue to fund the rate cut to 25%.

The government has a lot of choices

We show that the government has many options available to finance the needed corporate rate cut and improve efficiency of the company tax.

Policymakers could mix and match these options. Dividend imputation could be replaced with a discount and combined with a comprehensive business income tax. Limits on interest deductibility could be combined with a part allowance for corporate capital.

Replacing dividend imputation with a dividend discount at the personal level could be the best initial step. Other options for major reform of Australia’s company tax need to remain on the table, as company taxes drop to a new low and systems are reformed around the world.

David Ingles, Senior Research Fellow, Tax and Transfer Policy Institute, Crawford School of Public Policy, Australian National University; Miranda Stewart, Professor and Director, Tax and Transfer Policy Institute, Crawford School of Public Policy, Australian National University

Will Corporate Tax Cuts Boost Wages?

From The Conversation.

The argument that cutting the Australian company tax rate will lead to higher investment and wages, more employment and faster GDP growth does not have solid empirical or theoretical backing.

A close look at the economic research in this area shows a lack of consensus. Different studies, looking at different samples of countries, over different periods of time, reach different conclusions.

And the predictions made by theoretical models are sensitive to the underlying assumptions and structures built into the models themselves.

Many of the issues surrounding tax cuts remain unsettled – such as the size or length of the impact, how it affects inequality and the relationship with other government policies.

The recent International Monetary Fund (IMF) forecast for the American economy highlights some of the issues.

In short, the IMF acknowledges that the recent US tax cuts will have a positive impact on economic growth in 2018-19. However, this is conditional on the US government not cutting expenditure, is likely to be short-lived, and will come at the cost of increased government deficits.

In this light, corporate tax cuts seem to be a long-term pain for a short-term gain, which is probably not what we need in Australia.

Conflicting information

Let’s start with the point that is probably least controversial – that a reduction in the corporate tax rate will lead to an increase in wages.

Think of the output produced by a corporation as a pie. This pie is shared among shareholders (in the form of dividends), banks and other lenders (in the form of interest paid on loans), workers (in the form of wages) and the government (in the form of taxes).

If we reduce the government’s share then there is more for everybody else, including workers. And some data do suggest that wages increase when corporate tax rates decline.

Yet economists disagree on the extent to which wages would actually increase in response to a tax cut.

Some research suggests that this increase might be small, even in a country like Germany, which is often used as an example of the beneficial impact of tax cuts on wages.

Certain aspects of the German economy and industrial relations system make it more likely that German workers will benefit from corporate tax cuts compared to Australian workers.

In Germany, workers’ representatives sit on company supervisory boards, which monitor and appoint members of management boards.

This means German workers have a stronger say when it comes to sharing the pie. For any given decrease in the slice of the government, German workers are more likely to get a bigger slice for themselves. This is not necessarily the case in Australia.

It is therefore difficult to draw implications for Australia from studies that look at the experience of Germany or other countries with significantly different institutional arrangements.

Furthermore, the fact that wages should increase in response to a corporate tax cut does not automatically imply that other economic variables will also respond positively. For instance, the more wages increase in response to a corporate tax cut, the smaller the increase in employment is likely to be.

This leads to an even more controversial question: what is the effect of corporate tax cuts on real economic activity, such as employment and GDP growth?

The trickle-down effect of corporate tax cuts rests on the idea that business investment would increase once taxes are cut, which in turn leads to the creation of more jobs and faster economic growth.

However, this line of reasoning neglects the fact that investment decisions in today’s globalised world are not necessarily driven by the corporate tax rate.

Many other factors come into corporate investment decisions, such as the quality of institutions, the proximity to important markets, and the cost of labour (wages).

Because of these other factors, the impacts of tax cuts on employment and growth can be small, short-lived, or conditional on other government policy actions, such as managing debt.

In a similar vein, recent theoretical work that incorporates more realistic assumptions about the economy (such as the distribution of entrepreneurial skills in the population) suggests that a tax cut only has a significant impact on economic growth when the tax rate is initially high.

This means that even within a given country, the effect of a corporate tax cut can change depending on initial economic and policy conditions.

Putting tax cuts in a broader context

Beyond growth and employment, the effects of corporate tax cuts should also be considered in terms of deficit and inequality.

From the point of view of the public budget, a cut in the tax rate has to be somehow financed. How?

A first possibility is that the tax cut pays for itself. This is essentially the idea that as the tax rate goes down, the increase in the tax base (e.g. pre-tax corporate profit) is sufficiently large to ensure that the total tax revenue increases.

However, an increase in the tax base would require a significant and sustained increase in business investment, which, as we have already seen, does not necessarily happen.

The government could increase other taxes, but this means the government would effectively be taking from one group of taxpayers (possibly workers themselves) to give to corporations.

Another option is to reduce some government expenditures. But this could also involve taking from one group to give to another. If the decision is made to cut social welfare and public goods like education and health, then more vulnerable segments of the population will bear the cost of lowering the corporate tax rate. This means more inequality in the economy.

Of course the government could decide to just let the deficit be. This would result in higher debt. But can Prime Minister Turnbull (or President Trump for that matter) accept that?

The central economic challenge for Australia is to promote long-term, inclusive growth. Are we confident that this is what corporate tax cuts will deliver? Based on the economic research that I have read, the answer is no.

Author: Fabrizio Carmignani, Professor, Griffith Business School, Griffith University

Why Stamp Duty Bills are Snowballing – HIA

The HIA says that stamp duty bills have increased almost three times faster than house prices since the 1980s and this trend will continue unless stamp duty is reformed. This result is contained in the latest edition of the HIA’s Stamp Duty Watch report which provides an analysis of state governments increasing reliance housing taxes.

The results also highlight just how much high property prices are helping to stoke state coffers – $20.6 billion in 2016- and the risks attached should this change! A switch to a broader property or land tax might be an option, but is politically risky. This would need to be part of broader property sector reform.

HIA Senior Economist, Shane Garrett says

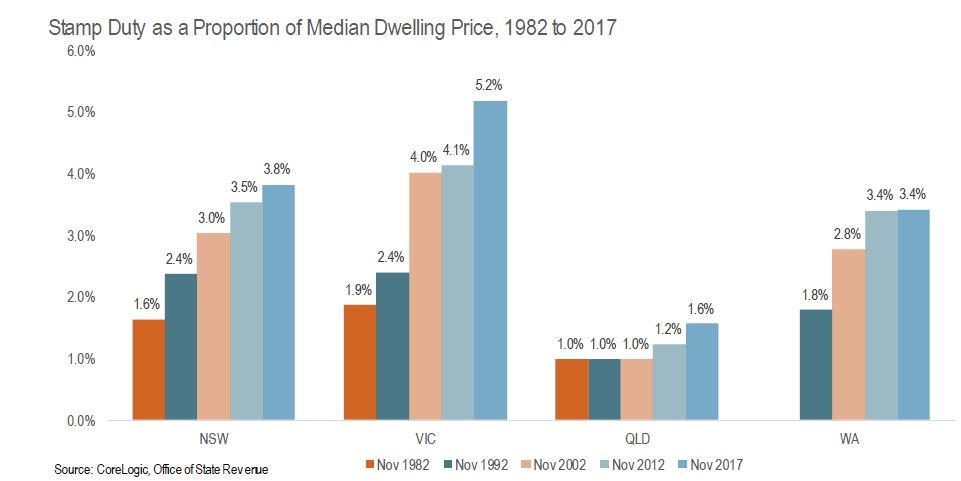
In Victoria, the typical stamp duty bill increased from 1.9 per cent to 5.2 per cent of the median dwelling price between 1982 and 2017 – equivalent to a surge of 4,000 per cent in the cash value of stamp duty. NSW homebuyers fared little better with the stamp duty burden rising from 1.6 per cent to 3.8 per cent over the same period.

Increases in home prices cause stamp duty bills to accelerate because stamp duty rate brackets are rarely updated. This is the problem of stamp duty creep.

In NSW, stamp duty rates have not been reformed since the average house price was $70,000 (1985).

State governments are compounding the housing affordability crisis. Total stamp duty revenues have almost doubled over the past four years: from $11.7 billion in 2011/12 to $20.6 billion in 2015/16 – most of which is likely to have come from residential building. State governments are now more reliant on stamp duty revenues than at any time for a decade. This trend will continue unless state governments recalibrate their taxes on housing.

State governments are increasingly reliant on rising stamp duty revenues. This situation is not sustainable.

The stamp duty burden is increasing under every metric: nominal dollars, real dollars, as a proportion of dwelling prices and as a share of total state revenue. Without reform, this trend will continue.

By draining the pockets of homebuyers to the tune of over $20 billion each year, stamp duty is a central pillar of the affordability crisis. A long plan to do away with the scourge of stamp duty would be a huge victory for housing affordability in this country.

Removal of Negative Gearing Would LIFT Home Ownership

More evidence that negative gearing should be revised was contained in a preliminary paper released recently, having been discussed with the RBA in November. Melbourne University researchers Yunho Cho, Shuyun May Li, and Lawrence Uren suggest their modelling shows that the removal of negative gearing would potentially lift homeownership rates by 5.5%, and that “renters and owner-occupiers are winners, but landlords, especially young with high earning landlords, lose”. They stress this is preliminary, but nevertheless it adds to the weight of evidence that negative gearing should be reformed. Their data also again shows how a small number of affluent landlords are benefiting disproportionately at the expense of the tax payer .

The welfare analysis suggests that eliminating negative gearing would lead to an overall welfare gain of 1.5 percent for the Australian economy in which 76 percent of households become better off.

This is significant, given the annual government expenditure
on negative gearing is estimated to be $2 billion, or 5 percent of the budget deficit for the year 2016. Eliminating negative gearing would reduce housing investments and house prices, and increase the average home ownership rate. The supply of rental properties falls, rents increase but only marginally because its demand also falls.

The data in their report also underlines the significant growth in property investors, and the consequential rise in mortgage lending and negative gearing.

The left panel in Figure 1 shows that the proportion of landlords has risen by around 50 percent over the last two decades. The right panel in Figure 1 shows that the real housing loan approvals have also increased dramatically during the same period. In particular, the loan approvals for investment purposes increased more sharply than that for owner-occupied purposes, surpassing it by around $0.5 billion in the early 2010s.

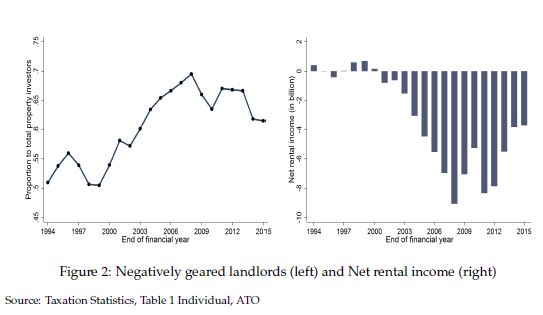
Figure 2 documents the proportion negatively geared landlords and the aggregate net rental income across the period from 1994 to 2015. The left panel in Figure 2 shows that the proportion of negatively geared landlords has increased from 50 percent in 1994 to around 60 percent in 2015. The right panel in Figure 2 shows that the aggregate net rental income became large negative from the early 2000s onwards. Evidence shown in Figures 1 and 2 suggest that Australian households increasingly participate in the residential property investment and take advantage of negative gearing, reducing tax obligations with the flow loss incurred from their housing investment.

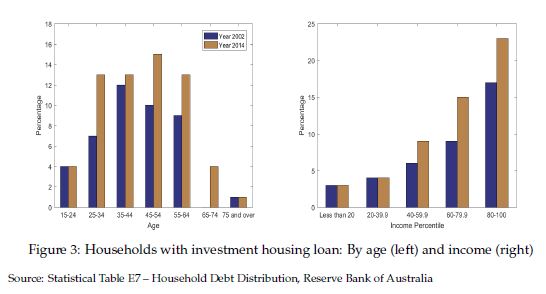
Figure 3 compares the share of households with home loans for investment by age (left panel) and income percentile (right panel) for the years 2002 and 2014. There has been a significant increase in the share, particularly among young to middle-aged households.

The largest increase was occurred in the age group 25 – 35, increased by 85 percent from 7 percent to 13 percent. From the right panel, we find that the share of households with investment housing loans has increased mainly among those in upper income percentiles.

These evidence are in line with the arguments by opponents of negative gearing that the policy essentially benefits the rich households who borrow and speculate in the property market. The fact that the distribution of housing investment loans is different across age and income also motivates our use of a heterogeneous agents incomplete markets model to study the implications of negative gearing.

This is consistent with our own surveys and analysis on negative gearing. Good data and analytics can negate political rhetoric, even it takes time…!

Finally, of course is the important point, should interest rates rise then the value of negative gearing claimed will rise, putting a heavier burden on the Treasury, at a time when the cost of Government borrowing would be also rising. A double whammy – a multiplier effect.

Treasury memo misses the real impact of Labor’s negative gearing policy

From The Conversation.

Labor MPs might be rubbing their hands together with glee at a Treasury memo that shows the federal opposition’s negative gearing policy will have a “small” impact on the property market. But insights from behavioural public policy, as highlighted by the 2017 Economics Nobel laureate – Richard Thaler and his colleague Cass Sunstein, tell us that how people respond to this policy will be more about how the government frames it.

The Treasury memo showed the Labor policy of limiting negative gearing to existing homeowners will have a limited impact as the changes are unlikely to encourage investors to sell quickly. Also, owner-occupiers dominate the housing market and the costs of selling are high.

However, this assumes that people are forward-looking, well-informed, good with numbers and perfectly responsive to new information. Behavioural economics shows us that people do not always think so deeply and logically about their choices.

How any changes to negative gearing are sold to us – as a loss or gain, as a one-off or ongoing, in terms of short versus long term costs and benefits – will impact how Australians react.

Most of us aren’t whizzes with mathematics. As Nobel prize winner Herbert Simon has shown, in place of complex mathematical algorithms we use heuristics. These are simple rules of thumb that draw on our intuitions, experience and gut feel.

Heuristics and biases

One common example of a heuristic is the availability heuristic. This is when we make decisions based on easily available information such as recent events and highly emotive experiences. Our brains work better with narratives and stories than with facts and figures.

Nobel economics laureates George Akerlof and Robert Shiller have applied a similar insight to analyse people’s perceptions of housing market fluctuations. They noted that we hear lots of stories about how house prices are on an upward trend. Via the availability heuristic, we easily remember these emotionally engaging stories, much better than we can remember the dry facts about the history of house price instability and housing market crashes.

This leads us to overestimate the chances of continuing house price rises, and to underestimate the chances of a fall, driving unsustainable house price increases – as witnessed, for example, in the American sub-prime property markets before the global financial crisis.

While heuristics can help us to decide quickly, they sometimes lead us into systematic mistakes – “behavioural biases”. This does not mean that we’re all hopelessly irrational. But for negative gearing it matters how a potential change is framed, and how that fits into our heuristics and biases.

Most economists (including those at Treasury) assume that one dollar is a perfect substitute for any other dollar. Whether we save A$100 via a tax break, win A$100 from a scratch card or earn A$100 from working overtime, it makes no difference.

Contrary to this view, behavioural economics has shown that the way we treat money is different depending on the contexts in which we earn and spend it. We have different “mental accounts” for consumption, wealth, regular income and windfalls. We are more likely to splurge money we’ve won from a scratch card than money we’ve earnt doing overtime.

This is another reason why framing is important. How the government frames a negative gearing change will determine the mental account to which we assign it, and therefore how we respond.

If negative gearing changes are considered a one-off hit – the opposite of a scratch card windfall – then property owners won’t worry so much. On the other hand, if the change to negative gearing is seen as an ongoing drain on our incomes, then they will worry a lot.

Another factor that will come into play is loss aversion – people are much more likely to worry about losses than gains. Evidence from behavioural experiments shows that home-owners over-estimate the value of their properties. This makes them reluctant to sell at reduced prices in a falling market.

It also means that Australians will resist negative gearing changes if these are framed as a loss, creating political pressures for a policy u-turn. It is difficult to predict how people might respond, but behavioural economics shows that any ructions might be avoided if the negative gearing change is framed as a gain.

For instance, Treasury predicts that the additional revenue raised from restricting negative gearing could be up to A$3.9 billion. Therefore, the negative gearing changes could cover more than 80% of federal government expenditure on veterans and their families.

In the long and short term

Treasury’s modelling notes there might be downward pressure on house prices in the short term from changing negative gearing, but that this will be small overall.

But a range of models and experiments have shown that people are disproportionately focused on tangible, short-term outcomes. For example, most of us find it hard to persuade ourselves to go the gym: the short-term costs are inconvenience and discomfort and the benefits seem intangible and distant. This is called “present bias”.

Recent work in behavioural economics confirms that framing (alongside a range of other socio-psychological influences) has a strong impact on our choices. Framing will determine how we perceive the policy, which mental account we will use to process it and how the various heuristics and biases identified by economics and psychologists will play out.

In the debates around negative gearing policy changes, these behavioural insights have not been highlighted. So perhaps Treasury could have added some psychology, alongside the economics, in arguing that house price falls are likely to be limited.

Author: Research Professor at the Institute for Choice, University of South Australia

Australians in for a Boon With New Super Changes in 2018

NAB says that Australians who are looking to buy their first home or are preparing for retirement could be in for a windfall in 2018, with a number of key superannuation changes expected to come into effect.

NAB Director of SMSF and Customer Behaviour, Gemma Dale said a number of key super reforms are expected to come into effect this year, so it’s important consumers stay on top of these change to ensure they capitalise on the opportunities.

“One of the big changes this year is the Downsizer contribution, which allows individuals aged 65 years plus to make non-concessional contributions of up to $300,000 per person to their super from the proceeds of selling their main residences,” Ms Dale said.

“But it is important to note that these contributions only apply to contracts of sale entered into from 1 July 2018, and the property also needs to be owned for at least 10 years before disposal.’’

Another key change is the first home super saver scheme.

“This scheme will allow eligible individuals who make voluntary super contributions from 1 July 2017 to withdraw these contributions, together with associated earnings for the purpose of purchasing their first home,” Ms Dale said.

“These voluntary contributions will be limited to $15,000 per year, up to a total of $30,000, and count towards the relevant contribution cap.

“Eligible individuals will be able to have up to 100 per cent of non-concessional and 85 per cent of concessional contributions plus associated earnings withdrawn from super to purchase their first home from 1 July.

“However, it is important to note, that the legislation for this scheme is yet to be passed, so there is a risk any voluntary contributions made in anticipation of it could be locked into individuals’ super.”

From 1 July, individuals with super balances of less than $500,000 on 30 June of the prior financial year will be able to access a higher annual cap and contribute their remaining unused concessional contribution cap on a rolling basis for a period of five years. But only unused amounts accrued from 1 July 2018 can be carried forward.

“This measure will enable customers who take time out of work or work part-time to make catch-up contributions when they accumulate lumpy income or decide to work full-time,’’ Ms Dale said.

Ms Dale encouraged Australians to seek advice before making any decisions to ensure it is in their best interest.

Some key super changes expected to come into effect from 1 July 2018

  • First home super saver scheme – This scheme allows eligible individuals who make voluntary super contributions on or after 1 July 2017 to withdraw these contributions, together with associated earnings for the purpose of purchasing their first home. These voluntary contributions are limited to $15,000 per year, up to a total of $30,000 and count towards the relevant contribution cap.
  • Downsizer contributions – The Government introduced a Bill in September 2017 allowing individuals aged 65 years or over to make non-concessional contributions of up to $300,000 (per person) to their superannuation from proceeds of selling their main residences
  • Catch-up contribution concessions – Individuals with super balances less than $500,000 on 30 June of the prior financial year will be able to access a higher annual cap and contribute their remaining unused concessional contribution cap on a rolling basis for a period of five years. Only unused amounts accrued from 1 July 2018 can be carried forward.

GOP tax plan doubles down on policies that are crushing the middle class

From The Conversation.

The U.S. middle class has always had a special mystique.

It is the heart of the American dream. A decent income and home, doing better than one’s parents, and retiring in comfort are all hallmarks of a middle-class lifestyle.

Contrary to what some may think, however, the U.S. has not always had a large middle class. Only after World War II was being middle class the national norm. Then, starting in the 1980s, it began to decline.

President Donald Trump has portrayed the tax plan Congress is wrapping up as a boon for the middle class. The sad reality, however, is that it is more likely to be its final death knell.

To understand why, you need look no further than the history of the rise and decline of the American middle class, a group that I’ve been studying through the lens of inequality for decades.

The middle class rises

The middle class, which Pew defines as two-thirds to two times the national median income for a given household size, began to grow after World War II due to a surge in economic growth and because President Franklin Delano Roosevelt’s New Deal gave workers more power. Before that, most Americans were poor or nearly so.

For example, legislation such as the Wagner Act established rights for workers, most critically for collective bargaining. The government also began new programs, such as Social Security and unemployment insurance, that helped older Americans avoid dying in poverty and supported families with children through tough times. The Home Owners’ Loan Corporation, set up in 1933, helped middle-class homeowners pay their mortgages and remain in their homes.

Together, these new policies helped fuel a strong postwar economic boom and ensured the gains were shared by a broad cross-section of society. This greatly expanded the U.S. middle class, which reached a peak of nearly 60 percent of the population in the late ‘70s. Americans’ increased optimism about their economic future prompted businesses to invest more, creating a virtuous cycle of growth.

Government spending programs were paid for largely with individual income tax rates of 70 percent (and more) on wealthy individuals and high taxes on corporate profits. Companies paid more than one-quarter of all federal government tax revenues in the 1950s (when the top corporate tax was 52 percent). Today they contribute just 5 percent of government tax revenues.

Despite high taxes on the rich and on corporations, median family income (after accounting for inflation) more than doubled in the three decades after World War II, rising from $27,255 in 1945 to nearly $60,000 in the late 1970s.

The fall begins

That’s when things started to change.

Rather than supporting workers – and balancing the interests of large corporations and the interests of average Americans – the federal government began taking the side of business over workers by lowering taxes on corporations and the rich, reducing regulations and allowing firms to grow through mergers and acquisitions.

Since the late 1980s, median household incomes (different from family incomes because members of a household live together but do not need to be related to each other) have increased very little – from $54,000 to $59,039 in 2016 – while inequality has risen sharply. As a result, the size of the middle class has shrunk significantly to 50 percent from nearly 60 percent.

One important reason for this is that starting in the 1980s the role of government changed. A key event in this process was when President Ronald Reagan fired striking air-traffic control workers. It marked the beginning of a war against unions.

The share of the labor force that is organized has fallen from 35 percent in the mid-1950s to 10.7 percent today, with the largest drop taking place in the 1980s. It is not a coincidence that the share of income going to earners in the middle fell at the same time.

In addition, Reagan cut taxes multiple times during his time in office, which led to less spending to support and sustain the poor and middle class, while deregulation allowed businesses to cut their wage costs at the expense of workers. This change is one reason workers have received only a small fraction of their greater productivity in the form of higher wages since the 1980s.

Meanwhile, the real buying power of the minimum wage has been allowed to erode since the 1980s due to inflation.

While the middle class got squeezed, the very rich have done very well. They have received nearly all income gains since the 1980s.

In contrast, household median income in 2016 was only slightly above its level just before the Great Repression began in 2008. But according to new unpublished research I conducted with Monmouth University economist Robert Scott, the actual living standard for the median household fell as much as 7 percent due to greater interest payments on past debt and the fact that households are larger, so the same income does not go as far.

As a result, the middle class is actually closer to 45 percent of U.S. households. This is in stark contrast to other developed countries such as France and Norway, where the middle class approaches nearly 70 percent of households and has held steady over several decades.

The Republican tax plan

So how will the tax plan change the picture?

France, Norway and other European countries have maintained policies, such as progressive taxes and generous government spending programs, that help the middle class. The Republican tax package doubles down on the policies that have caused its decline in the U.S.

Specifically, the plan will significantly reduce taxes on the wealthy and large companies, which will have to be paid for with large spending cuts in everything from children’s health and education to unemployment insurance and Social Security. Tax cuts will require the government to borrow more money, which will push up interest rates and require middle-income households to pay more in interest on their credit cards or to buy a car or home.

The benefits of the Republican tax bill go primarily to the very wealthy, who will get 83 percent of the gains by 2027, according to the Tax Policy Center, a nonpartisan think tank.

Meanwhile, more than half of poor and middle-income households will see their taxes rise over the next 10 years; the rest will receive only a small fraction of the total tax benefits.

Trump touts the GOP tax plan with a group of ‘middle-class families.’ Reuters/Kevin Lamarque

From virtuous to vicious

While Republicans justify their tax plan by claiming corporations will invest more and hire more workers, thereby raising wages, companies have already indicated that they will mainly use their savings to buy back stock and pay more dividends, benefiting the wealthy owners of corporate stock.

So with most of the gains of the $1.5 trillion in net tax cuts going to the rich, the end result, in my view, is that most Americans will face falling living standards as government spending goes down, borrowing costs go up, and their tax bill rises.

This will lead to less economic growth and a declining middle class. And unlike the virtuous circle the U.S. experienced in the ‘50s and ’60s, Americans can expect a vicious cycle of decline instead.

Author: Steven Pressman, Professor of Economics, Colorado State University

US Tax Plan Will Be Revenue Negative, Result in Higher Deficits

United States: Outlook for Public Finances Worsens says Fitch Ratings who expects a version of the tax cuts presented in the Tax Cuts and Jobs Act to pass the US Congress.

Such reform would deliver a modest and temporary spur to growth, already reflected in growth forecasts of 2.5% for 2018. However, it will lead to wider fiscal deficits and add significantly to US government debt. As such, Fitch has revised up its medium-term debt forecast.

US federal debt was 77% of GDP for this fiscal year. Fitch believes the tax package will be revenue negative, even under generous assumptions about its growth impact. Under a realistic scenario of tax cuts and macro conditions, the federal deficit will reach 4% of GDP by next year, and the US debt/GDP ratio would rise to 120% of GDP by 2027.

The Republican tax plan delivers a tax cut on corporations, seeking to lower the corporate tax rate to 20% from 35%, and removing many exemptions, while eliminating some tax breaks affecting corporate and personal filers. It would leave the overall personal tax burden somewhat lower, although the effects would differ depending on circumstances.

Tax cuts may lead to a short-lived boost to output, but Fitch believes that they will not pay for themselves or lead to a permanently higher growth rate. The cost of capital is already low and corporate profits are elevated. In addition, the effective tax rate paid by large corporations is well below the existing statutory rate. From a macroeconomic perspective, adding to demand at this point in the economic cycle could add to inflationary pressures and lead to additional monetary policy tightening.

Fitch expects US economic growth to peak at 2.5% in 2018 before falling back to 2.2% in 2019. The US will enter the next downturn with a general government “structural deficit” (subtracting the impact of the economic cycle) larger than any other ‘AAA’ sovereign, leaving the US more exposed to a downturn than other similarly rated sovereigns.

The US is the most indebted ‘AAA’ country and it is running the loosest fiscal stance. Long-term debt dynamics are also more negative than those of peers, with health and social security spending commitments set to rise over the next decade. In Fitch’s view, these weaknesses are outweighed by financing flexibility and the US dollar’s reserve currency status, underpinning its ‘AAA’/Stable rating. The main short-term risk to the rating would be a failure to raise the debt ceiling by 1Q18, when the Treasury’s scope for extraordinary measures is expected to be exhausted. The debt ceiling is currently suspended until early December.

US Corporate Tax Reform: Implications for the Rest of the World

The Treasure has released a paper “US Corporate Tax Reform: Implications for the rest of the world” which examines the likely impacts of the US reforms on the US and on the rest of the world, placing the US changes in the context of the global trend toward lower corporate taxes.

The paper says that the economic impact of the Republicans’ tax plan will depend on how time and compromise shape the package that is ultimately legislated. Key in this regard is the size of the cut, how it is funded and whether investors believe it is a permanent reduction.

On 27 September 2017, the United States (US) Administration and Republican Congressional leadership released a framework for US tax reform, including a reduction in the federal corporate tax rate from 35 to 20 per cent.

The key elements of tax framework with respect to corporate tax are:

  • a reduction in the federal corporate income tax rate from 35 to 20 per cent;
  • immediate expensing of depreciable assets (except structures) for at least 5 years;
  • limitations on interest deductions;
  • the removal of the domestic production deduction;
  • an exemption for dividends paid by foreign subsidies to US companies (where the US company owns 10 per cent or more of the foreign company); and
  • a one-time tax on overseas profits.

These proposals were reflected in the draft of the Tax Cuts and Jobs Act released by the House Ways and Means Committee on 2 November 2017.

This paper examines the likely impact of this reform on the US and rest of the world, placing the US changes in the context of the global trend toward lower corporate taxes.

In theory, a corporate tax rate cut stimulates investment by making more investment opportunities sufficiently profitable to attract financing. The extent to which this is the case in practice will depend on how the tax cut is funded and whether investors consider the tax cut to be permanent. If the corporate tax rate cut results in an overall reduction in tax on US investments and investors believe that the tax cut is permanent, we are likely to see an increase in the level of US investment. If investors believe that the tax cut is temporary, the effect on US investment may be minimal. Ultimately, the economic impact of the plan on the US will depend on how time and compromise shape the final package.

If a US corporate tax cut does result in an investment boom, goods, labour and funds will be required. In a scenario in which the investment boom is largely funded domestically from US savings, negative impacts on the rest of the world are likely to be short-lived and modest.

Realistically, however, a US investment boom is likely to be only partially funded domestically and would draw funds and goods from the rest of the world. In this scenario, the rest of the world would experience a decline in capital stock resulting from the flow of capital into the US. The magnitude of the resulting welfare loss in those countries will depend on the size of the US corporate tax cut; how it is funded; the elasticity of the US labour supply response and the US saving response. For Australia, the size of the negative impact will also depend on how other countries respond.

While the size of the US economy means changes to the US tax system have particular significance, it is important to consider these reforms as part of an ongoing trend. As capital markets have become increasingly global and business location increasingly mobile, governments have sought to drive economic growth in their jurisdictions by lowering corporate tax rates. The US reforms have the potential to accelerate tax competition between jurisdictions, making Australia’s current corporate tax rate increasingly uncompetitive internationally.

While the Administration and Republican Congressional leadership have indicated that they will ‘set aside’ the idea contained in the House Republicans’ 2016 plan to move to a destination-based cash flow tax (DBCFT), this paper also provides a discussion of the theoretical underpinnings of the proposal.