
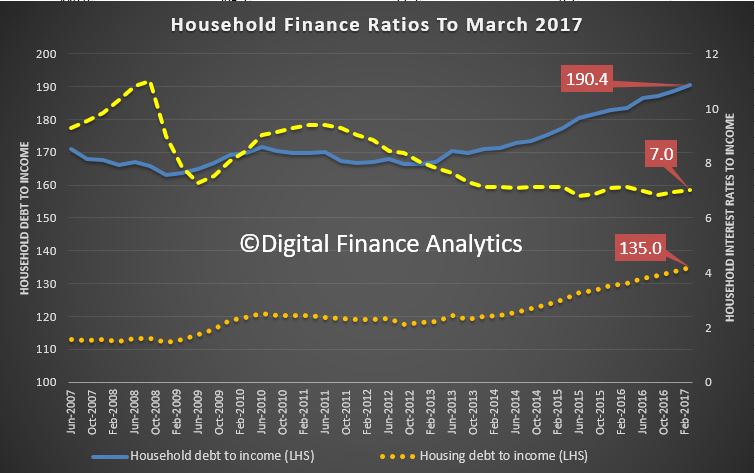
We know that household debt has never been higher in Australia, but I do not think the true impact of this, especially in a rising interest, low income growth environment is truly understood. We have to look beyond mortgage debt.
The latest RBA E2 – Households Finances – Selected Ratios shows that the ratio of household debt to annualised household disposable income , rose to 190.4, the ratio of housing debt to annualised household disposable income rose to 135, and worryingly the ratio of interest payments on housing debt to quarterly household disposable income has risen to 7.0, thanks to the out of cycle rate hikes and flat or falling incomes. Of course failing cash rates helped households out, but the lending standards were not adjusted until too late.
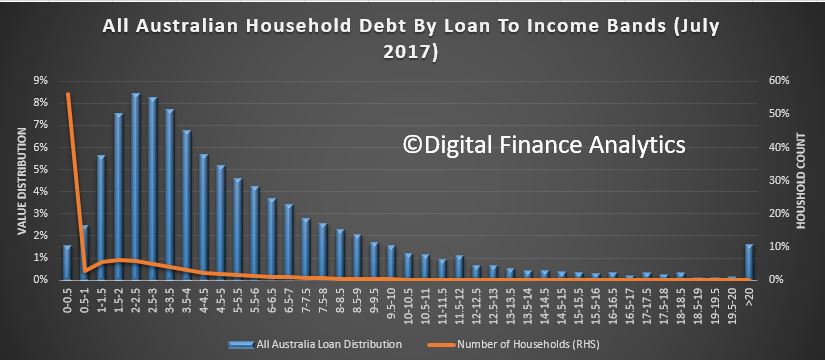
 But, here is the really scary picture of total debt value held mapped by debt to gross income ratio (DTI), aka Loan-to-Income (LTI). DTI or LTI is a good measure of potential risk in the system.

This first chart shows the distribution of debt value – of all types, including mortgagee, (owner occupied and investment), personal loans, credit cards, SACC borrowing, and all other loans – relative to gross income in debt-to-income bands. We are using date from our household surveys. It also shows the distribution of households, with more than half having low, or no debt, but with a long tail of highly indebted households.
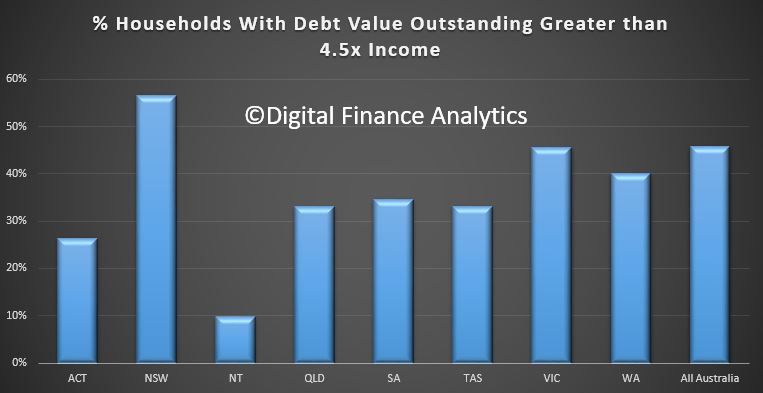
 Across Australia, more than 45% of all household debt (not just households with mortgages, but those mortgage free or renting) sit with households who have an LTI of more than 4.5 times annual income. I used 4.5 times because this is the ratio the Bank of England uses, and they say that higher LTI’s are more risky.
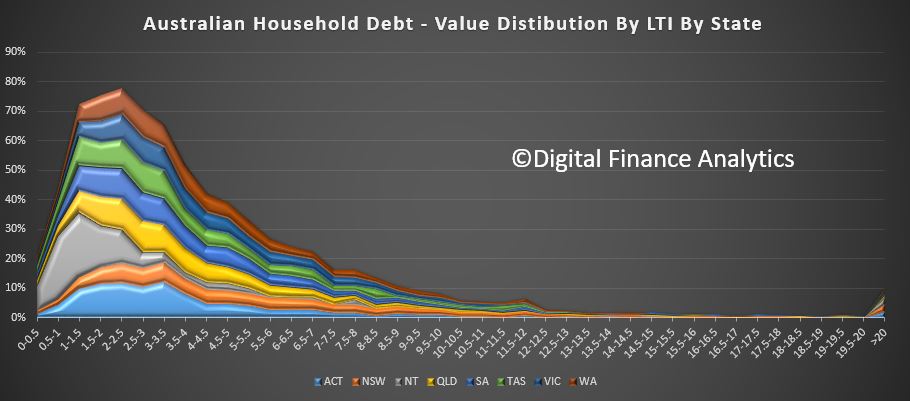
The second chart shows the relative distribution across the states and territories.
 The third chart shows the proportion of households in each state and territory with a DTI of more than 4.5 times. NSW holds the record, with more than half of all households above this, compared with 26% in ACT and 9% in NT.
 This is a big deal, especially in a rising interest rate environment. It means households have little wriggle room, and granted many will be holding paper profits in property which has risen significantly in recent years, this does not help with servicing ongoing debt repayments.
The effect of the debt burden is to reduce the ability of households to spend, and in effect it is a drag anchor on future economic growth.
The traditional argument that “most debt is held by those who can afford it” is partly true, but bigger debts require bigger incomes to service them, and the leveraged effect in a rising interest rate environment is profound.
One thought on “The Household Debt Quagmire”