APRA released their Property Exposures Data to March 2018 today.
We will delve into the detail later, but three charts tell the story, looking across the market of ADI’s with more than $1 billion of loans.
;
First, the number of loans being approved outside current serviceability standards has lifted to around 5% of all new loans. This reflects tighter controls in the banks, so they narrowed the serviceability aperture. But is also suggests that some loans are still getting funded under questionable parameters. Remember loan underwriting standards continue to tighten, so this will be an important measure to watch ahead.
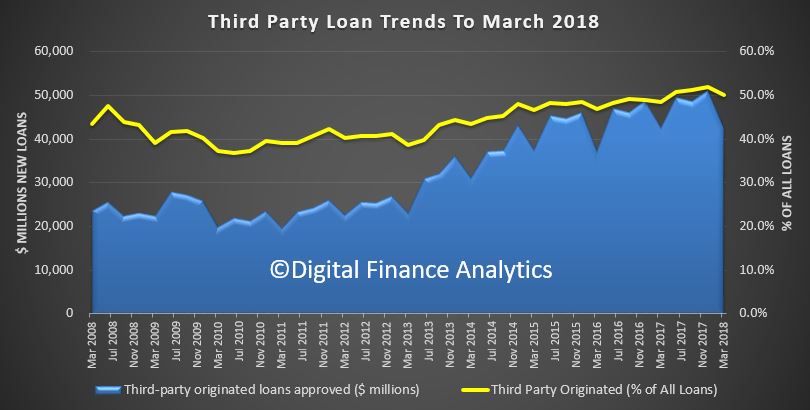
 Second, the volume and share of loans via brokers, having reach a peak last year look to be falling, reflecting first lower absolute volumes of new loans, and second a preference by the banks to use their own channels. We will be watching the mix by channel in the months ahead, our thesis is mortgage brokers are going to have to work a lot harder down the track!
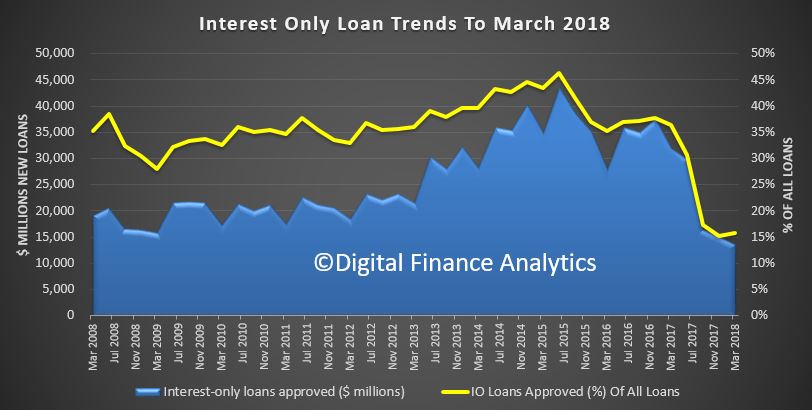
And third, the doozy, the share of interest only new loans have fallen to 15% of loans, and the value written in also down. So the APRA inspired intervention (better late then never) is hitting home. Again we need to watch whether there is a rebound as settings are tweaked to try and keep home prices falling further.
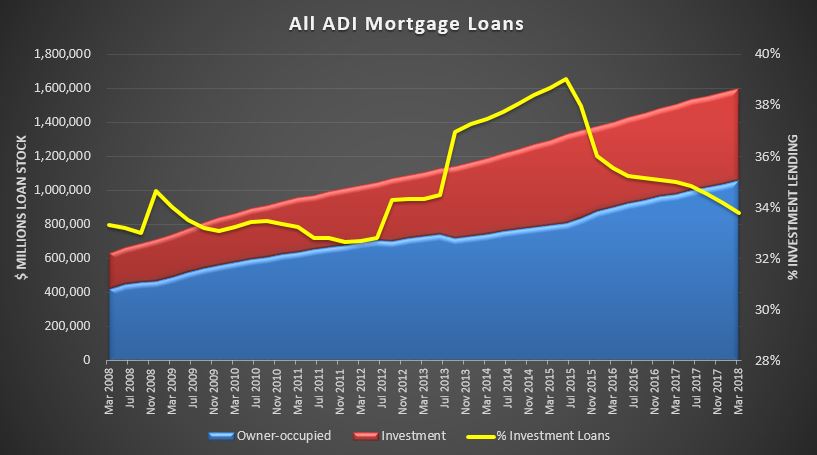
 OK, I lied, there is a fourth slide. Despite all the tightening, the total balances grew again in March to $1.6 trillion, despite investment loans falling to 33.8% of the portfolio. So lets be clear, household debt is still rising, with investment loans rising 0.4% in the quarter and owner occupied loans rising by 2%. Or over the past year, 2.6% and 8% respectively. Still too hot in the current climate, in my view. So more tightening is needed, and I suspect a harder Debt to Income hurdle of 6% is where it will bite.