
Moody’s says that inequality has been increasing in the U.S. for decades. This has been well-documented. However, new data from the Federal Reserve shed additional light on the distribution of wealth and how it has evolved over time. The Distributional Financial Accounts show levels and share of wealth across four segments of the wealth distribution: the top 1%, the next 9%, the rest of the top half, and the bottom half. This is done by sharing out household wealth as shown in the Financial Accounts using primarily the Survey of Consumer Finances, supplemented with other information in some instances.
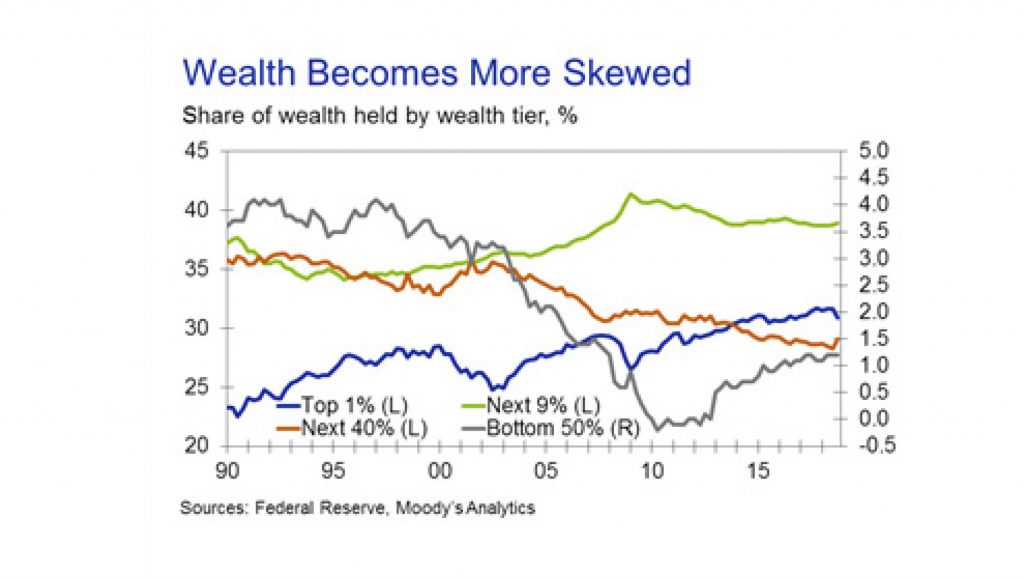
The data clearly show the skewed distribution of wealth. The most recent data, for the fourth quarter of last year, show that the wealthiest 1% of households held 30.9% of total household wealth, only marginally below the record high of 31.7% a year earlier and well above the 1990 low of 22.5%. By contrast, the bottom half of the wealth distribution holds only 1.2% of all wealth, down from over 4% at points during the 1990s. However, it is better than the period immediately after the Great Recession, when this group was in debt in aggregate.
One clear feature of the data is that the distribution of wealth doesn’t change in a linear fashion. The share of wealth held by the richest 1% has declined at times, and in some cases sharply. For example, the share topped 28% at the start of 2000 before falling under 25% in late 2002. Similarly, the share fell from 29.4% in late 2007 to 26.5% in early 2009. Both declines corresponded with sharp declines in U.S. stock prices.
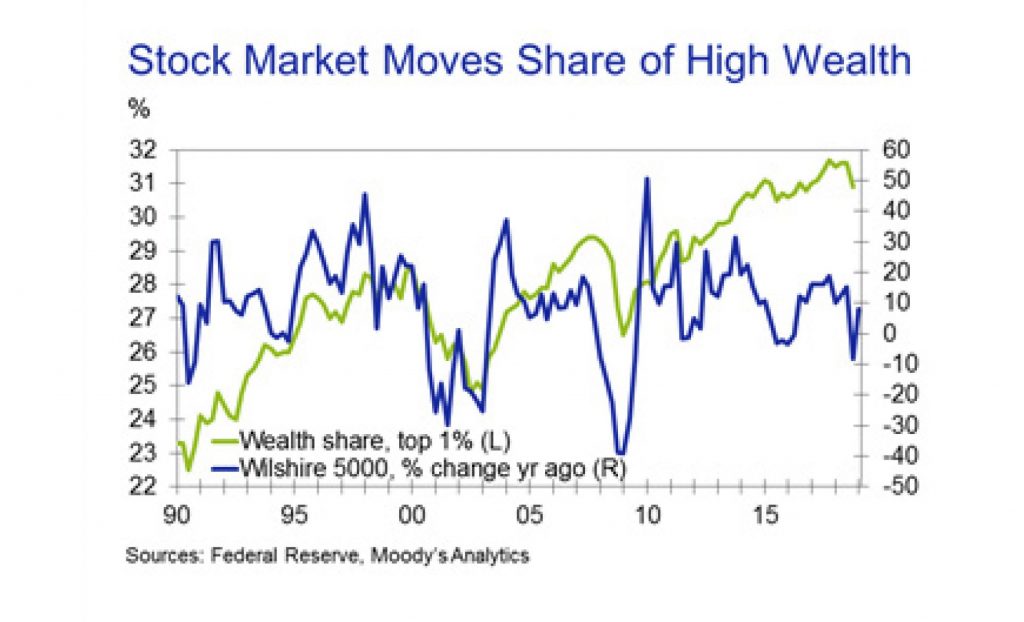
Ownership of stocks is heavily skewed toward the high end of the income and wealth distribution. Hence, the stock market is a strong driver of the share of wealth held by the richest households. The extent of the correlation may be surprising.
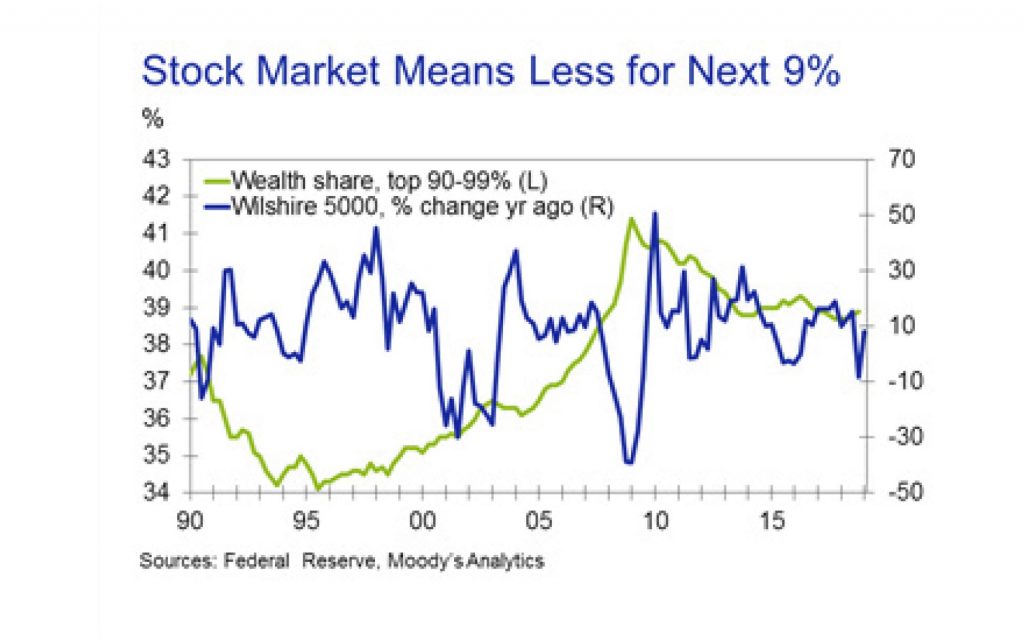
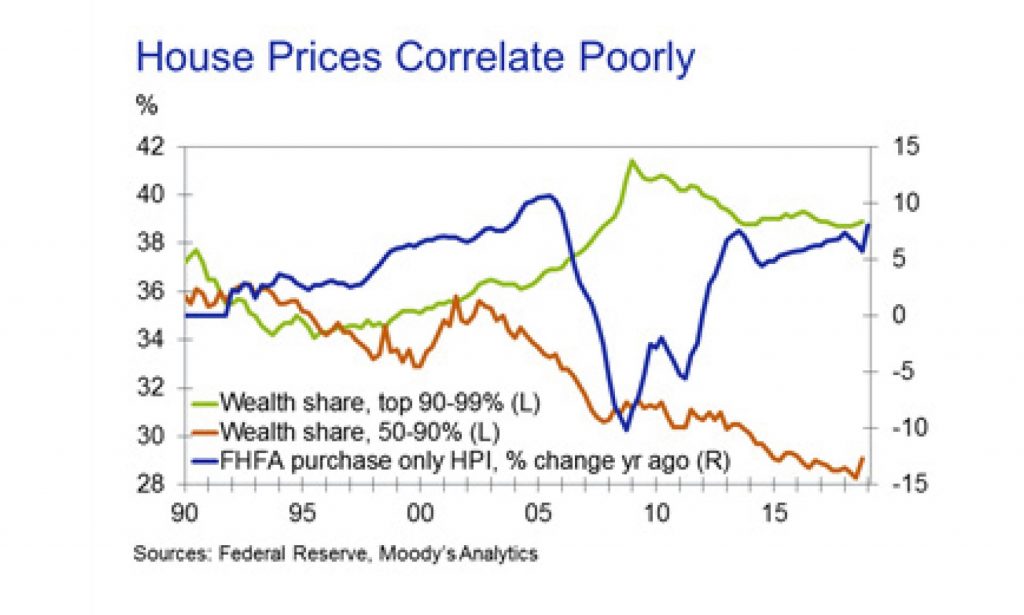
More interesting, the correlation largely breaks down for the next richest 9% of the population. Their share of wealth fell in the early 1990s, then rose steadily until the Great Recession before trending lower. While there is some correlation with movements in stock prices, they are clearly not the dominant driver they are for the richest households. This emphasizes how skewed wealth related to equity prices is.
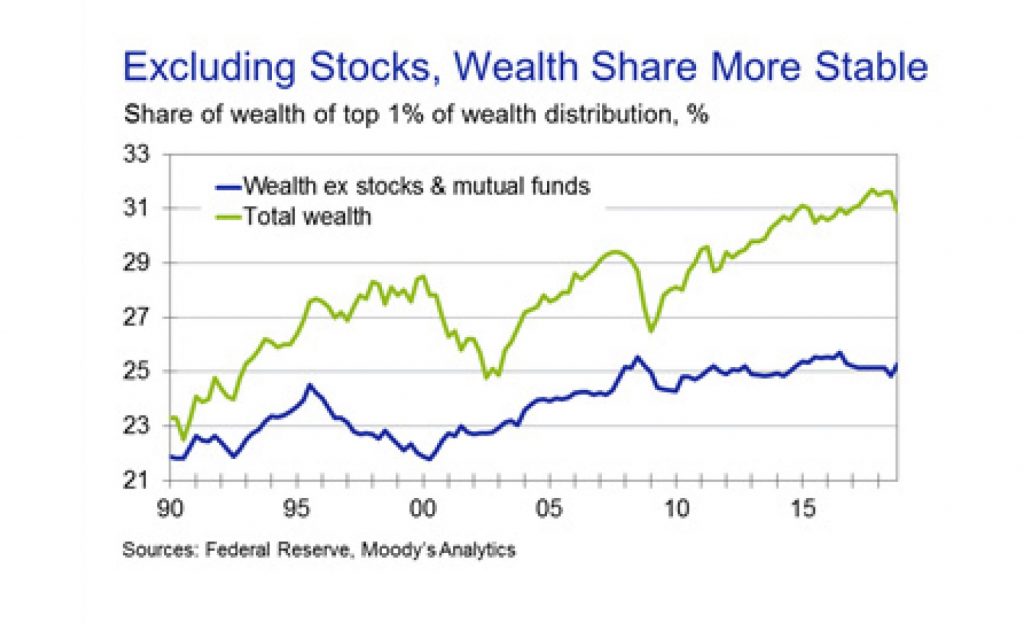
To drive home the point, the correlation between the share of total wealth held by the richest 1% of households and the share of corporate equities and mutual fund shares held by the richest households is an astounding 94%. At present, equities and fund shares account for nearly 40% of wealth for this group of households. However, this share has grown dramatically over time. In the early 1990s it was under 20%, and over the entire history of the series it averages 30%.
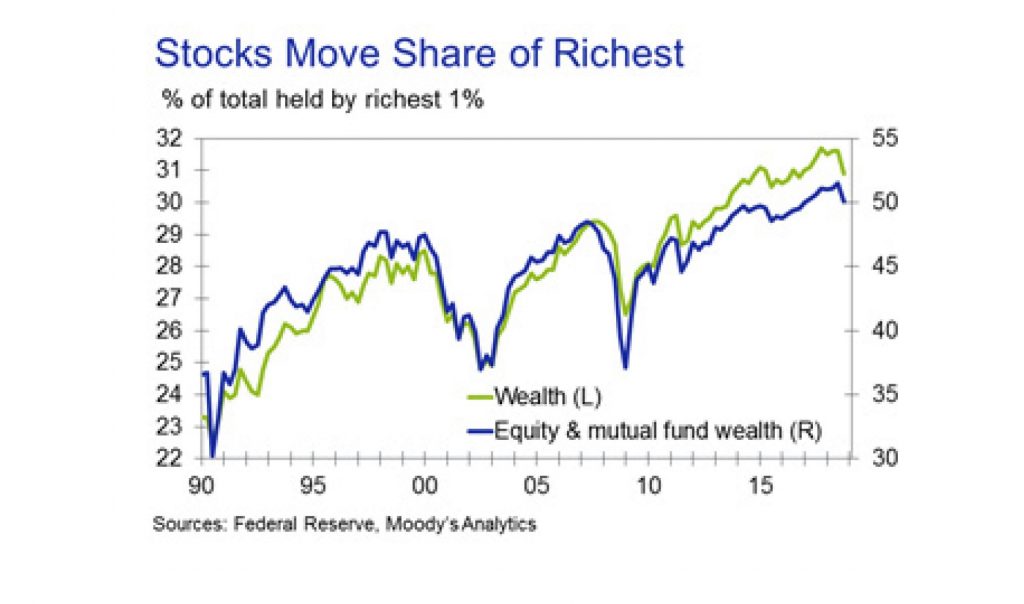
This one component of wealth is the major driver of changes in share for the wealthiest households. Their share of wealth excluding stocks and mutual fund shares is about 4 percentage points lower on average, rises less, and is much more stable. This may understate the impact of equity prices on the wealth of these households, since equities are included in life insurance reserves and pension entitlements and correlate with equity in noncorporate businesses.
Other obvious candidates as drivers of changes in the wealth distribution fail to achieve anything like the apparent impact of equity markets. Despite making up a larger portion of household assets than corporate equities and mutual funds, housing wealth is less of a driver of wealth shares. Houses are more commonly owned, and, other than around the Great Recession, movements in house price growth tend to be gradual. Even for the lower-wealth households, where real estate would be their primary asset, there seems little linkage between house price growth and those households’ share of total wealth. Similarly, the link between unemployment and wealth shares is weak.
The differences in the makeup of household balance sheets at different positions in the wealth distribution are also shown in the distributional accounts data. This is one of the driving factors in the share movements. Therefore, it should not be surprising that corporate equities and mutual funds are most important for the richest households. They account for over a third of assets for the wealthiest 1% of households, compared with about a fifth for the next 9% of households, under 10% for the next 40% of households, and under 4% of assets for the bottom half of the wealth distribution. Equity in noncorporate business is similarly skewed heavily toward wealthy households.
By contrast, real estate assets are the most important piece of the balance sheet for the bottom half of the wealth distribution. For this group, they account for about half of all assets. The share declines sharply as wealth increases until it falls below 12% of assets for the richest 1% of households.
Pension entitlements are an important component of the balance sheet for households in the upper half of the wealth distribution, excluding the very rich. They make up almost a third of assets for households in the 50th-90th percentiles of the distribution and about 30% for households in the top 10% excluding the top 1%. However, they make up less than 10% of assets for the very wealthy and bottom half of the distribution. Most likely, lower-wealth households don’t have pensions while pensions for the very wealthy are swamped by other assets. Pension entitlements are important for future spending but may be less important for current spending if they are not well-understood.
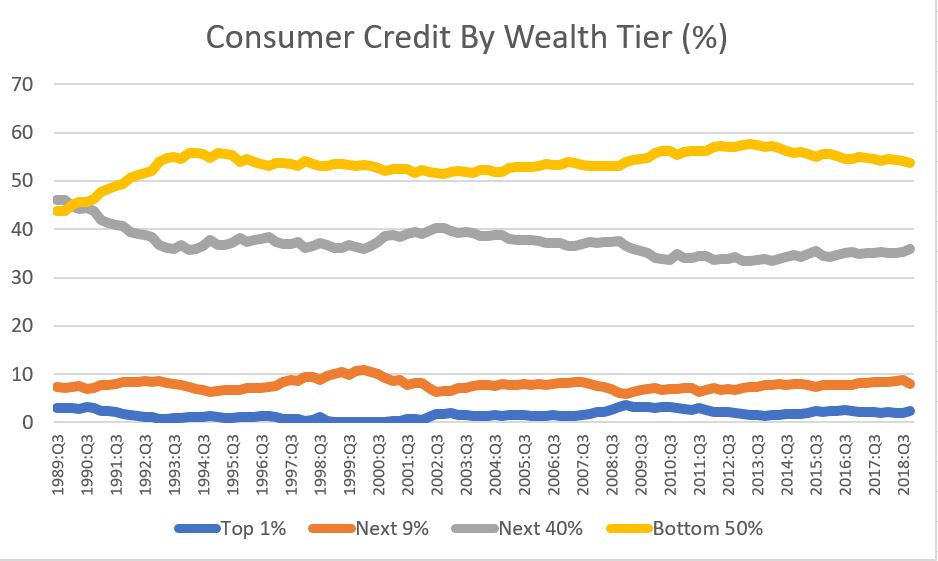
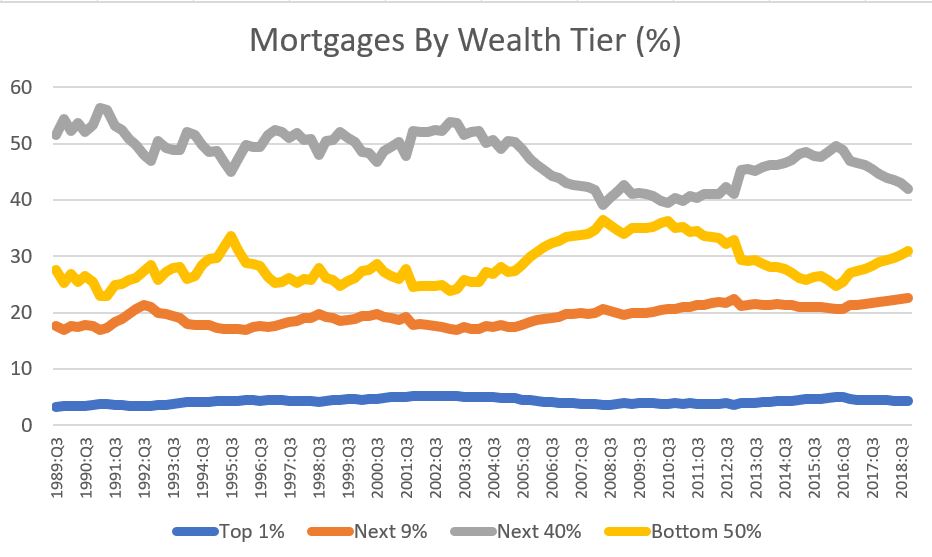
Liabilities follow what is probably an expected pattern. Mortgages account for a little over two-thirds of total household liabilities. However, they account for only a bit more than half of debt for households in the bottom half of the distribution. Consumer credit accounts for about 40% of their debt, the highest for any of the segments and well above the average of about a quarter.
The mortgage share increases until the top 1% of the distribution. They have nearly 15% of their debt in the other loans and advances category, dramatically more than other segments. This category captures debt related to their businesses and investments. Hence, just as real estate is a smaller portion of assets for the richest households, so too is mortgage debt a smaller share of liabilities.
The stock market has shown itself to be an important driver of the distributions of wealth. Current prospects are for the market to perform poorly by historical standards over the next year or so.
Economic growth is expected to slow and valuations remain high. Neither is favorable for the market.
The one silver lining in this is that weak stock market performance tends to associate with a moderation in wealth inequality.