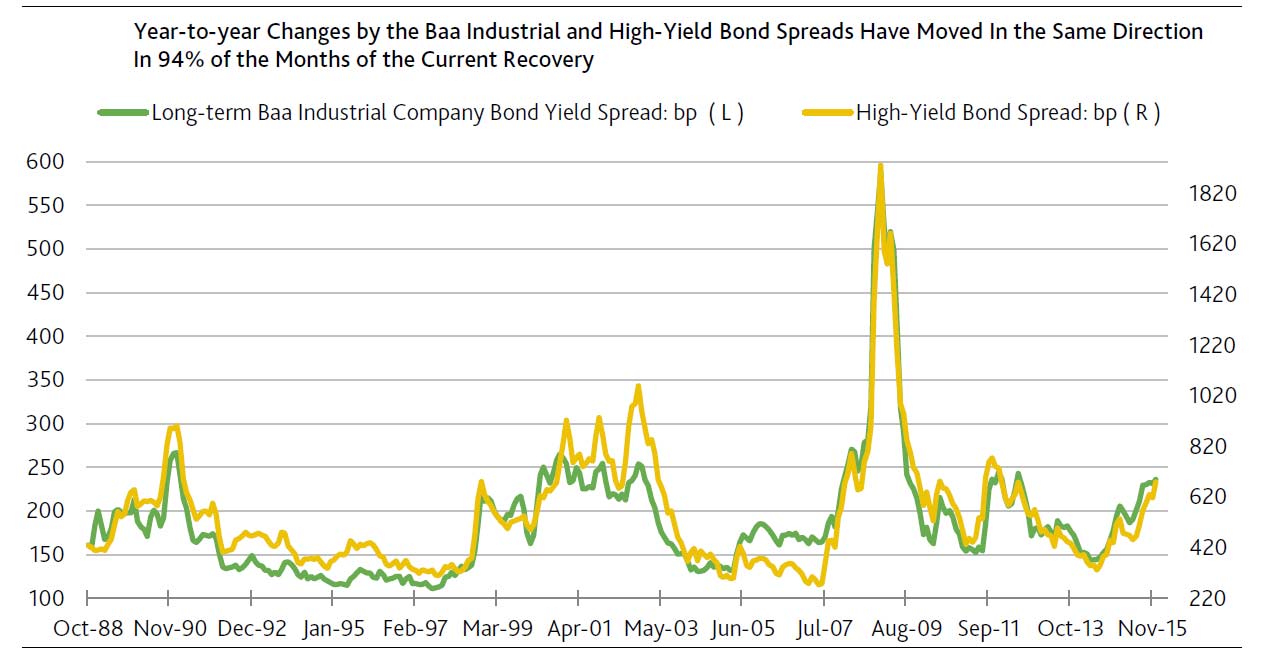
According to Moody’s the Fed’s first rate hike in more than nine years occurred in the context of a wider than 700 bp spread for high-yield bonds. This is noteworthy from corporate credit’s perspective. Never before in the modern era of the speculative-grade has bond market had the Fed hiked rates when the high-yield bond spread was wider than 625 bp.
Going forward, if the high-yield spread remains wider than 650 bp, the Fed may opt not to hike rates at the March 2016 meeting of the FOMC. Moreover, if the spread averages more than 700 bp during the next three months, a weakening of credit conditions may force the Fed to reconsider its current strategy.
Moreover, current outlooks for defaults and profits weaken the case in favor of a percentage point climb by fed funds over the next 12 months. Following the recessions of 2001 and 1990-1991, the Fed began to hike rates in June 2004 and February 1994. The latter two starts to a series of Fed rate hikes were accompanied by declining trends for the high-yield default rate and lively profits growth.
After dipping by a prospective -0.2% annually in 2015, the Blue Chip consensus projects a below-trend 4% rebound by 2016’s pretax profits from current production. An acceleration of labor costs vis-a-vis business sales may squeeze margins considerably in 2016.
The sharp ascent by the average EDF (expected default frequency) metric of US/Canadian below-investment-grade companies from December 2014’s 3.2% to a recent 6.7% highlights the worsened outlook for high-yield defaults.
Nevertheless, a fast rising high-yield EDF metric does not necessarily rule out another Fed rate hike. For example, fed funds was lifted from May 1999’s 4.75% to May 2000’s 6.50% notwithstanding an ominously elevated average high-yield EDF metric of 7.9%, whose then rising trend could be inferred from its average yearly increase of a full percentage point. However, it should be added that by January 2001 the Fed was forced to quickly slash fed funds to 5.5%. Yet the latter was not enough to prevent March 2001’s arrival of a recession.
But this time the Fed may not be indifferent to a worsening default outlook. Today’s macro backdrop compares unfavorably with that of 1999 and early 2000. The 4.5% annual surge by real GDP during the year-ended Q1-2000 towers over the 2.5% growth expected of real GDP for 2015 and 2016.
In addition, the labor market was much tighter according to how payroll employment’s 62.3% share of the working-age population was much greater than the recent 56.7%. Further, unlike the 3.7% year-over-year increase by the average hourly wage for the 12-months-ended March 2000, the average wage now rises by a much slower 2.3%. Thus, it’s doubtful that policymakers will shrug off another extended stay by the high-yield EDF metric of 6.5% or greater. Unless credit conditions improve, the current series of prospective rate hikes may be cut short.
 Contrary to conventional wisdom, the yield spreads over Treasuries of investment- and speculative-grade bonds are highly correlated. For a sample beginning with July 1991 and ending in November 2015, the high-yield bond spread shows surprisingly strong correlations with Moody’s long-term industrial company bond yield spreads of 0.93 for Baa-grade bonds and 0.90 for single-A-rated securities.
