Understanding Household Income, Wealth and Property Footprints

Today we commence the first in a new series of posts which examines household wealth, income, property and mortgage footprints. We will look at the latest trends in LVR and LTI; highly relevant given the tightening standards being applied in other countries, including Norway and New Zealand. We will be using data from our rolling household surveys, up to 9th September 2016.

Today we paint some initial pictures to contextualize our subsequent more detailed analysis, which will flow eventually into the next edition of the Property Imperative, due out in October 2016.

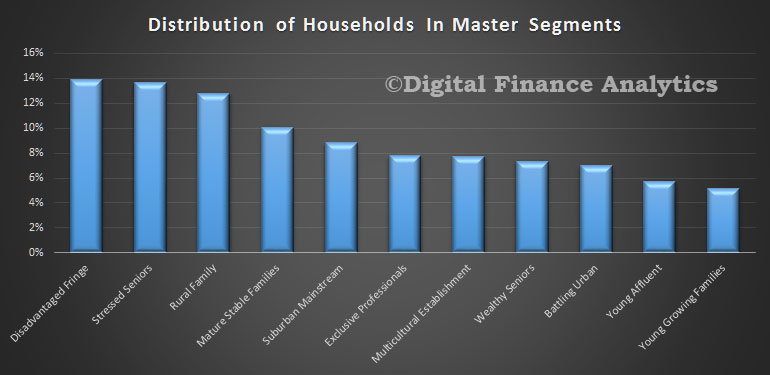
To start the analysis we look at the relative distribution of our master household segments. You can read about our segmentation approach here.

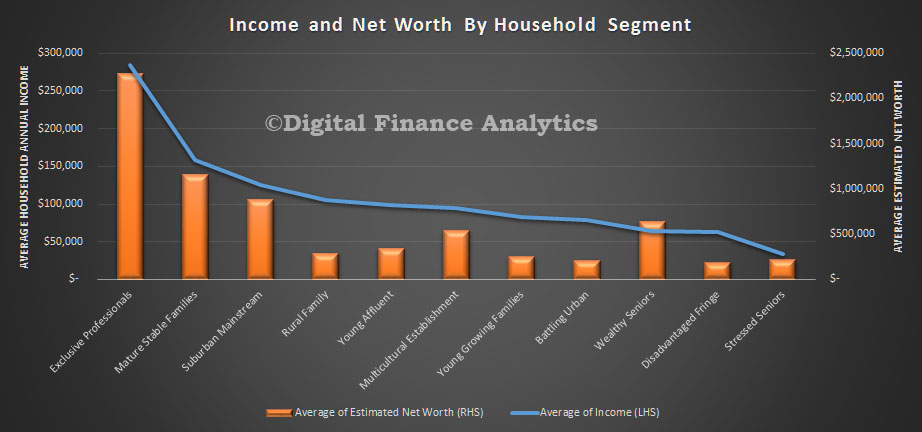
segment-distNext we show the relative household income and net worth by our master segments. The average household across Australia has an estimated annual income of $103,500 and an average net worth (assets less debts) of $600,600; the bulk of which is property related.

segments-income-and-wealthThere are wide variations across the segments. The most wealthy segment has an average annual income of more than eight times the least wealthy, and more than ten times the relative net worth.

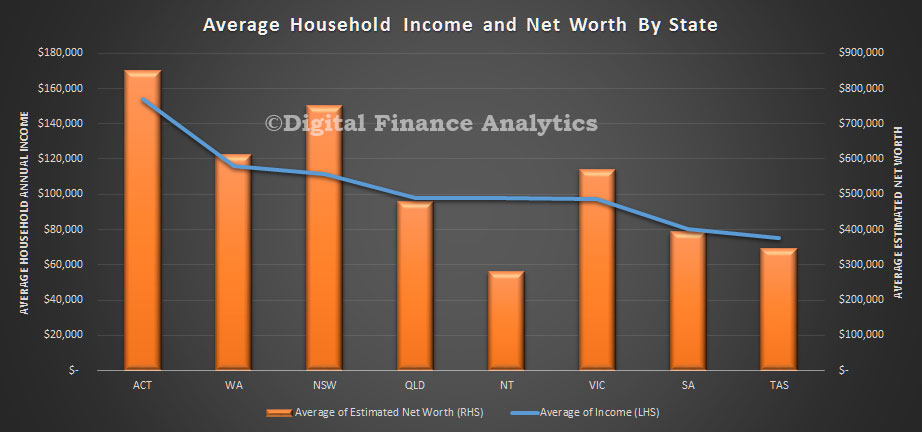
Across the states, the ACT has the highest average income and net worth, whilst TAS has the lowest income (half the income), and NT the lowest net worth (third the net worth).

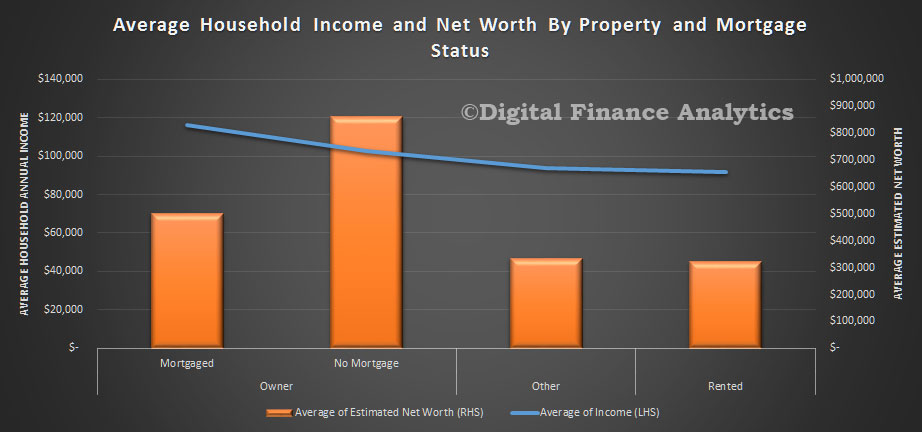
states-income-and-wealthProperty owners are better placed, with significantly higher incomes and net worth, compared with those renting or in other living arrangements. Those with a mortgage have higher incomes, but lower net worth relative to those who own their property outright.

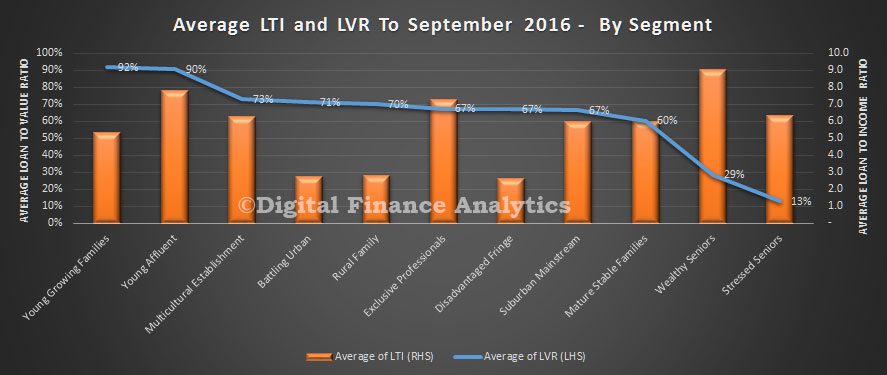
propertys-income-and-wealthThe loan to value (LVR) and loan to income (LTI) ratios vary by segment.

lti-and-lvr-by-segmentYoung growing families, many of whom are first time buyers, have the higher LVR’s whilst young affluent have the higher LTI’s (along with some older borrowers). Bearing in mind incomes are relatively static, those with higher LTI’s are more leveraged, and would be exposed if rates were to rise.

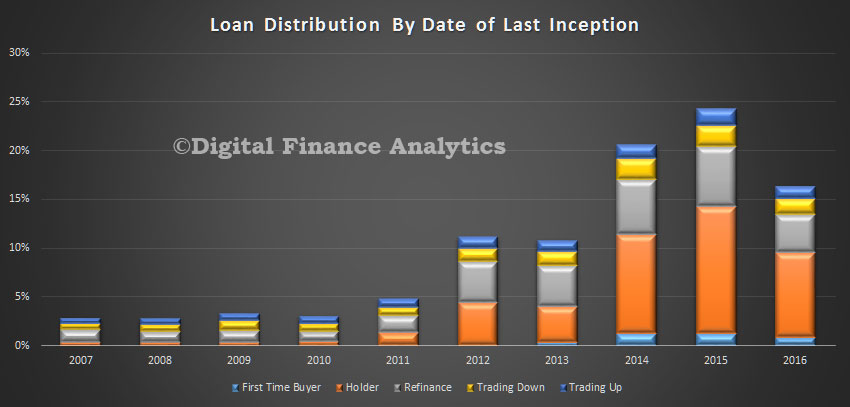
Finally, we see that many loans have been turned over, or refinanced relatively recently, so the average duration of a mortgage is under 4 years.

inceptionThere is a relatively small proportion of much older dated loans which we have excluded from the chart above. Nearly a quarter of all loans churned in 2015, and 2016 shows the year to date count.

Next time we will look at LTI and LVR data in more detail.

Norway Tightens Mortgage Underwriting Standards

Moody’s says Norway’s Proposed Tighter Mortgage Underwriting Standards Are Credit Positive for Banks and Covered Bonds.

On 8 September, Norway’s Financial Supervisory Authority (FSA) published a proposal for tighter mortgage underwriting limits. The proposed regulation, made to the Ministry of Finance, includes a limit of 5x loan value to the borrower’s gross income; requiring loans to amortise down to a 60% loan-to-value (LTV) ratio, down from 70%; a maximum home-equity LTV of 60%, down from 70%; and the reduction or complete elimination of banks’ ability to deviate by 10% from the regulatory limits, including the 85% maximum LTV requirement.

The new measures would reduce borrowers’ ability to take on excessive debt amid still-increasing house prices, particularly in the urban areas concentrated around the capital city of Oslo. These more restrictive proposals are credit positive and would strengthen the credit quality of mortgage loans on banks’ balance sheets and in covered bond cover pools.

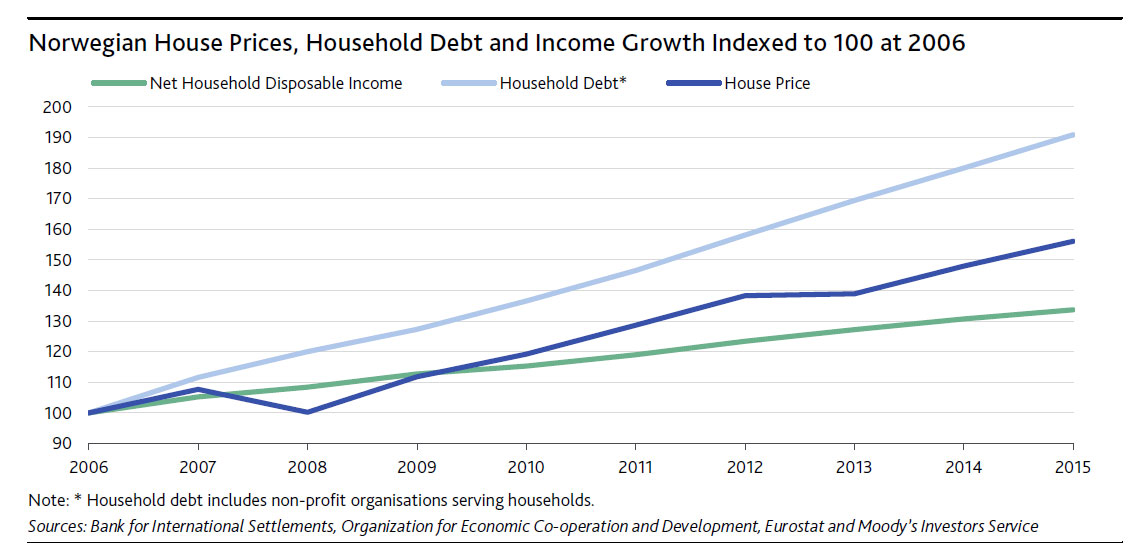
Norway has experienced strong house price growth since 2008 and the proposal for tighter regulations seeks to dampen excessive house price growth and credit expansion. Despite house price contraction in oilreliant areas such as Stavanger, prices in Oslo remain on a strong upward trajectory and increased more than 12% per year to the end of June. During the same period, banks and mortgage companies’ residential mortgage lending grew nationally by around 6%, according to Statistics Norway. Although Norwegian banks and covered bonds performed strongly even after the decline in oil prices, a mortgage market cool down would reduce the risk of asset price bubbles and excessive lending to vulnerable households.

norway

Capping the loan-to-income ratio limits the overall size of loan a borrower can take, regardless of affordability. In the present low interest rate environment, loan affordability is good, but large loans can easily become burdensome if interest rates rise. Lower LTV ratios decrease the loan’s probability of default and increase recoveries of loans that do default.

Increased amortization and limits on home-equity withdrawal reduce or constrain LTVs and limit potential payment shocks, benefiting mortgage loans’ credit quality. Currently, banks must factor amortisation into affordability testing, but a material proportion of loans are still interest-only. Interest-only loans can be vulnerable in a falling house price environment. Unlike an amortising loan, an interest-only loan’s LTV only declines over time as a result of house price appreciation, resulting in a potentially lower equity buffer against declining house prices and leaving the borrower exposed if selling the property is the only method of repaying the loan at maturity. Similarly, restricting home-equity withdrawals limits increases in LTVs and discourages borrowers from taking on high debt burdens.

Removing or reducing banks’ ability to have up to 10% of loans breach the maximum 85% LTV requirement or other requirements would be prudent. The FSA considers the 10% limit substantial in light of debt and house price developments. If the government does not completely remove the 10% waiver from the regulations, the FSA suggests reducing it to 4%.

An advantage of having the regulator set underwriting restrictions is that it prevents competition from eroding prudent practices, while also allowing the rules to be changed when conditions warrant such changes. However, nationally applicable restrictions do not differentiate between Norway’s regions, and regional economic developments vary. The FSA emphasized that the tighter regulation may be temporary and could be lifted if market conditions changed, which would give banks the opportunity to recover some flexibility in their lending practices. Nevertheless, Norway’s underwriting standards and prudential regulation of mortgage loans are among the strongest in Europe, particularly the country’s conservative approach to LTVs and its affordability stress of five percentage points on loan interest rates.

Weighing up the risks behind the profits of Australia’s big four banks

From The Conversation.

The biggest Australian banks are fairing well in a year of increased pressure to reform from politicians, international events like the Britain’s exit from the European Union and more regulation from the Australian Prudential Regulation Authority (APRA).

A number of interrelated factors have contributed to the relatively strong performance of the Australian banks. For instance, the banks have limited exposure to the types of securities which led to massive losses for their counterparts in other countries. The banks also heavily rely on domestic loans, particularly the low risk household sector, so better lending standards and a proactive approach to prudential supervision by APRA may have contributed.

The Basel III regulatory requirements, brought in after the 2008 financial crisis, emphasise holding an increased amount of subordinated debt, as a measure of market discipline. However all the big four banks are holding less and less subordinated borrowings. More specifically, it declined by more than 50% from 2007 to 2014, according to our calculations.

APRA limits banks’ holdings of higher risk securitised assets, these are loans packaged into securities, to a maximum of 25% of the banks’ loan portfolio. These are high risk if not properly understood or defined, as happened with United States home loans, blamed for the start of the global financial crisis.

When Australian banks calculate bank capital requirements, they need to fully account for securitised assets. This is a rule from APRA that goes beyond international standards, to reflect the risk inherent in these products.

Inter-bank liquidity tightened significantly with all banks increasing their holdings of Exchange Settlements Accounts at the Reserve Bank, this a form of low risk liquidity. Australian banks have lower interbank deposits compared to their Europe and USA counterparts and are also heavily involved in long term wholesale funding and are required to hold more liquid assets including government debt to deal with liquidity. All of this makes Australian banks less risky in times of crisis because spillover effects from other banks are less likely.

The big four CC BY

There has been a significant increase in concentration in the Australian banking industry since the global financial crisis. For example with Westpac and the Commonwealth Bank of Australia taking over St. George Bank and Bank West, respectively.

Following mergers, the big four account for 88% of the Australian banking system assets. This reinforces the idea that the banks are “too big to fail”.

The banks have also moved to more fee generating activities, which increases risk, but to a lesser extent in Australian banks. Data shows between 1998 and 2014, on average, 1.2% greater interest income was generated relative to non-interest income for Australian banks, according to our analysis. However, there is also similar evidence for the top eight publicly-listed Canadian banks. They exhibit on an average, a 2.5% increase in net interest revenue relative to non-interest income over the same time period.

This reinforces that Australian and Canadian banks demonstrated extra ordinary resilience during the credit turmoil in the global financial crisis. The World Economic Forum in 2008 reported that Australia and Canada were among the top four safest banking systems in the world.

Large banks in Australia are active in international markets through direct ownership of foreign based banks and having offshore operations as a source of capital. Deregulation of banking in countries such as the USA, Canada, Australia and many developing countries has opened up new markets for foreign banks. Australian banks’ largest international exposure is to New Zealand, where all big four banks retain sizeable operations.

Although the growing interdependence among international economies and financial markets is certain to continue, the impact of Brexit on Australian banks remains minimal. It remains to be seen in the long-run how Australian banks will weather the international banking/economic developments.

As a last measure of the bank health, we can measure the domestic systemic risk with a methodology based on one used by the official Basel Committee on Banking Supervision. Based on July 2016 monthly data, the big four banks account for 80.38% of the systemic risk in the financial system and the riskiest, from highest to lowest, are the National Australia Bank, the Commonwealth Bank of Australia, Westpac and ANZ.

A history of failed reform: why Australia needs a banking royal commission

From The Conversation.

The move for an inquiry into how banks treat small business customers should not overshadow the ongoing call for a broader royal commission on banks.

Several financial inquries (outlined below) have failed to tackle the growing concentration in the Australian finance sector, or the need to separate general banking from investment banking as the reform process in the United States, UK and Europe is contemplating.

Calls for a royal commission are also underpinned by ongoing reports of misconduct within the banks, summarised in a timeline of bad behaviour below.

Every other major industrial country is at an advanced stage in bank reform, and Australia would be isolated if it did not engage in a similar substantial and structural reform process.


Former Commonwealth Bank chief and Financial Services Inquiry Chair David Murray released the final report of the inquiry in December 2014. Britta Campion/AAP

Financial reform in Australia

1997 Wallis Inquiry

This inquiry has been associated with the “four pillars” policy towards bank mergers (though the inquiry itself did not propose this), and the opposition to any merger between ANZ, CBA, NAB and Westpac. The unwritten policy originated in Paul Keating’s reservations on concentration in the industry. It also led to the CLERP financial reforms announced on fund raising, disclosure, financial reporting and takeovers.

2009 Future of Financial Advice Inquiry

This inquiry stemmed from industry failures, such as Storm Financial and Opes Prime, and explored the role of financial advisers and the general regulatory environment for these products and services. It resulted in the Corporations Amendment (Future of Financial Advice) Act 2012 by the Labor government to tackle conflicts of interest within the financial planning industry. This was subsequently amended by the Liberal government in the Corporations Amendment (Financial Advice Measures) Act March 2016 which softened some of the reforms.

2012 Cooper Inquiry

This was a review into the governance, efficiency, structure and operation of Australia’s superannuation system. It examined measures to remove unnecessary costs and better safeguard retirement savings, claimed fees in superannuation were too high, and that choice of fund in superannuation had failed to deliver a competitive market that reduced costs.

2014 Parliamentary Joint Committee on Corporations and Financial Services Inquiry

This inquiry included proposals to lift the professional, ethical and education standards in the financial services industry. It aimed to clarify who could provide financial advice and to improve the qualifications and competence of financial advisers; including enhancing professional standards and ethics.

2015 Murray Inquiry

This inquiry was intended to provide “a ‘blueprint’ for the financial system over the next decade,” but fell somewhat short of this in not critically addressing the concentration or restructuring of the main banks. While acknowledging the high concentration and vertical integration of Australia’s banking industry the inquiry’s approach to encouraging competition was to seek to remove impediments to its development. The inquiry aimed to increase the resilience to failure with high bank capital ratios, and to reduce the costs of failure, including by ensuring authorised deposit-taking institutions maintained sufficient loss absorbing and recapitalisation capacity to allow effective resolution with limited risk to taxpayer funds.


Demonstraters throw their support behind US Senator Elizabeth Warren’s proposal to reform the Glass Steagall Act. Shannon Stapleton/Reuters

In contrast to the limitations of the Australian reform process, more ambitious reform of the banking sector is being actively considered in the rest of the advanced economies. This is because of widespread international concerns regarding bank monitoring and standards, and the continuing threat of systemic risk and failure.

The objective is to create more effective competition, greater choice, improved governance, more balanced incentives, and responsible behaviour and performance. Central to international reform proposals is the intention of:

  • shielding commercial banks from losses incurred by speculative investment banking
  • preventing the use of public subsidies (eg central bank lending facilities and deposit guarantee schemes) from supporting risk taking
  • reducing the complexity and scale of banking organisations
  • making banks easier to manage and more transparent
  • preventing aggressive investment bank risk cultures from infecting traditional banking;
  • reducing the scope for conflicts of interest within banks
  • reducing the risk of regulatory capture and taxpayers exposure to bank losses.

Among the ongoing international initiatives to reform the banks are the UK Banking Reform Act, which includes ring fencing retail utility banking from investment banking, due for implementation in 2019.

In the US, the 21st Century Glass Steagall Act, proposed by Elizabeth Warren and supported by Democratic nominee Hillary Clinton, involves separating traditional banks that offer savings and checking accounts from riskier financial services such as investment banking and insurance.

In Europe, the Liikanen Plan, announced in 2012, proposes investment banking activities of universal banks be placed in separate entities from the rest of the group. This has already been taken up widely throughout the European banking sector.

A licence to operate?

The banks have experienced continuous systemic risk (partly of their own making), erosion of their integrity, and a loss of public trust.

The Australian banks are on notice that they need to renew their licence to operate, to reconnect with their sense of duty and the Australian people, and to reconfirm their responsibilities to the Australian economy. This will occur, even if it takes a royal commission to achieve it.


A timeline of banks behaving badly

January 2004: NAB foreign currency options trading

NAB announces losses of A$360 million due to unauthorised foreign currency trading activities by four employees who concealed the losses. Bank risk policies and trading desk supervision prove ineffective. NAB sacks or forces the resignation of eight senior staff, disciplines or moves 17 others and restructures its board of directors. Four traders, including the head of the foreign currency options desk, are subsequently prosecuted and jailed.

2008: global financial crisis takes down Opes Prime, Storm Financial, Allco and Babcock and Brown

The market capitalisation of the stock markets of the world peaks at US$62 trillion at the end of 2007. By October 2008 the market is in free fall, having lost US$33 trillion dollars, over half of its value in 12 months of unrelenting financial and corporate failure. Originating in the toxic sub-prime securities of the New York investment banks, the financial crisis threatens to engulf the economies of the world.

The mythology today is that Australia miraculously escaped the global financial crisis due to the resilience of its regulatory system and the governance and risk management of its banks. The reality is that more than a dozen significant Australian companies went under during the crises (amounting to losses in excess of $60 billion in total). In almost every case at least one of the big four banks were involved in supporting the business models and extending credit to very doubtful enterprises.

July 2012: HSBC money laundering

A US Senate Inquiry discovers that HSBC allowed Latin American drug cartels to launder hundreds of millions of ill-gotten dollars through its US operations, rendering the dirty money usable. The HSBC Swiss private banking arm profited from doing business with arms dealers and bag men for third world dictators and other criminals.

HSBC agrees to pay a fine in excess of US$2 billion to settle US civil and criminal actions. In 2016 it is revealed that UK Chancellor George Osborne intervened to prevent criminal charges against HSBC as this might have undermined financial markets.

2013: Libor rigging

Libor is the international vehicle for settling inter-bank interest rates, and covers markets worth US$350 trillion.

In 2012 it’s revealed that wholesale fraudulent manipulation of the rates has been occurring for years, and throughout the reform process following the global financial crisis. The crisis engulfs many international banks including Barclays, Citigroup, Deutsche Bank and JP Morgan. The irony of the scandal is that Libor was intended as a measure of the state of health of the banking system.

The US Commodity Futures Trading Commission and US Department of Justice impose fines totalling hundreds of millions of dollars on the international banks. In Australia ASIC investigates the role of ANZ, BNP, UBS, and RBS and imposes fines. In 2014 the administration of Libor is transferred to the Euronext NYSE.

2014: Commonwealth Bank financial planning scandal

An ABC Four Corners report reveals CBA customers have lost hundreds of millions of dollars after the bank’s financial advisers recommend speculative investments.

The report describes the sales-driven culture inside the Commonwealth Bank’s financial planning division, with a focus on profit at all cost and a culture that has been built on commissions. The bank is found to have misled potentially thousands of clients.

The bank sets up an internal inquiry and compensation (though is subsequently accused of dragging its feet on compensation). A Senate inquiry into the performance of ASIC during the affair recommends establishing a Royal Commission to examine the banks.

May 2015: Forex manipulation

Following the Libor scandal, it is discovered that traders have been deliberately orchestrating trades in the $US5.3 trillion-per-day global foreign exchange market to their own advantage.

“They acted as partners – rather than competitors – in an effort to push the exchange rate in directions favourable to their banks but detrimental to many others,” says US Attorney-General Loretta Lynch. “And their actions inflated the banks’ profits while harming countless consumers, investors and institutions around the globe.”

US and British regulators fine Barclays, Citigroup, JP Morgan, RBS, UBS, and Bank of America more than US$6 billion in recognition of the scale and duration of the fraud.

March 2016: ASIC targets ANZ for rigging the bank bill swap rate (BBSW)

ASIC commences legal proceedings against ANZ for unconscionable conduct and market manipulation in relation to the bank’s involvement in setting the bank bill swap reference rate (BBSW) in the period March 2010 to May 2012. It foloows up with actions against NAB and Westpac.

The BBSW is the primary interest rate benchmark used in Australian financial markets, administered by the Australian Financial Markets Association (AFMA). It is alleged the banks traded in a manner intended to create an artificial price for bank bills.

March 2016: CommInsure payments scandal

The insurance arm of the Commonwealth Bank comes under media scrutiny for operating along similar lines to the earlier financial planning business.

A company whistleblower reveals the measures the bank is taking to avoid making insurance payouts to policyholders, many of whom are sick or dying.
Author: Thomas Clarke, Professor, UTS Business, University of Technology Sydney

Strong Auction Clearance Results Again Today

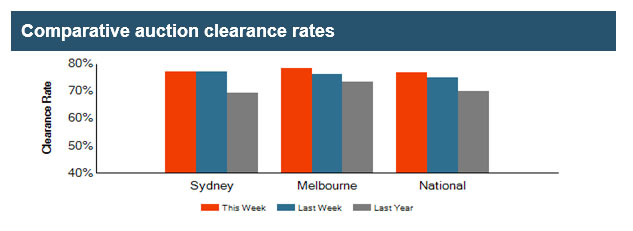
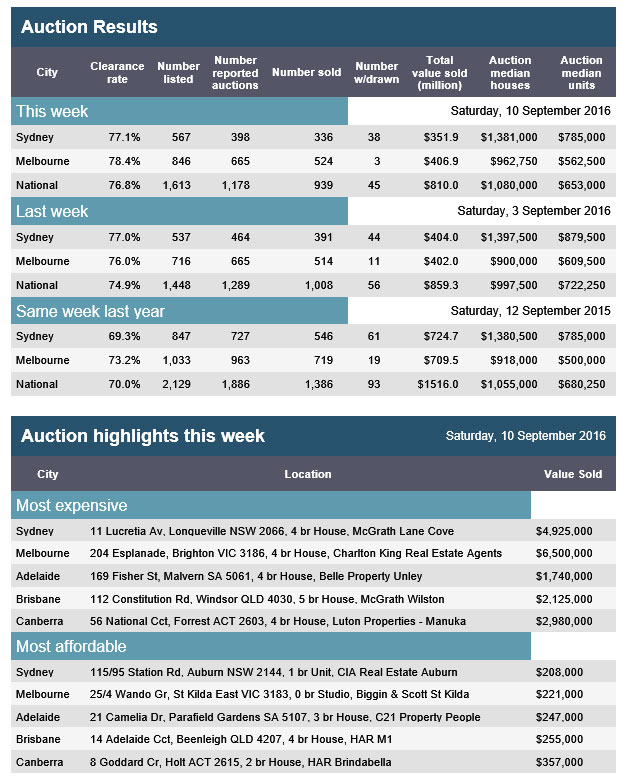
The preliminary data from APM PriceFinder suggests another strong set of results, with strong clearance rates, on higher listings (though volume was down compared with this time last year). Melbourne cleared 78.4% compared with 77% last week, and 73.2% last year. Nationally, the clearance rate was 76.8% compared with 74.9% last week, on 1,613 listings compared with 1,448 last week. The same week last year cleared 70% from 2,129 properties.

apm-auctions1-10-sep-2016

In Brisbane, 54% of the 110 listings sold, whilst in Adelaide, 77% of the 46 listings cleared and in Canberra, 78% of the 44 listings sold. Sydney cleared 77.1% of 567 properties, compared with 77% of 537 last week and 69.3% of 847 properties a year ago.  Further confirmation there is still momentum in the market.

apm-auctions-10-sep-2016

MySuper becoming a ‘conscious choice’ – BT

From InvestorDaily.

Increased product availability within the MySuper regime is starting to attract ‘choice’ members as well as SMSF trustees, says BT Financial Group.

Audit-Pic

Speaking at a Trans-Tasman Business Circle luncheon in Sydney yesterday, BT Financial Group chief executive Brad Cooper said the super system will see staggering growth over the next two decades.

“Australians have invested more than $2 trillion in superannuation assets, and at its current trajectory, the system is projected to double to $4 trillion in the next nine years and reach $9.5 trillion by 2035,” he said.

Mr Cooper divided the system into three main categories: advised, self-managed and MySuper or ‘default’ funds.

“We call [MySuper] default because you default there when you have provided no other option,” he said.

“But I think people will stay in the MySuper environment because they will be consciously staying in there, leaving decisions to trustees who they believe would make more informed decisions than they otherwise would.”

Industry segmentation within the MySuper sector – into industry, retail, and public – will start to “fall away” as the focus shifts to outcomes for people covered by MySuper products, according to Mr Cooper.

Some members with “specific requirements” will start to move out of the ‘choice’ environment and into MySuper products.

“SMSFs are interesting too – as you get more product availability within the MySuper regime, people will start to look at why they’re in an [SMSF] and maybe choose to go back [to MySuper],” he said.

However, the SMSF sector will also continue to grow over the next two decades.

“That sounds contradictory, but when you see the super system going from $2 trillion to $9.5 trillion there’s a lot of growth in each of those sectors,” Mr Cooper said.

“More people staying in MySuper because they’ll start to trust that a lot more – many people will make a conscious decision.

“I think they will move between MySuper operators based on whether or not that MySuper fund’s working for them, based on cost/performance or other attributes.”

Here’s what happens when you ‘like’ a brand on Facebook

From The Conversation.

Businesses seem obsessed these days with getting you to “like” them on Facebook.

It’s difficult to browse the internet without being inundated with requests to like a company’s Facebook page or with contests and offers dependent on doing so.

From the company’s perspective, a like on Facebook offers a chance to stay “top of mind,” a marketing concept that means a consumer thinks of a specific brand first for a certain product or service by having its promotional messages show up in that user’s Facebook newsfeed. Being liked can also be used as a metric to determine the performance of social media campaigns and other promotional activities. The more a company is liked, the more successful the promotion is thought to be.

But is this really the case? To find out, we surveyed hundreds of Facebook users to dig into the meaning and value of the Facebook like. We wanted to understand the motivations behind liking certain types of brands and discover how that affects interactions between the user and the business. We also sought to understand how this varies depending on brand type (i.e., product makers versus service providers).

Findings from two studies we undertook reveal that what likes say about consumers and what they think about the brands they like is surprisingly varied.

Does Facebook’s ‘like’ button create brand loyalty? Fabrizio Bensch/Reuters

The loyalty of liking

For the first study, we asked 150 Facebook users to tell us about a brand that they currently like on Facebook. We then asked them to describe their motivation behind clicking the like button the first time, their interactions with the brand since liking them and any changes that have occurred in their relationship with the brand since then.

From our results, it seems that the primary reason that consumers choose to like a brand on Facebook is a sense of existing loyalty or obligation to support a brand. The largest percentage of respondents said they liked a brand simply because they felt that’s what a loyal fan should do. The next biggest share seemed to be more focused on getting something in return for their like, such as information, social recognition or entries into contests.

Interestingly, only a relatively small percentage of respondents reported that they “liked” the brand on Facebook because they simply liked (had a positive attitude toward) the brand. This differs from loyalty in subtle ways.

For example, I may have a positive attitude toward the Rolls Royce brand after seeing its products in advertisements, product placements, etc., but I have never owned one of its cars; therefore, I do not feel loyalty or obligation to the brand. This finding shows that some users who may not have purchased products from the brand may still like the brand on Facebook for various reasons.

As for levels of interaction since first liking a brand, over half of users said that while they may have read the brand’s posts or viewed its images in their Facebook newsfeed, they haven’t given any information whatsoever back to the brand. Just one-fifth said they reposted or shared content from the brand, while only 17 percent reported actually commenting on brand posts.

Finally, there was an interesting and contradictory set of instances in which respondents reported no change in the brand relationship but at the same time went on to actually detail positive brand-related consequences.

For example, a respondent initially noted that his relationship with Ford did not change after liking the Ford page, but later noted that he did look at more photos of new Ford trucks posted by the company on Facebook. This could be interpreted as a change in their relationship, because they are interacting more with the brand.

This suggests that generating Facebook likes can indeed have positive outcomes for a company, including having more interaction with its fans.

Are all likes created equal?

While the first study provided interesting results, we wanted to see if there was a statistically significant difference in the way that Facebook users reported interacting with product versus service brands.

While varying types of businesses may all be trying to gain the same outcome, there is evidence that differences exist between how product- and service-based brands interact with potential customers, ones that require distinct engagement strategies.

Just as all brands are not the same, all likes are not equal. It may seem more natural to like a brand that makes an actual product such as a favorite car manufacturer or clothing brand than a service like a plumber, cable provider or pet groomer. That’s because, due to their intangible nature, services can be much more difficult for consumers to evaluate. As a result, service companies need to initiate social interactions with their customers in order to communicate value and set appropriate expectations.

So in our second study, we surveyed 300 Facebook users to explore these differences and discovered some interesting similarities and differences in the way they interact with brands selling products and those offering services.

For example, we found that “fans” of product brands were more likely to report engaging in passive interactions with the company such as by reading or liking posts compared with those of service brands. They also reported a greater intention to make future purchases.

We found no differences between the groups, however, in their intentions to engage in more active Facebook interactions such as sharing or commenting on posts.

Parsing the results

So what does this all mean?

First, it tells us that simply adding up Facebook likes does not necessarily tell us how engaged a customer is with a company’s brand. Many of our respondents liked their respective brands for reasons other than wanting to engage in an interactive relationship. In other words, quantity of likes does not equal quality of relationships.

In addition, brand and social media managers should not automatically assume that new Facebook followers are new to the company. Many of our respondents felt that it was their obligation to a favorite or oft-purchased brand to like that brand on Facebook.

Although passive engagement with followers is perhaps not what gets the most attention when pundits discuss the benefits of Facebook engagement, it still offers benefits, such as becoming more “top of mind.” Brand managers should not always assume that their loudest and most active Facebook followers are the only ones getting the message.

Finally, our research offers different lessons for service- and product-based brands. For the former, feelings of brand connectedness were a strong outcome of Facebook interaction. These companies should perhaps focus more on personalizing their Facebook messages in an attempt to further stimulate and enhance this elevated sense of connectedness.

For product-based brands, although brand connectedness was lower, purchase intention and brand attitude – the positive or negative associations one has with the brand – were higher. To leverage this, these companies should perhaps include more calls to action on Facebook and showcase their latest and greatest product offerings.

So next time you “like” a brand on Facebook, think about what you are telling the company. And whether that’s the message you want to send.

The Top Digital Suburbs Around Perth

As we continue our series on Australia’s top digital suburbs, today we look at WA, and the region around Perth. The top postcode is 6210, which includes Coodanup, Dudley Park, Erskine, Falcon, Greenfields, Halls Head, Madora Bay, Mandurah, Meadow Springs, San Remo, Silver Sands, and Wannanup around 65 kms from Perth.

The location of digitally active households is becoming an increasingly important question, as mobile penetration and use climbs. It fundamentally changes the optimal marketing approach and channel strategy.

Using data from our household surveys we track the proportion of households with a preference for using digital devices – especially smartphones – for their banking interactions and other online activities. The latest data, which will flow in due course to our next edition of the Quiet Revolution – our channel analysis report – shows that there are large numbers of digitally savvy consumers and small businesses who want more digital, and less branch. They want a “mobile first” offering.

To illustrate this we map the current branch representation around Brisbane, based on the latest APRA points of Presence report.

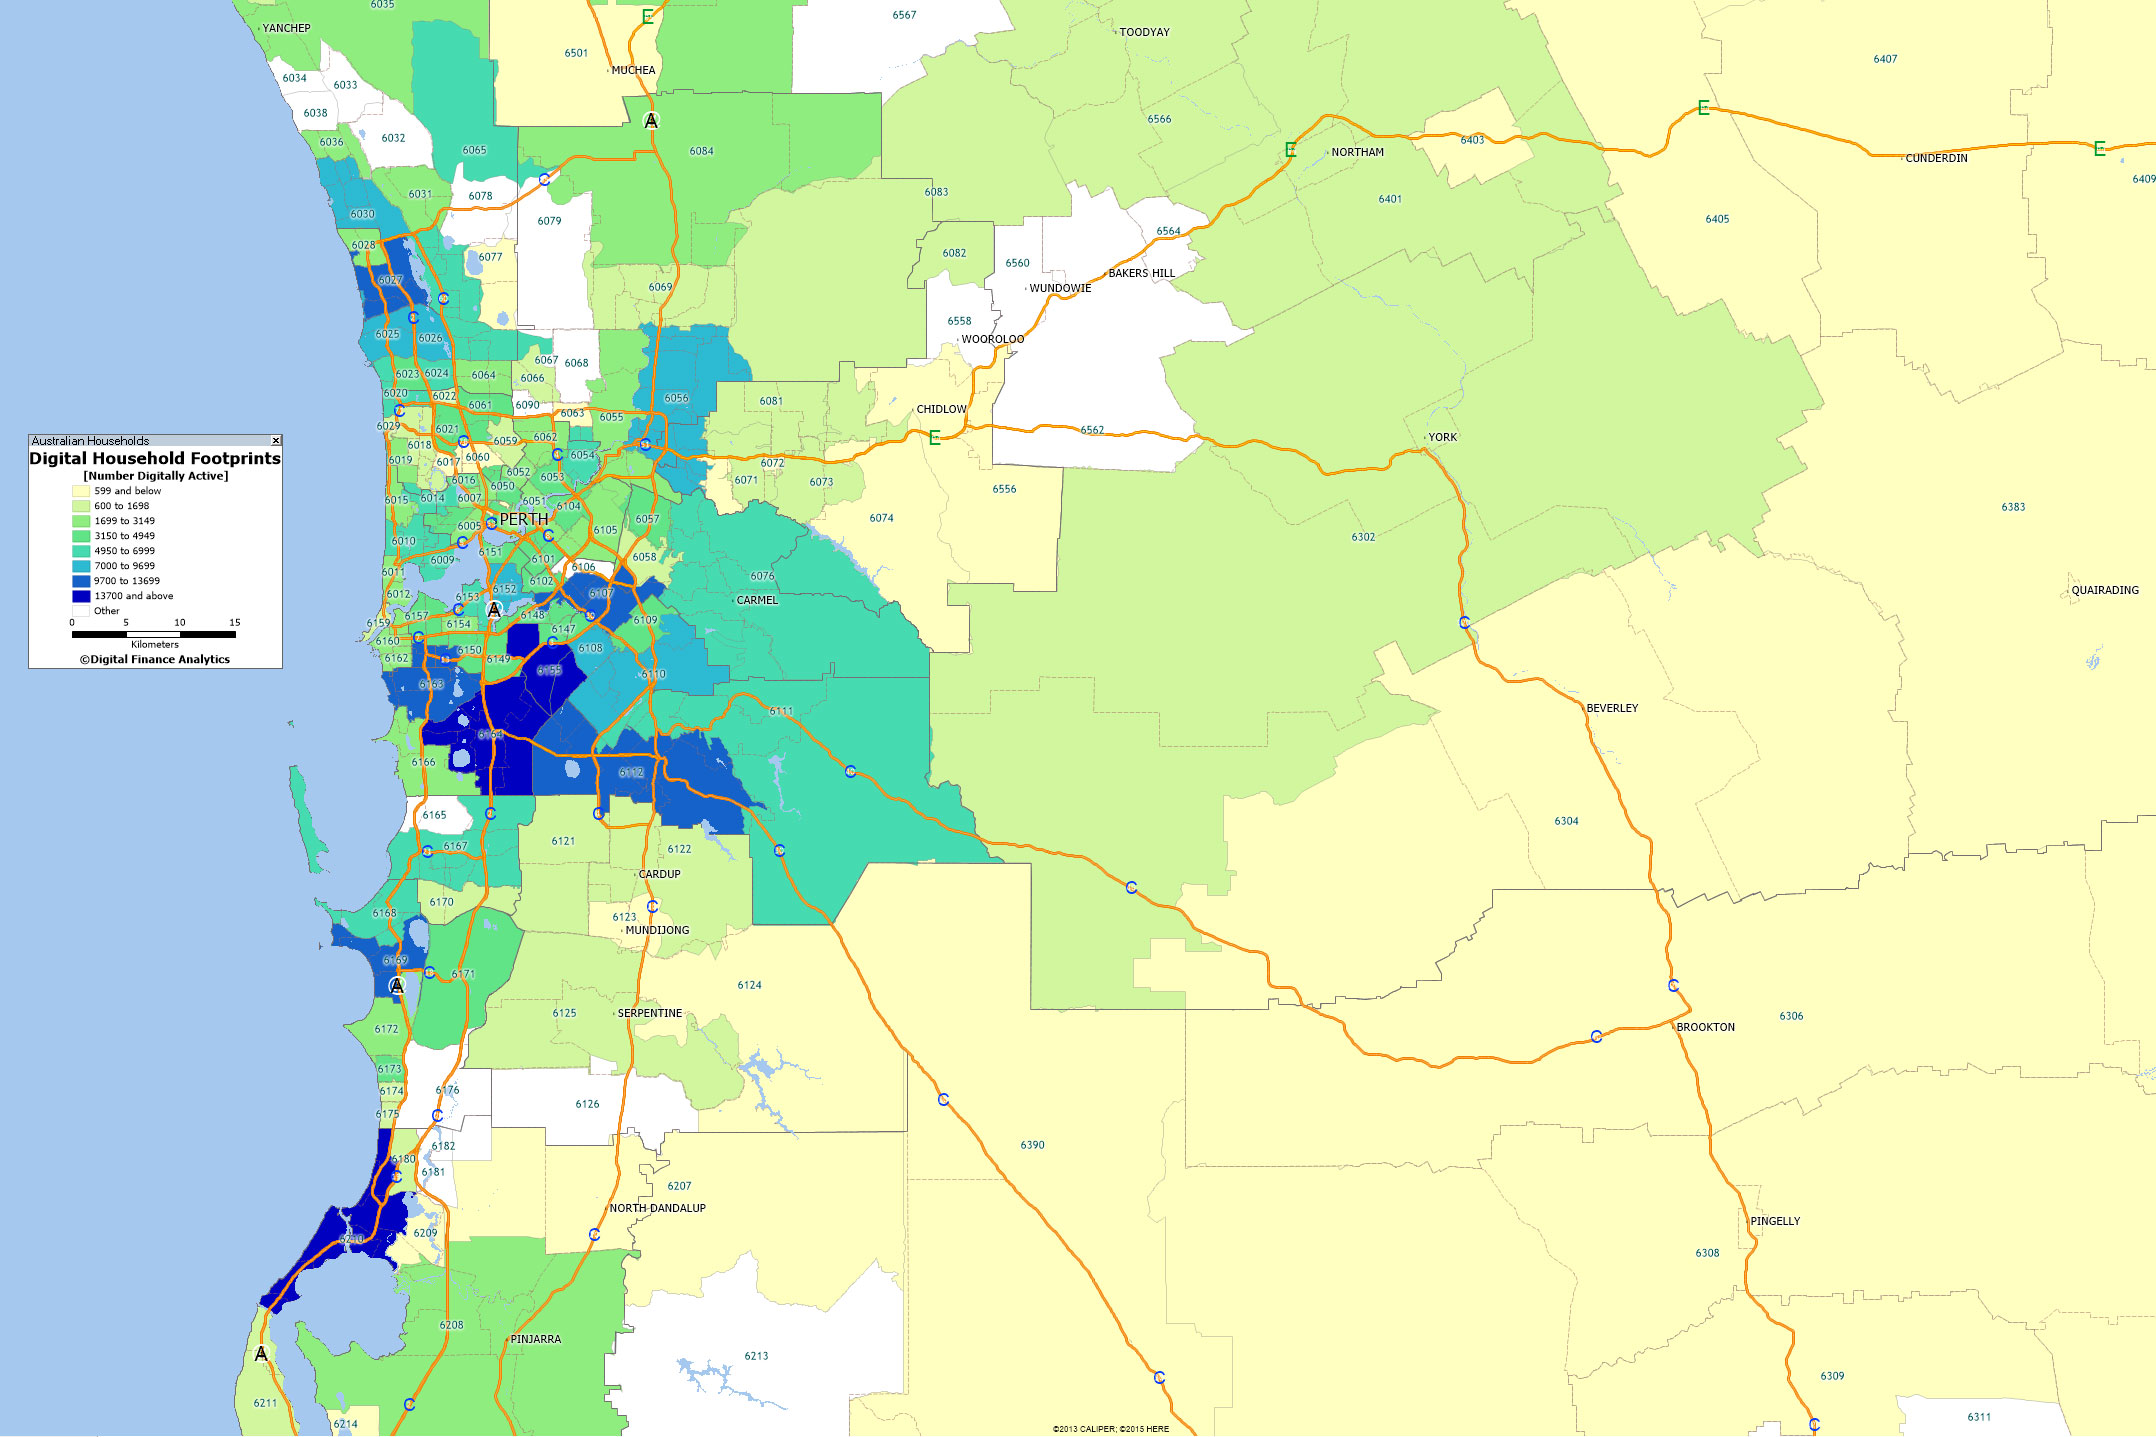
branch-mapping-waThen we mapped the number of households by digital segments – identifying those seeking a mobile first solution – to postcodes.  There is a striking mismatch between the two.

digital-footprint-perthHere is the top 10 listing by number of digitally aligned – mobile first – households across SA. They vary by segment, age, zone and region.

digital-suburbs-waThis information is useful to anyone wishing to engage with these households because it highlights where the centre of gravity for online initiatives should be focussed. The point is that although households are in the digital world, they still have a geographic centre. Digital still has a geographic sense.

Looking at the banks, it seems that they are not heeding the geographic concentration of mobile first households, and nor are they fully comprehending the changes afoot. We think it likely there will be significant stranded costs in the branch network, and insufficient focus on “mobile first”banking offerings.

Households are leading the way.

Next time we will reveal the top ten digital suburbs across Australia.

Investment Loans Still Growing

The latest lending finance data from the ABS, released today, shows the total value of dwelling finance commitments excluding alterations and additions rose 0.3%. Investment housing commitments rose 1.1%, while owner occupied housing commitments fell 0.1%. The less reliable seasonally adjusted measure showed the total falling by 1.8%. Many commentators will I am sure focus on this, and claim there is a “dramatic correction”.

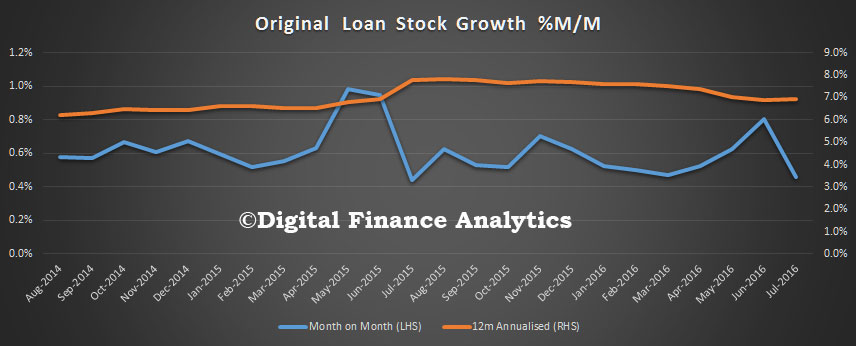
The original loan stock series shows an annual growth rate of housing lending still running close to 7%; with a slight slow down in recent months – not the significant slow down some have suggested.

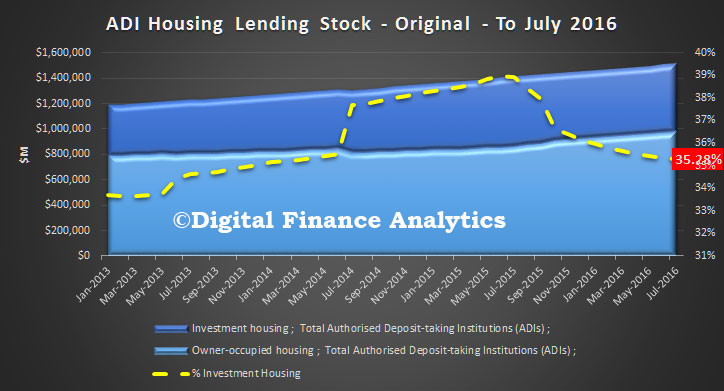
home-lenidng-trend-growth-july-2016-absTotal loans on book, in original terms, is $1.52 trillion, up 0.46%, of which 35.28% are for investment loan purposes, down from 35.36% last month. Investment lending stock rose $1.3 billion (up 0.24%) and OO lending stock rose 0.93%, up $9 billion. Remember, more than $1bn loans were reclassified in the month, so there is noise in the data.

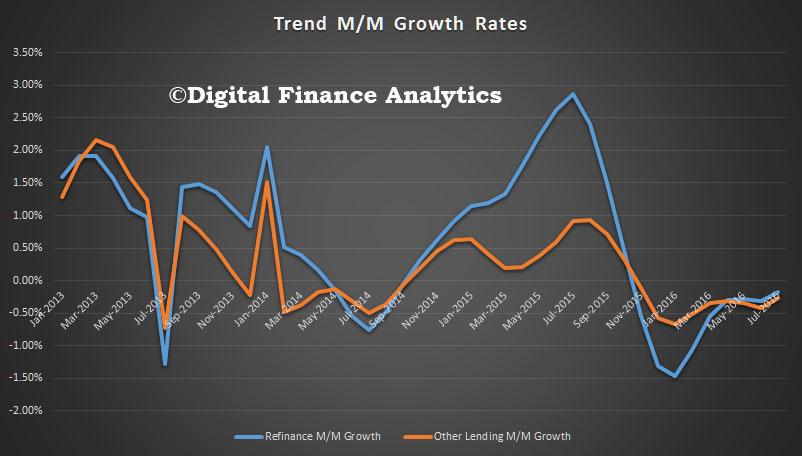
home-lenidng-trend-stock-july-2016-absLooking at the monthly trend flows,  momentum continues to ease, but more slowly.

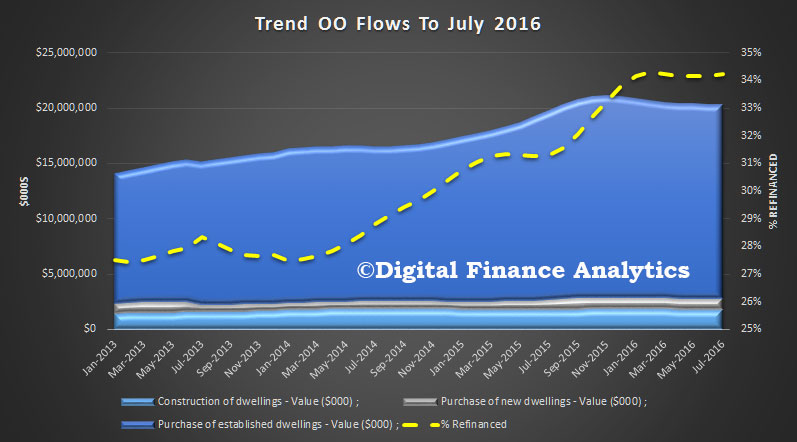
home-lenidng-trend-oo-growth-july-2016-absLast month, construction loans fell 0.34% in number terms, down 19,000; and fell by $0.7m in value terms. There was a rise in the number of new dwellings purchased, up 0.45% or 12,000; and in value terms up 0.66% or $6.5m. The purchase of established dwellings fell by $26m, or 0.15%. The number of refinanced transactions continued to rise, up 42,000, or 0.2%, and up 0.06% or $4.3m. The proportion of refinanced transactions fell by 0.18% compared with last month, or $24m. Refinancing remains a critical driver of ongoing growth.

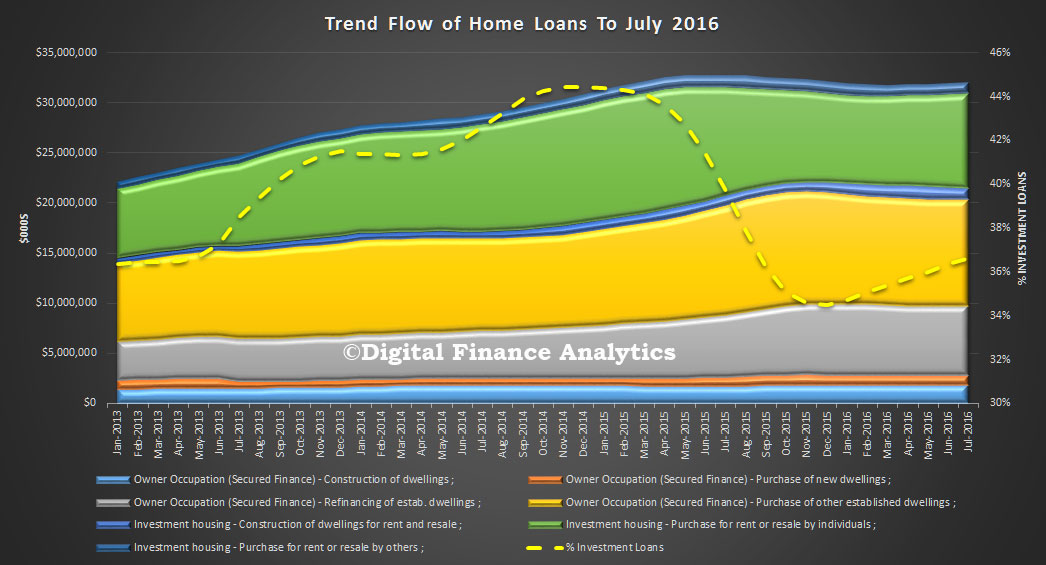
home-lenidng-trend-oo-flow-july-2016-absIn trend terms, the value of investment loans rose by $127m or 1.1%, and made up 36.6% of new transactions, up compared with 36.3% last month.

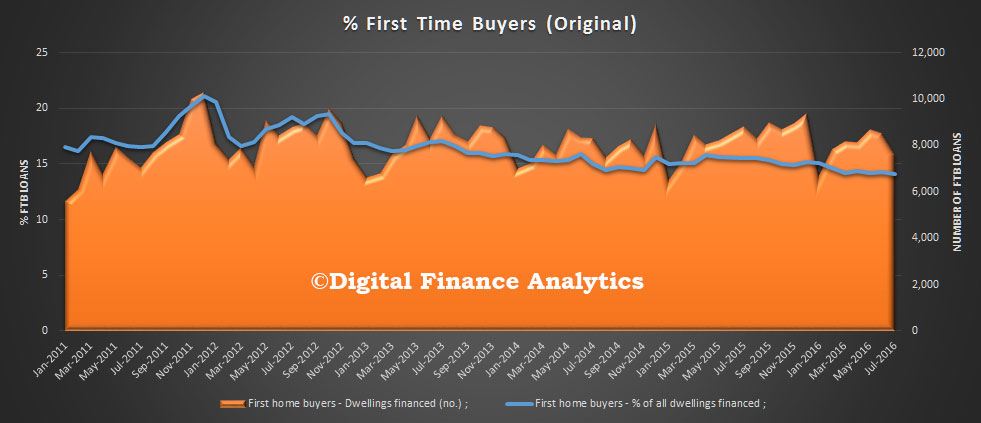
home-lenidng-trend-flow-july-2016-absFinally, in original terms, the number of first home buyer commitments as a percentage of total owner occupied housing finance commitments fell to 14.1% in July 2016 from 14.3% in June 2016. The number fell from 8,486 to 7,586, down more than 10%.  The average loan size was $335,600, 0.2% higher than last month.  Signs of tightening in lending conditions?

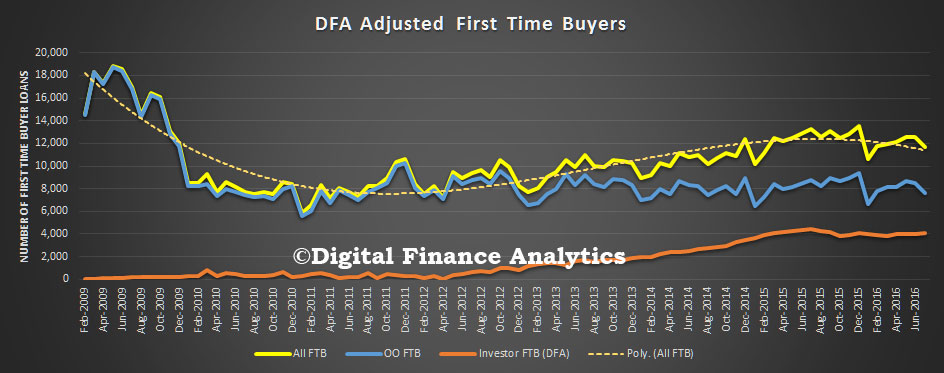
home-lenidng-ftb-july-2016-absA proportion of first time buyers continue to go direct to the investment sector, as shown in the chart below which overlays our survey data on the ABS data-set.

home-lenidng-all-ftb-july-2016-abs


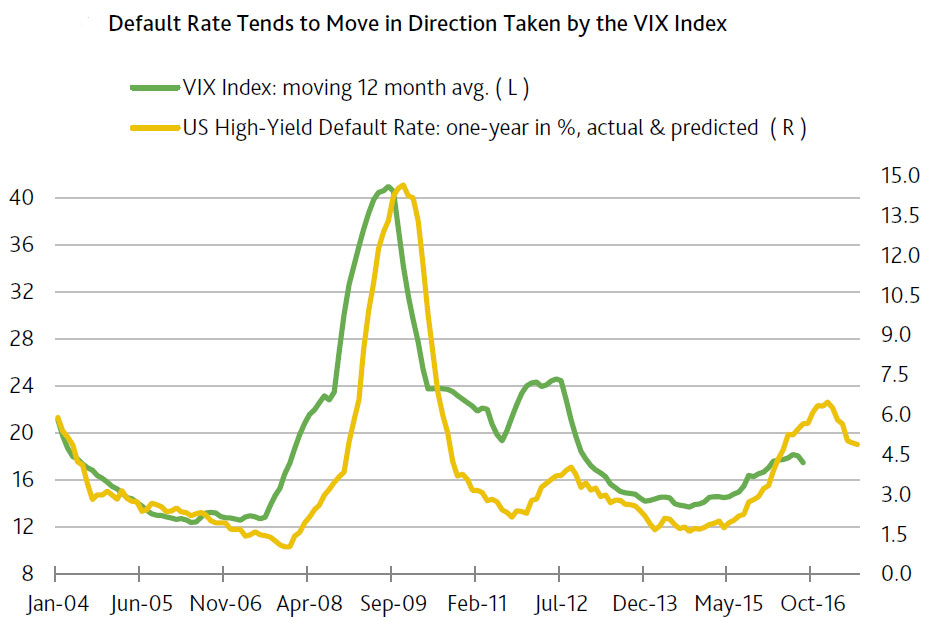
Does VIX Suggest a Lower Default Rate?

According to Moody’s, the US equity market can help divine the path to be taken by the high-yield default rate. However, changes in the market value of US common stock are not the equity market’s primary channel of
prediction. Rather, the VIX index, which estimates the implied volatility of the S&P 500 stock price index over the next 30-day span, offers the more reliable guide to where defaults may be headed.

The VIX index estimates the equity market’s expectation of stock price volatility. As the market becomes more worried over a possible deep sell-off of equities, the VIX index rises. By itself, such fear may reduce financial market liquidity, including the willingness to lend to high-yield credits.

The uncertainty that drives the VIX index higher often stems from signs of an extended stay by weaker corporate earnings. Significantly lower earnings, if not outright losses, will increase defaults among more marginal business credits. Downwardly revised earnings prospects, more frequent defaults, and heightened equity market volatility can only boost risk aversion and, thereby, diminish systemic liquidity.

These adverse developments will add to the difficulty of raising cash via asset sales and will lessen the willingness of healthy companies to purchase financially stressed businesses.

Since year-end 2003, the high-yield default rate has generated a very strong correlation of 0.91 with the moving yearlong average of the VIX index from three months earlier. As opposed to an average measured over a shorter span, the VIX index’s moving yearlong average helps to explain the default rate partly because the default rate is measured over a yearlong span.

vix-sept-2016

As derived from a regression model, the VIX index’s latest moving yearlong average of 17.2 predicts a midpoint of 2.9% for the high-yield default rate of three months hence. Though few, if any, expect the default rate to sink from its recent 5.5% to 2.9% three months from now, the VIX index’s recent trend weighs against an extended climb by the default rate that might distend the already above-trend yield spreads of medium- and speculative-grade corporate bonds.

Nevertheless, the VIX index’s predictive power might now be criticized on the grounds that it has been skewed lower by expectations of a prolonged stay by a very accommodative monetary policy. The equity market may have concluded that the FOMC will not dare risk a deep slide by share prices that could slash confidence and diminish liquidity by enough to bring a quick end to the current business cycle upturn. A recent ultra-low VIX index of 12.1 points suggests that the equity market is supremely confident of monetary policy’s willingness and ability to quickly remedy a potentially disruptive slowdown by business activity.