
Nine News asked me to run some analysis on potential forced property sales, which they ran in Perth, Melbourne and Sydney yesterday. Today I wanted to add some extra detail from our analysis and explain how we established the baseline and share some heat maps for some of the major urban centres.
This is not an exact science, but the input data is from our rolling 52,000 surveys. One element in the survey is intention to transact – either to buy or sell, and the reason to transact. We also of course have cash flow analysis which is used for our regular mortgage stress analysis. For the record stress has risen significantly, as another 200,000 households fell into stress since February (even allowing for the various Government support schemes).
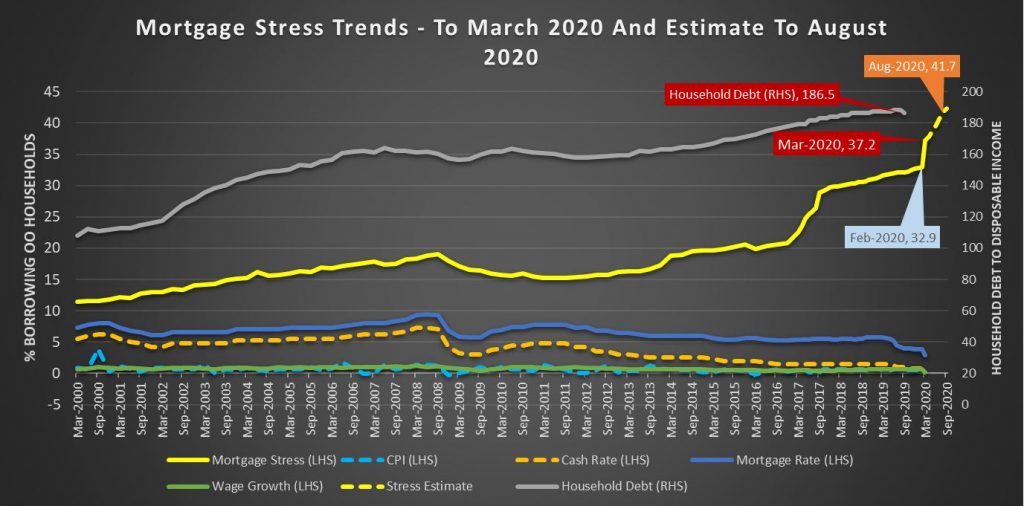
Forced sales are often narrowly defined as those initiated by lenders for debt recovery. The good news is that so far only a small number of these are in train. But the forced sales landscape is wider and is centred on the “fear of not getting out”
Property investors have had issues for a long time with real rentals falling, greater rental supply, and the recent shutting of Airbnb type lets. So for many, they are facing at least significant falls in receipts, or worse vacant property. They are also still dealing with the change of finance arrangements (though these are undone to more lose assessments it seems) and the need to have a repayment plan for the loan. The saving grace was the more recent rises in values, in some areas with houses doing better than units. But the expectation now is for significant property value drops, raising the risk of negative equity, or worse. Our surveys also suggest that some investors are unable, at least so far, to get repayment holidays from lenders. Thus the imperative to sell, even into a falling market explains the reason why we estimate around 8% of property investors are seeking to exit and quickly before values fall further. And some of these do not have mortgages, but simply want to save appreciated paper capital values.
Owner occupied property owners can access the banks’ schemes for repayment deferral more easily, though this appears subject to specific terms and conditions and some need to provide evidence of the health crisis impacting their finances. Many are going to ride out the current property cycle fall, though those with higher mortgages (including the 95% first time buyer schemes) will face the real prospect of the negative equity trap. But only about 2% of households are looking to sell under the current duress.
We are already seeing a rise in property listings across the country.
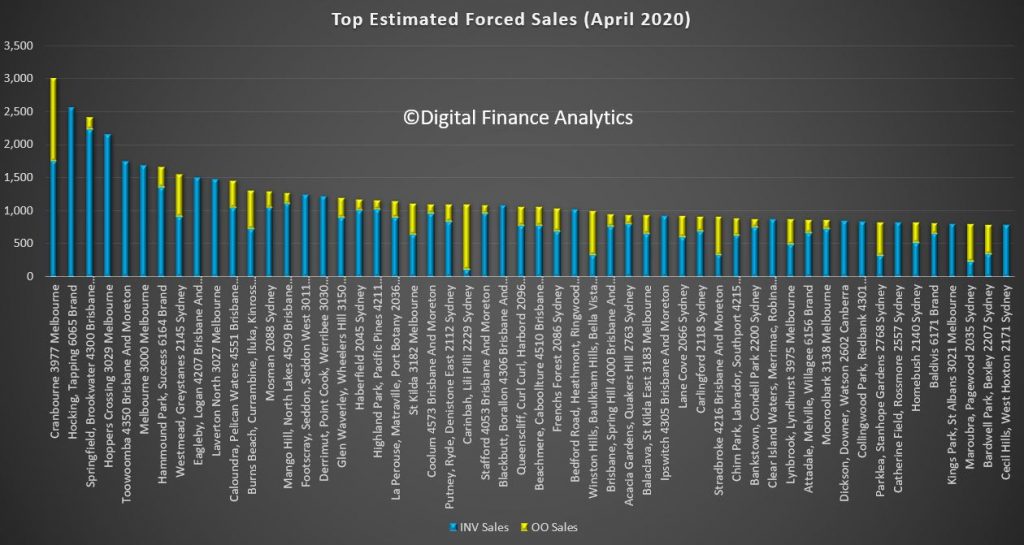
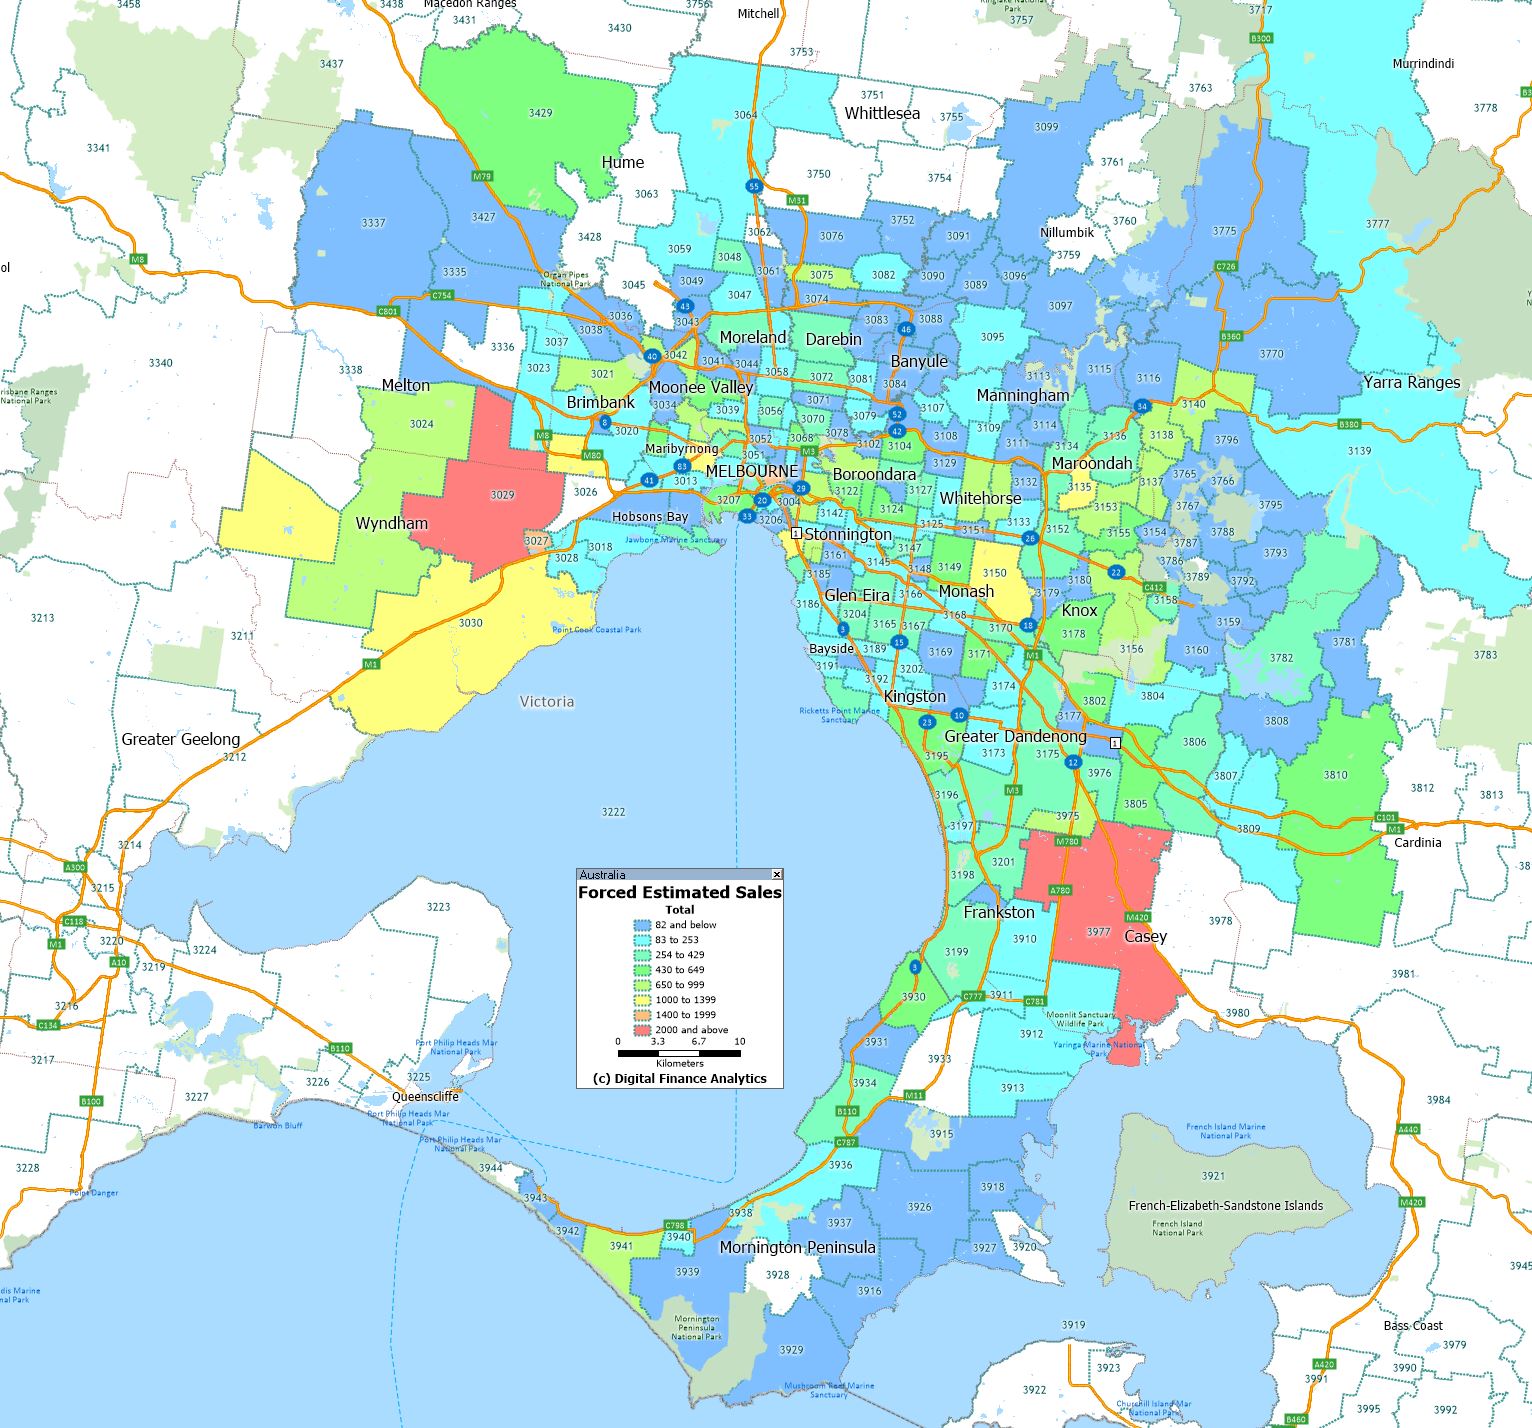
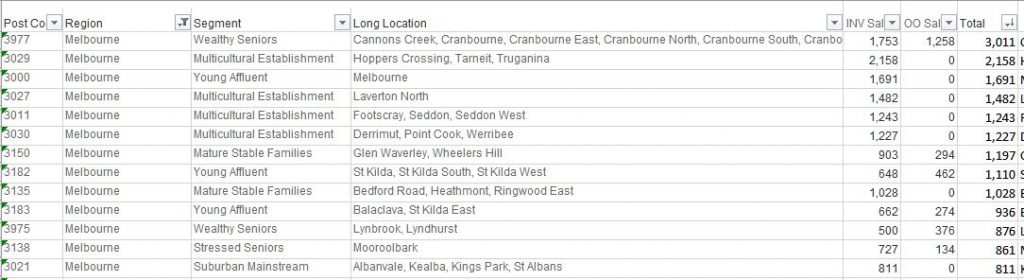
We have completed the analysis for some of the major urban centres, and the results are revealing. The post code with the largest number of potential forced sales in 3977, Cranbourne in Victoria. Here around 3,000 households are caught, with around 1,750 being property investors and 1,258 owner occupiers. Those following our modelling will recognise this post code as one of our most stressed, driven by high levels of new developments and recent purchases, by households who had above average incomes. Many new migrants live in the areas too.
Another new development area on the outskirts of Perth is second post code, 6065, which includes Hocking and Tapping, are next, with 2,500 investment properties likely to be up for forced sale.
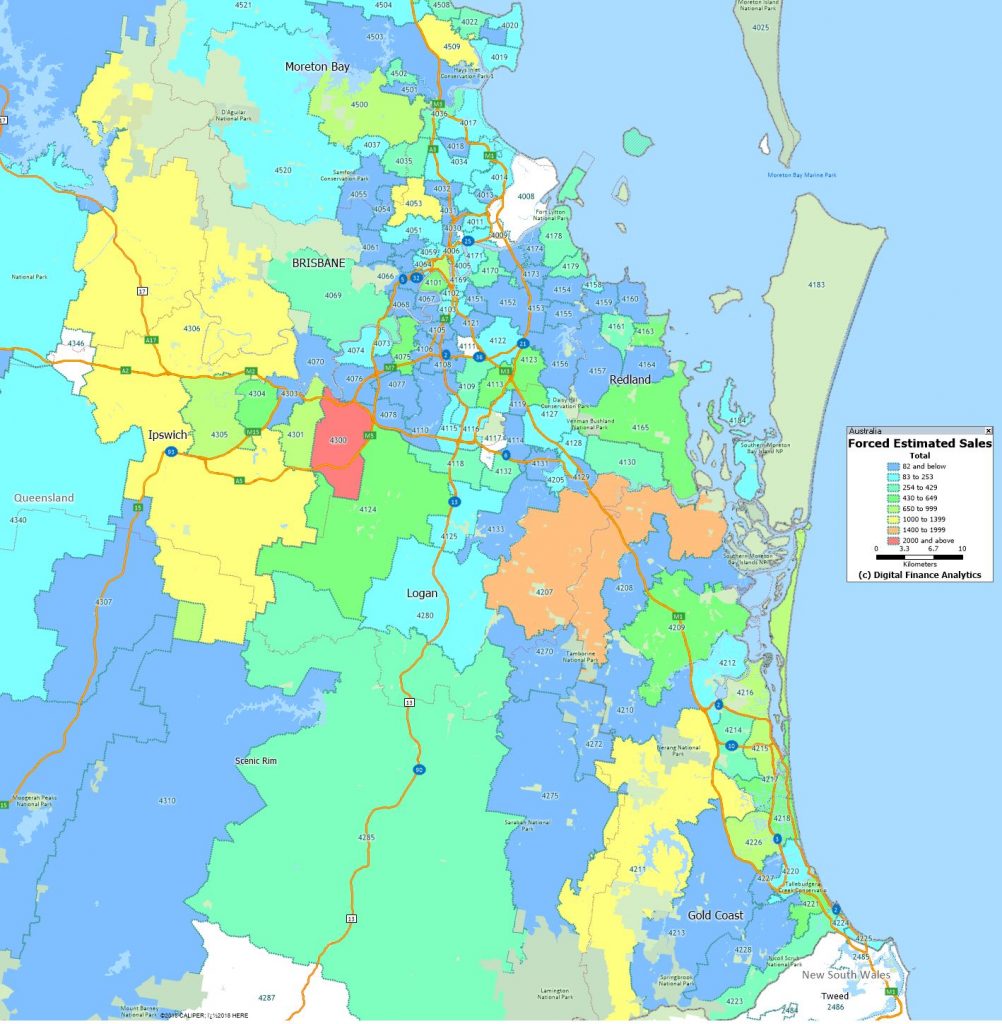
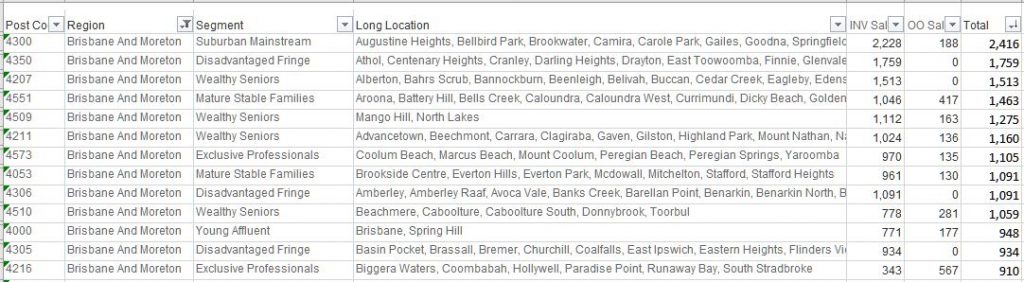
Third on the list is Brisbane postcode 4300, which includes Brookwater and Springfield, with 2,220 investors seeking to exit and 190 owner occupiers.
Next is 4350, around Toowoomba, another high stress district, 1,780 property investors now looking to get out.
Fifth is central Melbourne 3000, with 1,690 property investors, almost exclusively in the high-rise sector of the market.
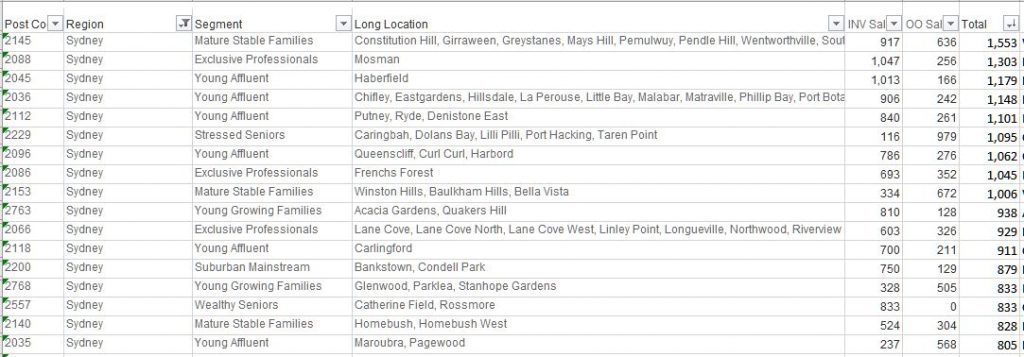
Sixth is 6164, in Perth, covering the areas around Success and Hammond Park, with 1,360 property investors and 309 owner occupied; and seventh is Sydney post code 2145, which includes Westmead and Greystanes with 920 property investors and 640 owner occupiers.
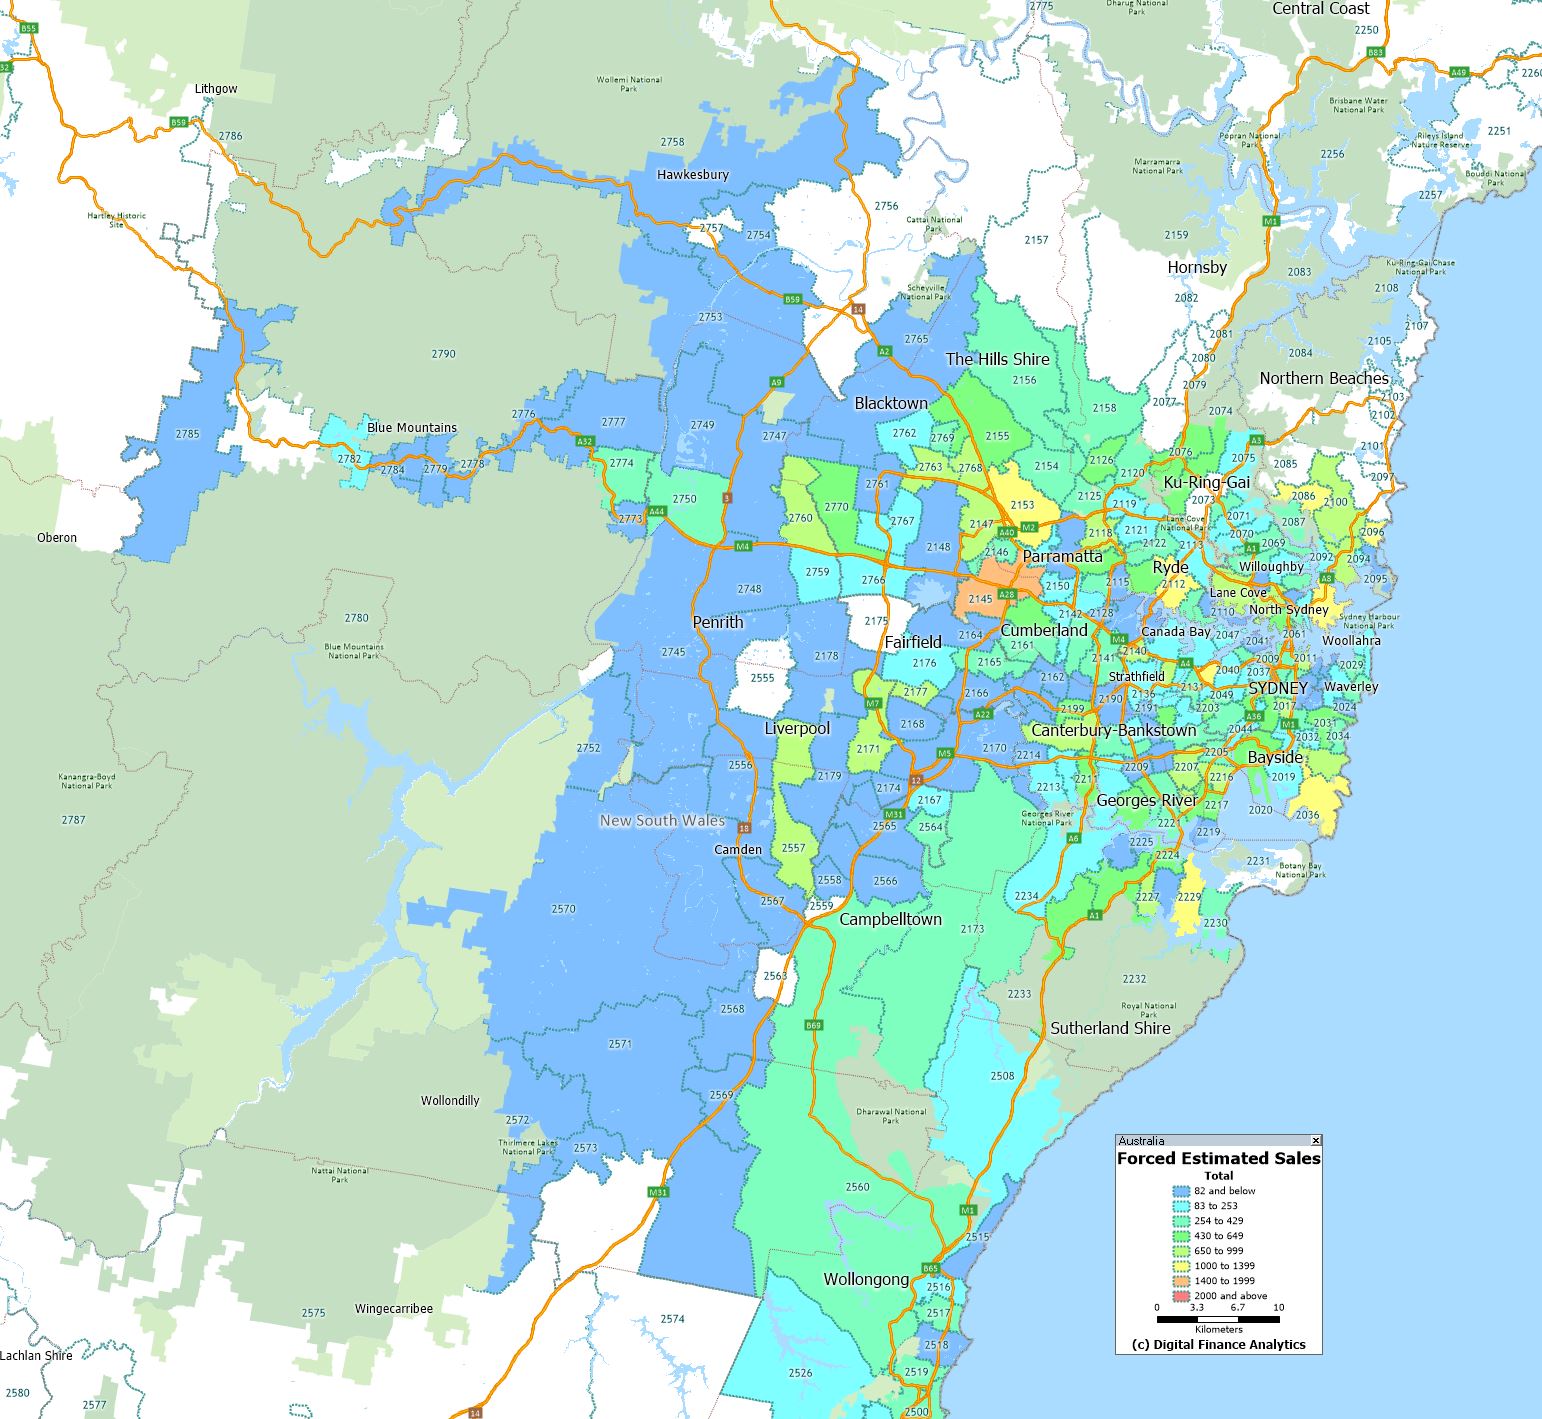
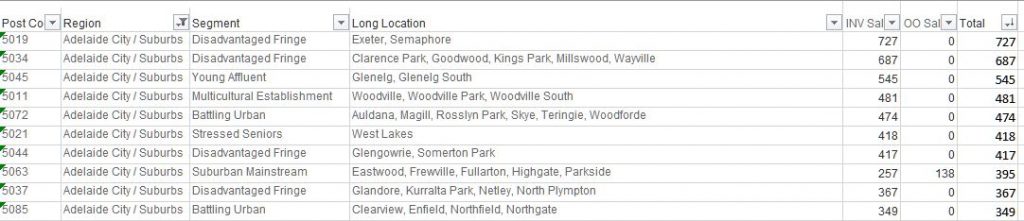
We have mapped each of the main geographies, and listed the top post codes in each state.
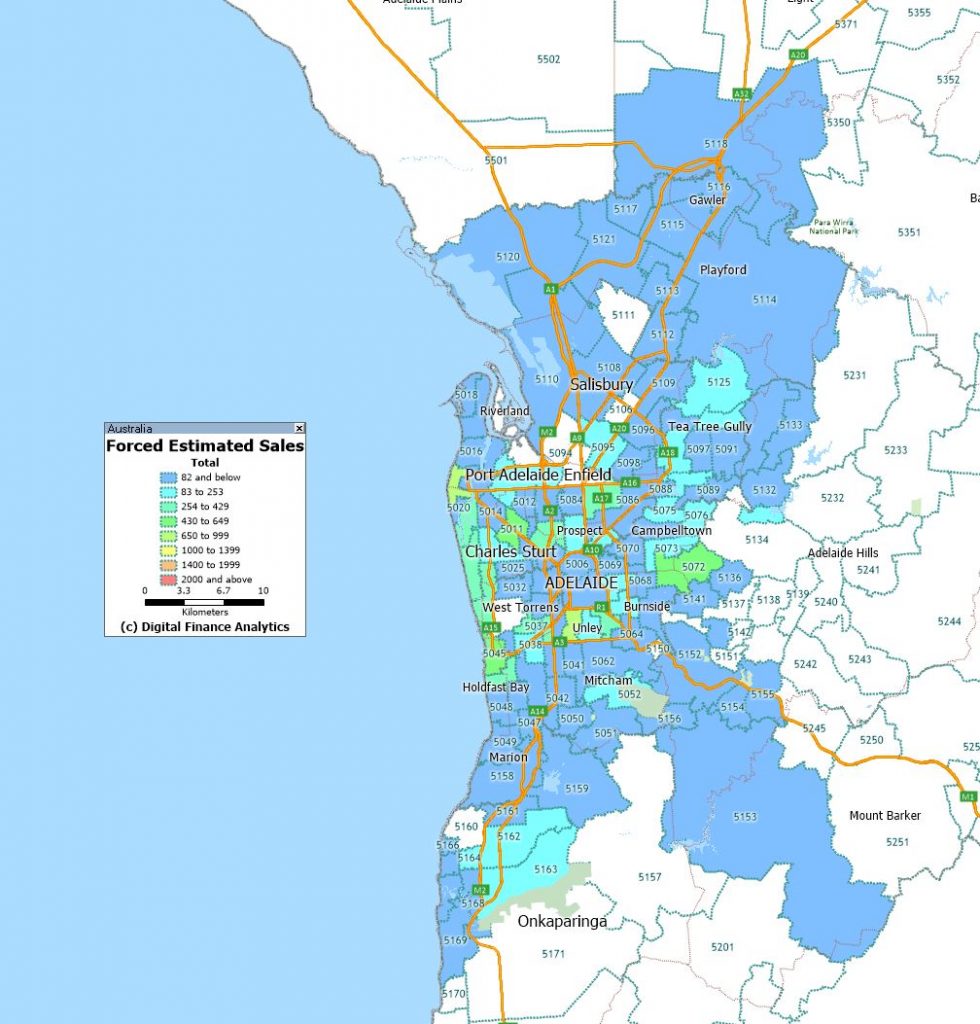
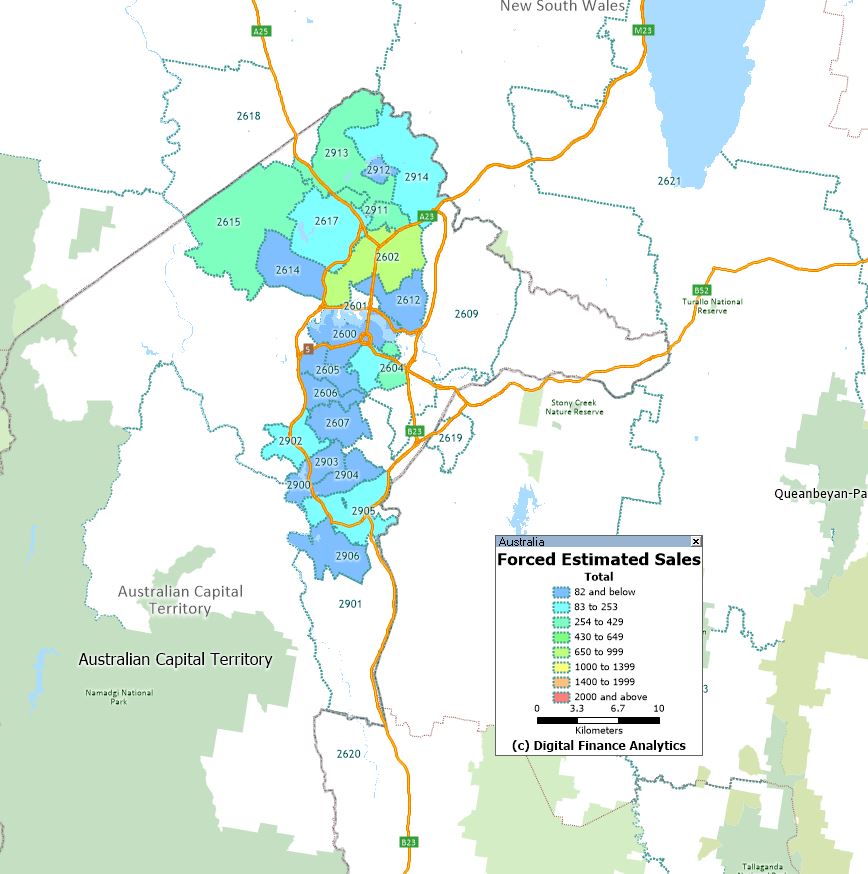
We will run the analysis again next month and see what trends are emerging.