The RBA released their Financial Stability report today, and even with the rose tinted RBA glasses there are a number of worrying issues touched on. Though none new. But their analysis of negative equity is over optimistic. So we will look at what they say, and highlight some additional considerations.
The RBA said:
Domestic economic conditions remain broadly supportive of financial stability. The unemployment rate has remained around 5 per cent since the previous Review and corporate profit growth has also been strong.
However, GDP growth in Australia also slowed in the second half of 2018. In particular, consumption growth eased and the outlook for consumption is uncertain.
Conditions in the housing market remain weak. Nationally, housing prices are 7 per cent below their late 2017 peak, although they are still almost 30 per cent higher since the start of 2013.
Growth in housing credit was slightly lower over the six months to February than the preceding half year, with investor credit hardly growing at all.
Nationally, falling housing prices have been driven by weaker demand and increased housing supply. The tightening in the supply of housing credit from improved lending standards has played a smaller part. Importantly, these more rigorous lending standards have seen the quality of new loans improve in recent years.
Measures of financial stress among households are generally low and households remain well placed to service their debt given low unemployment, low interest rates and improvements to lending standards. However, there has been an increase in housing loan arrears rates. The increase in arrears has been largest in Western Australia, where the decline in mining related activity has seen housing prices fall for nearly five years and unemployment increase.
They did in “deep dive” on negative equity using their securitised loan data.
Large housing price falls in parts of Australia mean some borrowers are facing negative equity – where the outstanding balance on the loan exceeds the value of the property it is secured against. Negative equity creates vulnerabilities both for borrowers and lenders. A borrower having difficulty making loan repayments who has negative equity cannot fully repay their debt by selling the property. Negative equity also implies that banks are likely to bear losses in the event that a borrower defaults. Evidence from Australia and abroad suggests that borrowers who experience an unexpected fall in income are more likely to default if their loan is in negative equity.
At present, the incidence of negative equity remains low. Given the large increases in housing prices that preceded recent falls and the decline
in the share of mortgages issued with high loan to- valuation ratios (LVRs), housing prices would need to fall significantly further for negative equity to become widespread. However, even if this did occur, increased defaults would be unlikely if the unemployment rate remains low, particularly given the improvements in loan serviceability standards over recent years.
Estimating the share of borrowers with negative equity requires data on current loan balances and property values. The RBA’s Securitisation Dataset
contains the most extensive and timely data on loan balances and purchase prices.
The Securitisation Dataset includes about one-quarter of the value of
all residential mortgages, or around 1.7 million mortgages.

This data can be combined with regional data on housing price movements to estimate the share of loans that are currently in negative equity. This
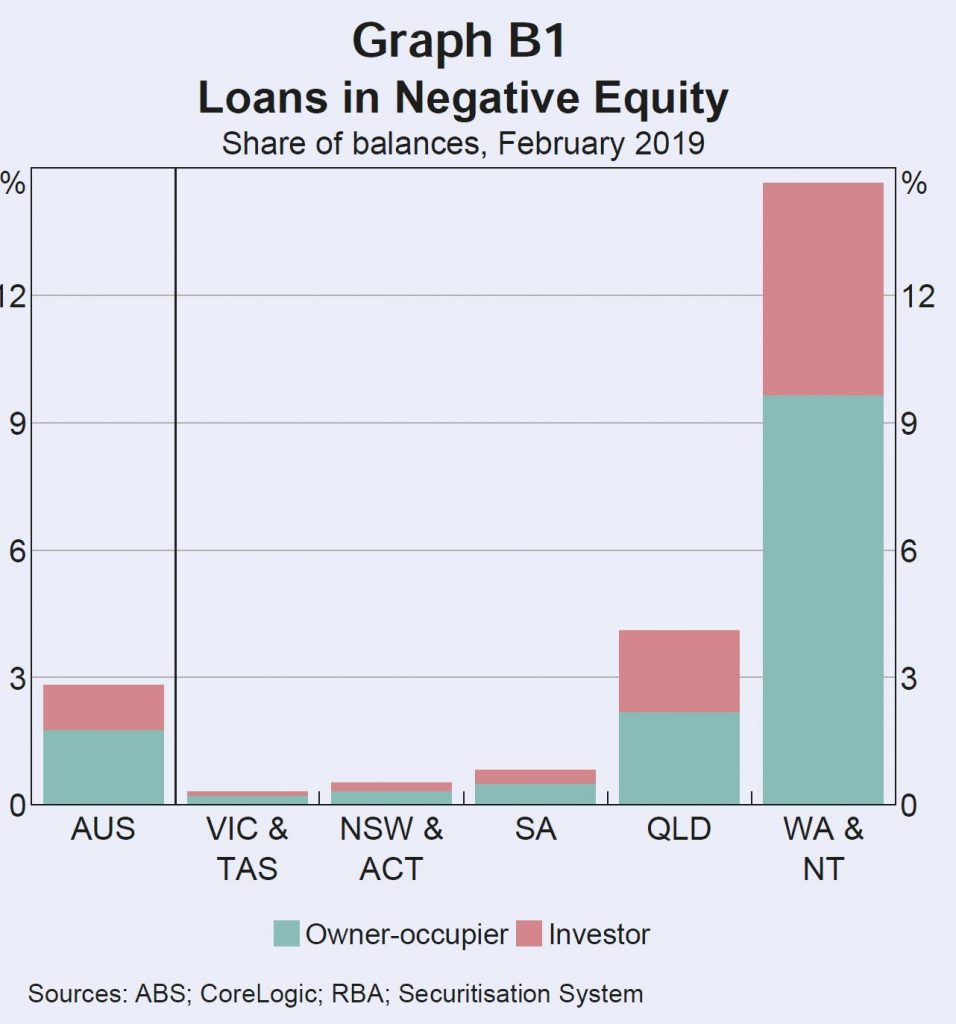
suggests that nationally, around 2¾ per cent of securitised loans by value are in negative equity (just over 2 per cent of borrowers). The highest
rates of negative equity are in Western Australia, the Northern Territory and Queensland, where there have been large price falls in areas with
high exposure to mining activity. Almost 60 per cent of loans in with negative equity are in Western Australia or the Northern Territory. Rates
of negative equity in other states remain very low.
Estimates of negative equity from the Securitisation Dataset may, however, be under or overstated. They could be understated because securitised loans are skewed towards those with lower LVRs at origination. In contrast, the higher prevalence of newer loans in the dataset compared to the broader population of loans, and not being able to take into account capital improvements on values, will work in the other direction. Some private surveys estimate closer to 10 per cent of mortgage holders are in negative equity. However, these surveys are likely to be an overestimate for a number
of reasons; for instance, by not accounting for offset account balances.
DFA Says: Of course DFA estimates 10% of households in negative equity, after taking offset balances into account, and also adding in the current forced sale value of the property and transaction costs.
Information from bank liaison and estimates based on 2017 data from the Household Incomes and Labour Dynamics of Australia (HILDA) survey suggest rates of negative equity are broadly in line with those from the
Securitisation Dataset.
DFA Says: The HILDA data is at least 2 years old, so before the recent price falls – so this set will understate the current position.
The continuing low rates of negative equity outside the mining exposed regions reflect three main factors: the previous substantial increases in housing prices; the low share of housing loans written at high LVRs; and the fact that many households are ahead on their loans, having accumulated extra principal payments.
Housing prices in some areas of Sydney and Melbourne have fallen by upwards of 20 per cent from their peak in mid to late 2017. But only a small share of owners purchased at peak prices, and many others experienced
price rises before property prices began to fall. Properties purchased in Sydney and Melbourne since prices peaked account for around 2 per cent of the national dwelling stock. Looking further back, properties purchased in these two cities since prices were last at current levels still only account for
around 4½ per cent of the dwelling stock.
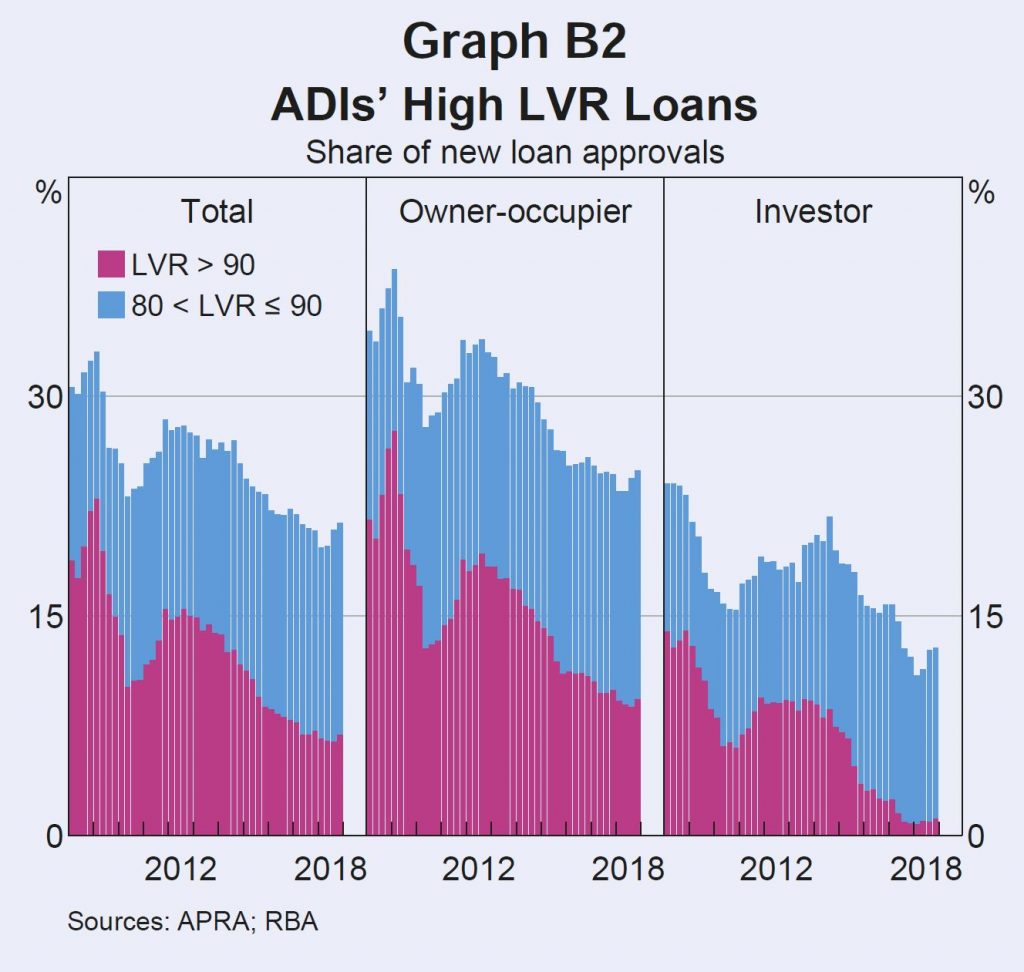
Few recent borrowers had high starting LVRs. Over the past five years, the share of loans issued by ADIs with LVRs above 90 has roughly halved. Since 2017, it has averaged less than 7 per cent (Graph B2). Around 80 per cent of ADI loans are issued with an LVR of 80 or less. Around 15 per cent of owner-occupier borrowers and 20 per cent of investors take out a loan with a starting LVR of exactly 80.

Given most borrowers do not have high starting LVRs, housing price falls need to be large for widespread negative equity. Only 15 per cent of regions have experienced price declines of 20 per cent or more from their peaks. Around 90 per cent of these regions are in Western Australia, Queensland and the Northern Territory.
If a borrower has paid off some of their debt, then price declines will need to be larger still for them to be in negative equity. Most borrowers have principal and interest loans that require them to pay down their debt and
many borrowers are ahead of their repayment schedule. Around 70 per cent of loans are estimated to be at least one month ahead of their repayment schedule, with around 30 per cent ahead by two years or more.
When a borrower is behind on repayments and their loan is in negative equity, banks classify the loan as ‘impaired’. Banks are required to raise provisions against potential losses from impaired loans through ‘bad
and doubtful debt’ charges. Currently the proportion of impaired housing loans is very low, at 0.2 per cent of all residential mortgages, despite having increased of late (Graph B3).

Queensland, Western Australia and the Northern Territory together account for around 90 per cent of all mortgage debt in negative equity. These states have regions that experienced large and persistent housing price falls over several years.
This has often been coupled with low income growth and increases in unemployment, which have reduced the ability of borrowers to pay
down their loans. Loans currently in negative equity were, on average, taken out around five years ago and had higher average LVRs at origination,
of around 85 per cent. This made them particularly susceptible to subsequent falls in property values. Investment loans are also disproportionately represented, despite typically having lower starting LVRs than owner-occupier loans. Investors are more likely to take out
interest-only loans in order to keep their loan balance high for tax purposes. Around 10 per cent of loans in negative equity have interest only
terms expiring in 2019, which is double the share for loans in positive equity. For these borrowers, the increase in repayments from moving to principal and interest may be difficult to manage, especially as loans in negative equity are already more likely to be in arrears. Having more borrowers in this scenario is distressing for the borrowers themselves and for the communities they live in. However, it is unlikely to represent a risk to broader financial stability given it remains largely restricted to mining-exposed regions, which represent a very small share of total mortgage debt.
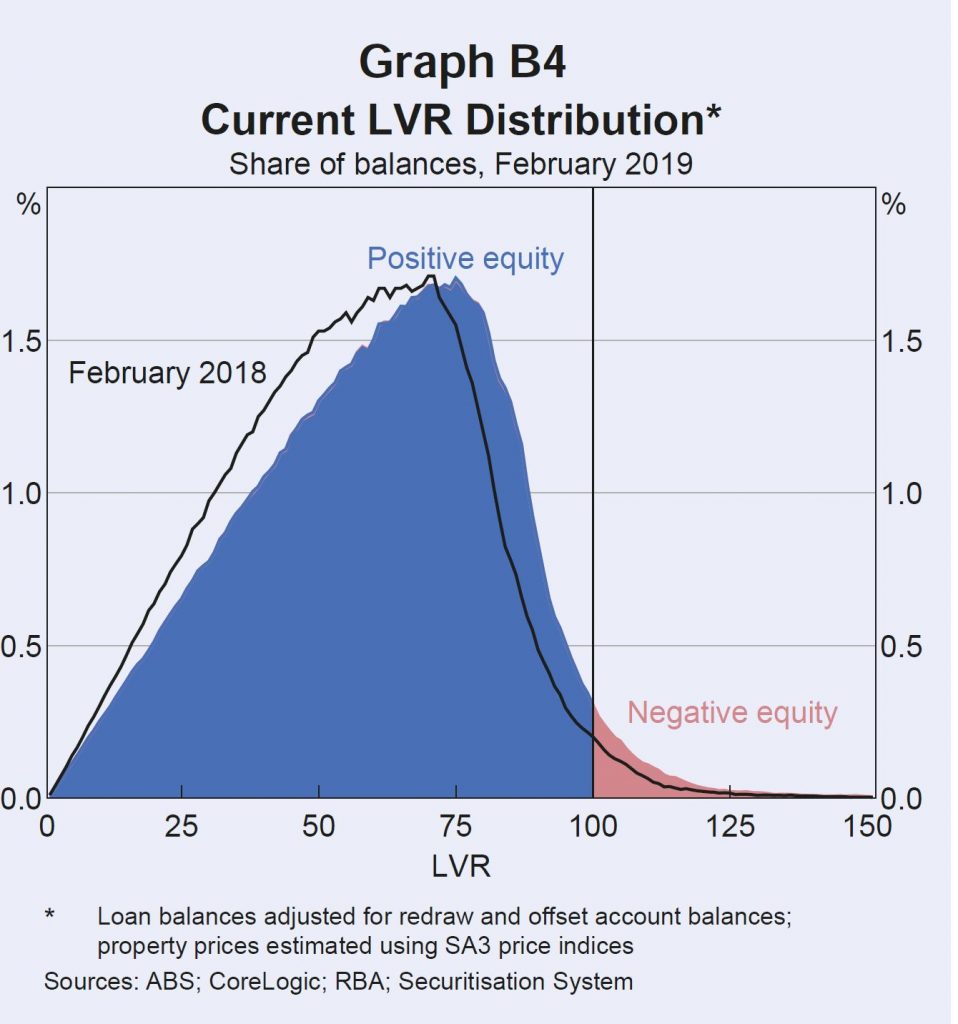
Continued housing price falls would be expected to increase the incidence of negative equity, particularly if they affect borrowers with already high LVRs. Around 11/4 per cent of loans by number (and 13/4 per cent of loans by value) have a current LVR between 95 and 100, making them likely to move into negative equity if there are further housing price falls (Graph B4).

However, compared to the international experience with negative equity during large property downturns, the incidence of negative equity in
Australia is likely to remain low. Negative equity peaked in the United States at over 25 per cent of mortgaged properties in 2012 and in Ireland
it exceeded 35 per cent, as peak to trough price falls exceeded 30 and 50 per cent respectively.
However, high origination LVRs were far more common in these countries than they have been in Australia.
DFA Says: Except we know there were high levels of mortgage fraud and incorrect data supporting loan applications. Higher than in Ireland.
Even if negative equity was to become more common in the larger housing markets of Sydney and Melbourne, impairment rates for banks are unlikely to increase significantly while unemployment and interest rates remain low.
DFA Says: you need to get post code granular to see what is going on. As our earlier heat map showed.
