As we reported yesterday mortgage stress continues on a high plateau, helped by the recent rate cuts and tax refunds, but still driven by low wages growth and rising living costs, plus large mortgages.
We are often asked for the mapping to post code level as we of course hold data at that granular level. But we need to consider how to map. We could, and often do, show the relative count of stressed households across the country. Using this method, large population centres would register the highest counts.
But others ask for a percentage of households in a given post code. This can get tricky, because there are regions with low population counts, and given our surveys represent 0.5% of the population, low counts might become statistically inaccurate.
So this month we have generated a series of maps, based on the proportion of borrowing households – but we excluded postcodes with less than 200 borrowing households to avoid potential distortions.
With that said here are the maps, which are uploaded in full resolution, for people who want to go into some of the detail.
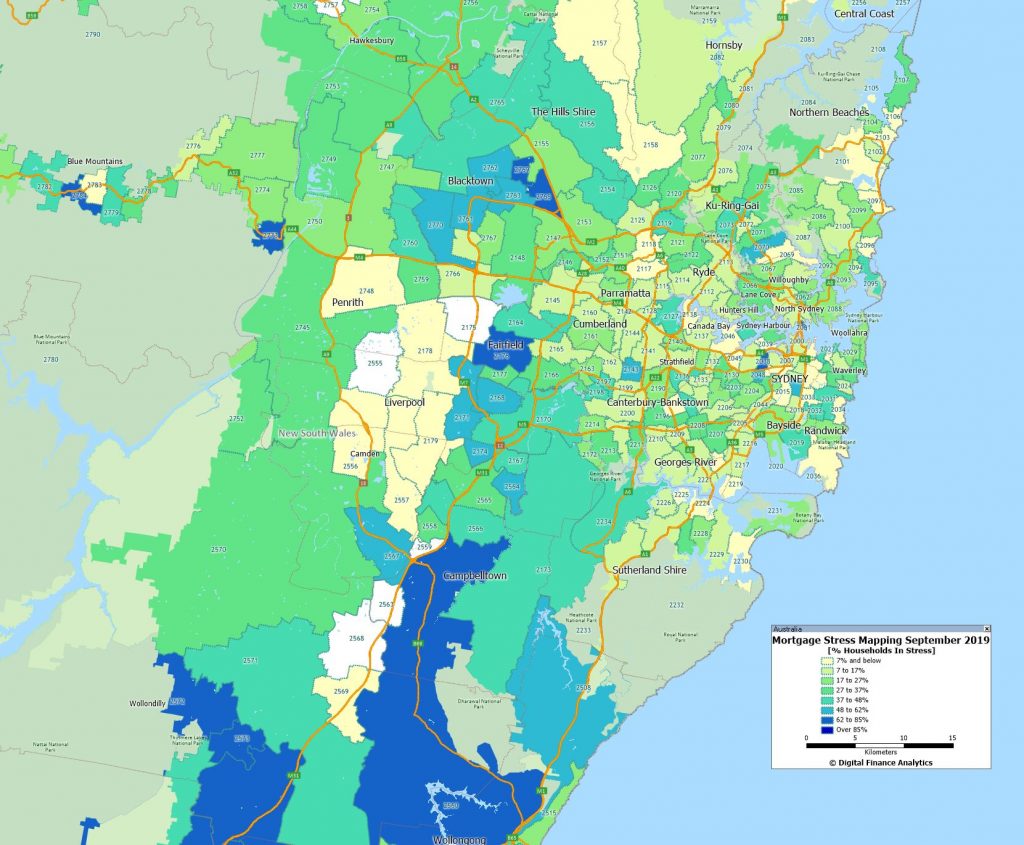
Sydney Stress September 2019
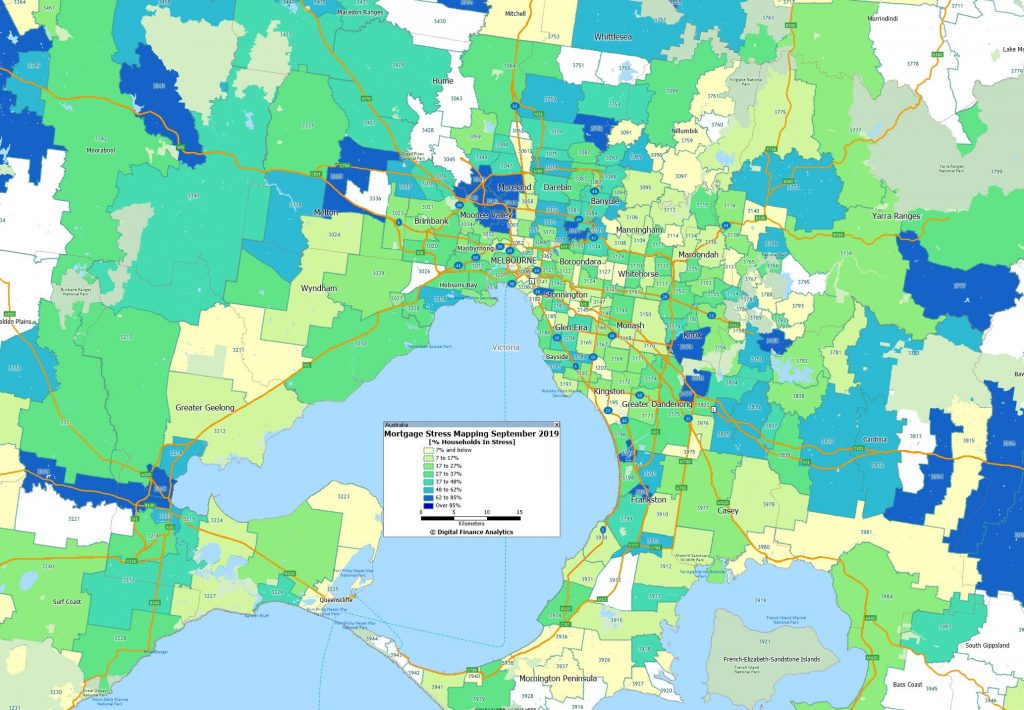
Melbourne Stress September 2019
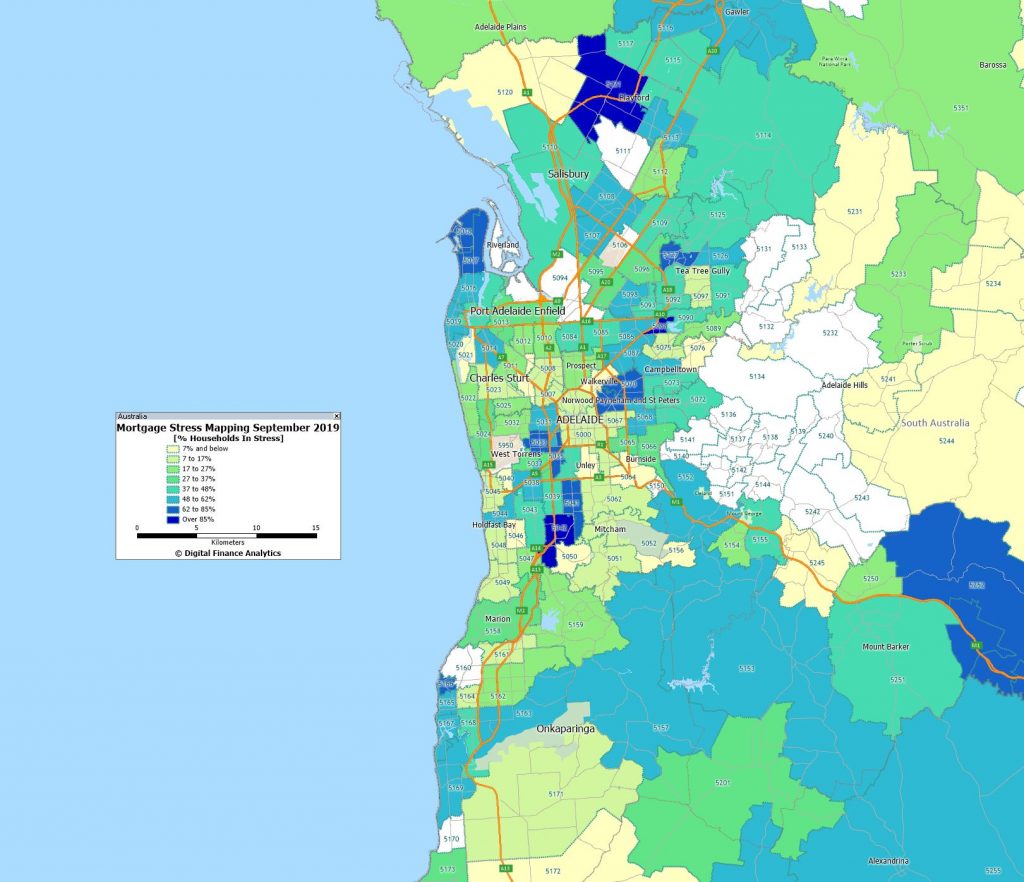
Adelaide Stress September 2019
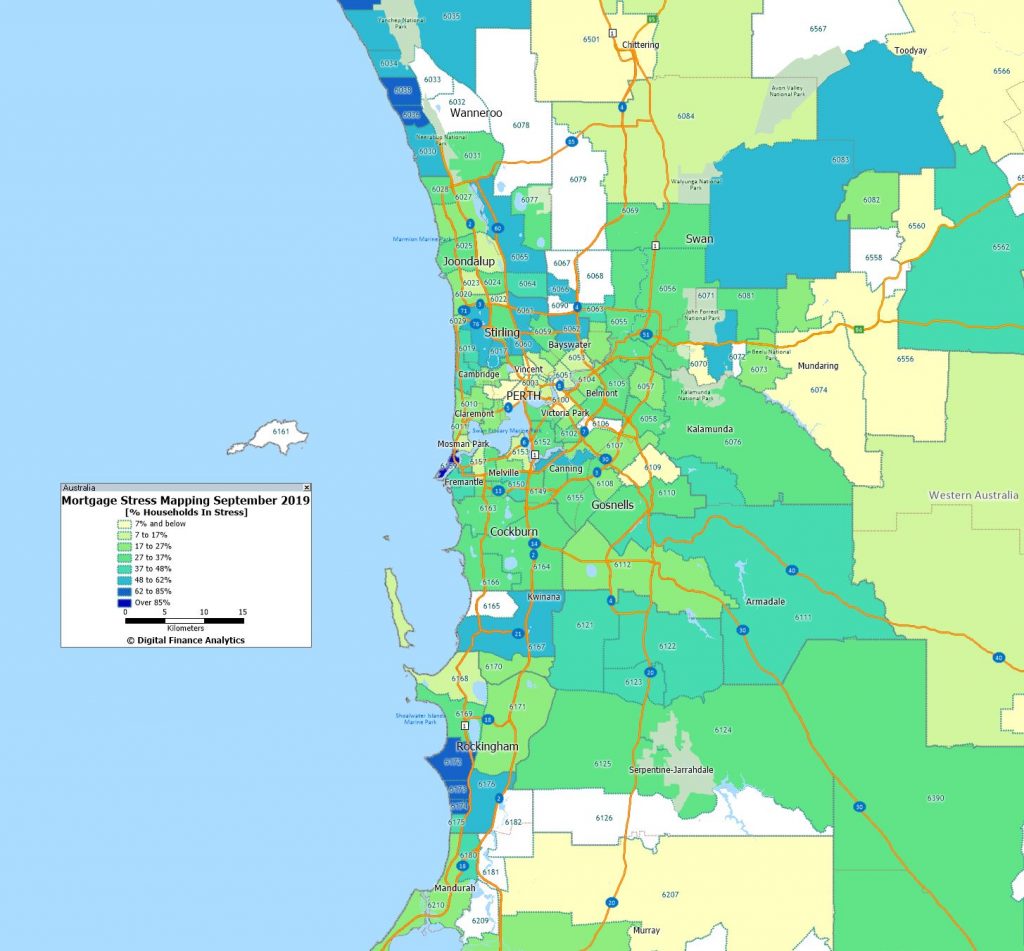
Perth Stress September 2019
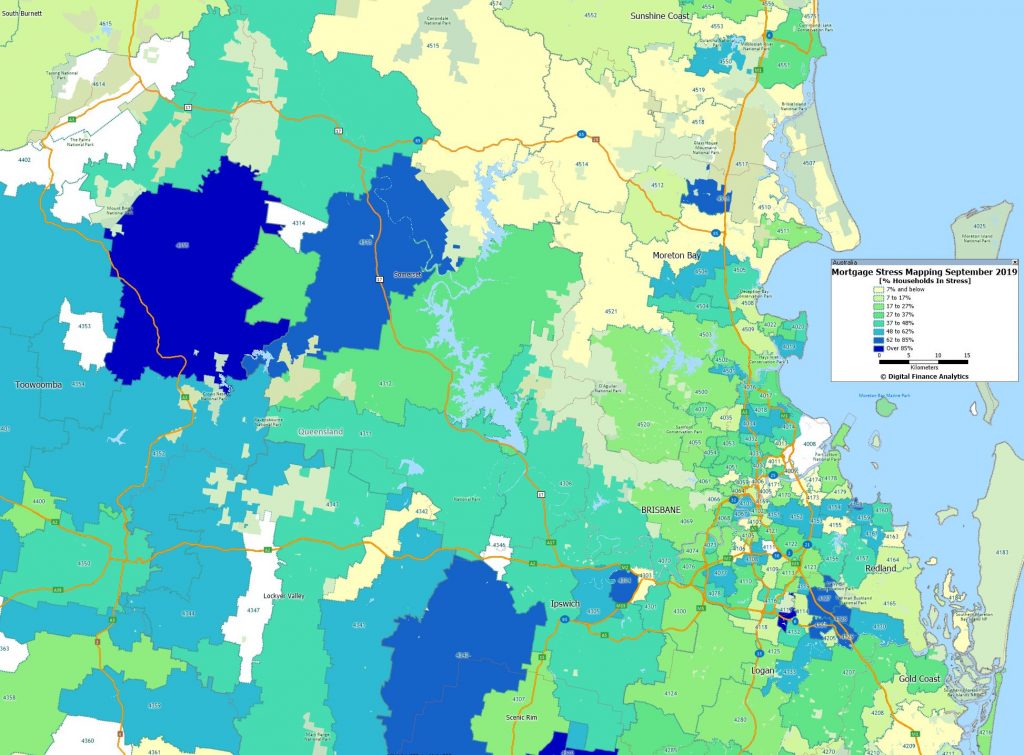
Brisbane Stress September 2019
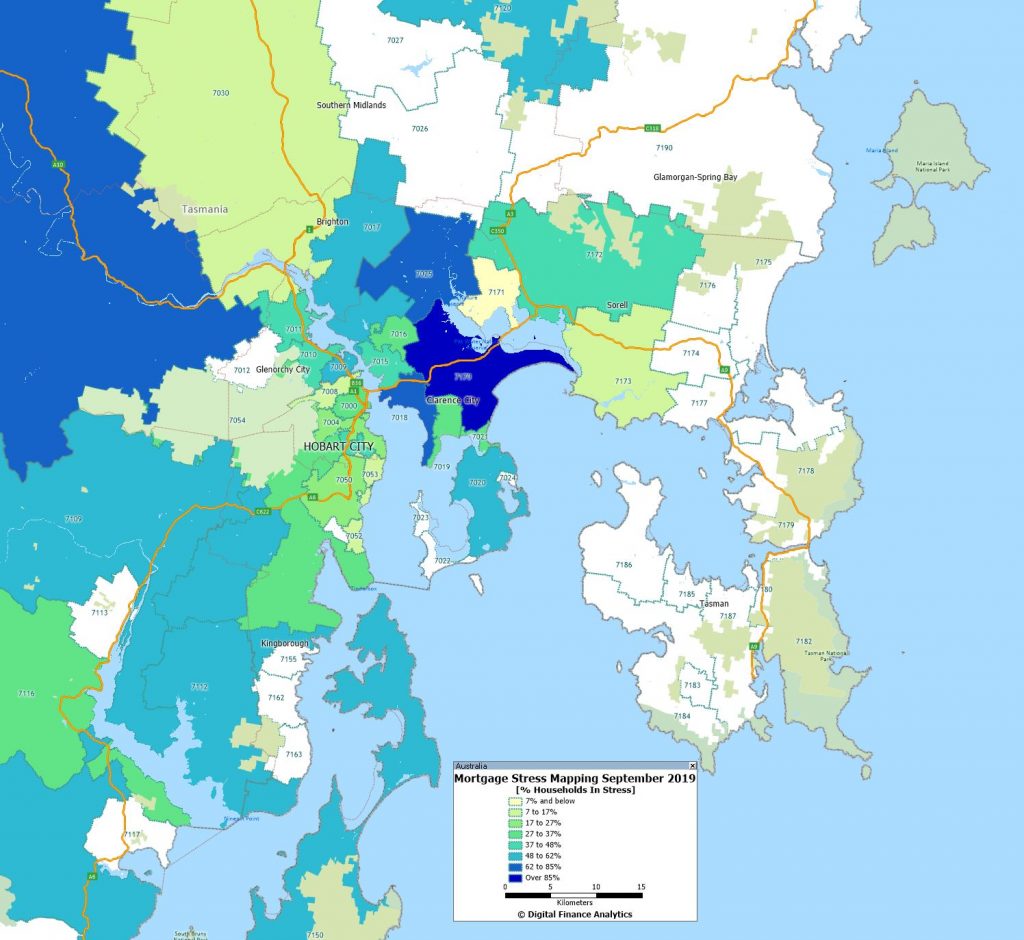
Hobart Stress September 2019
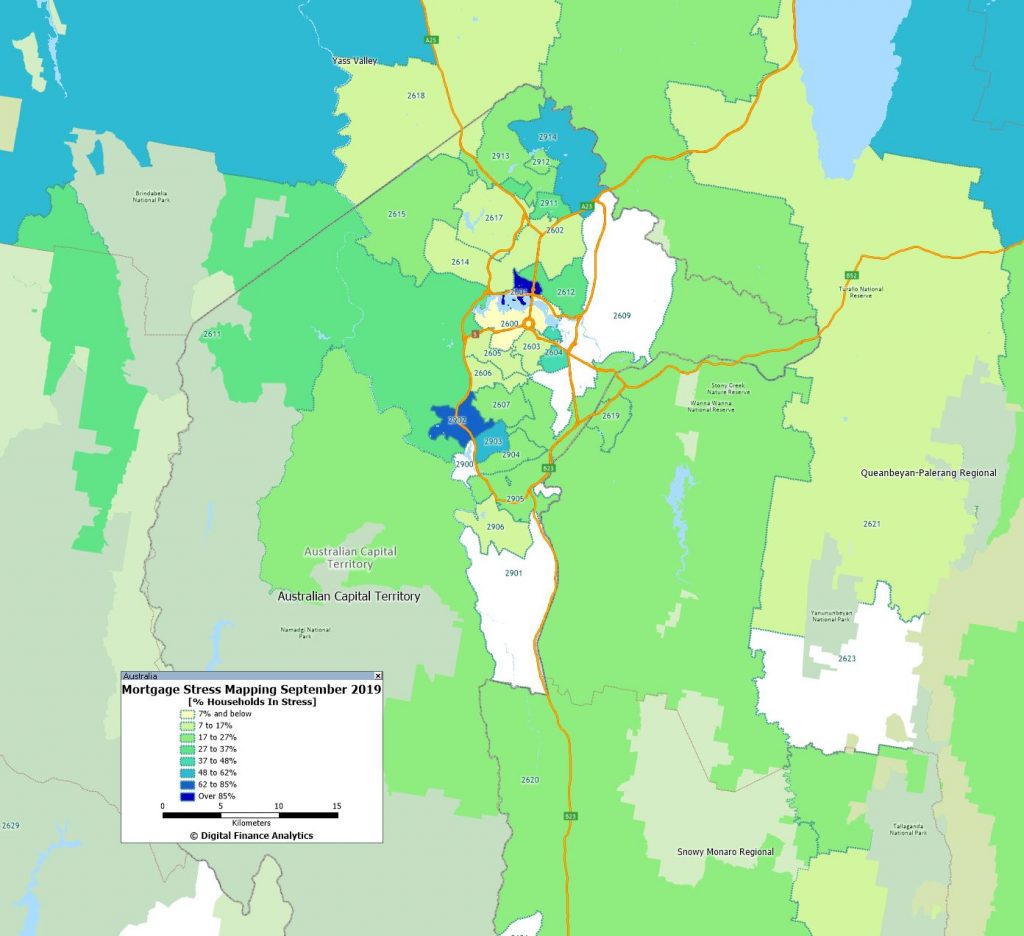
Canberra Stress September 2019
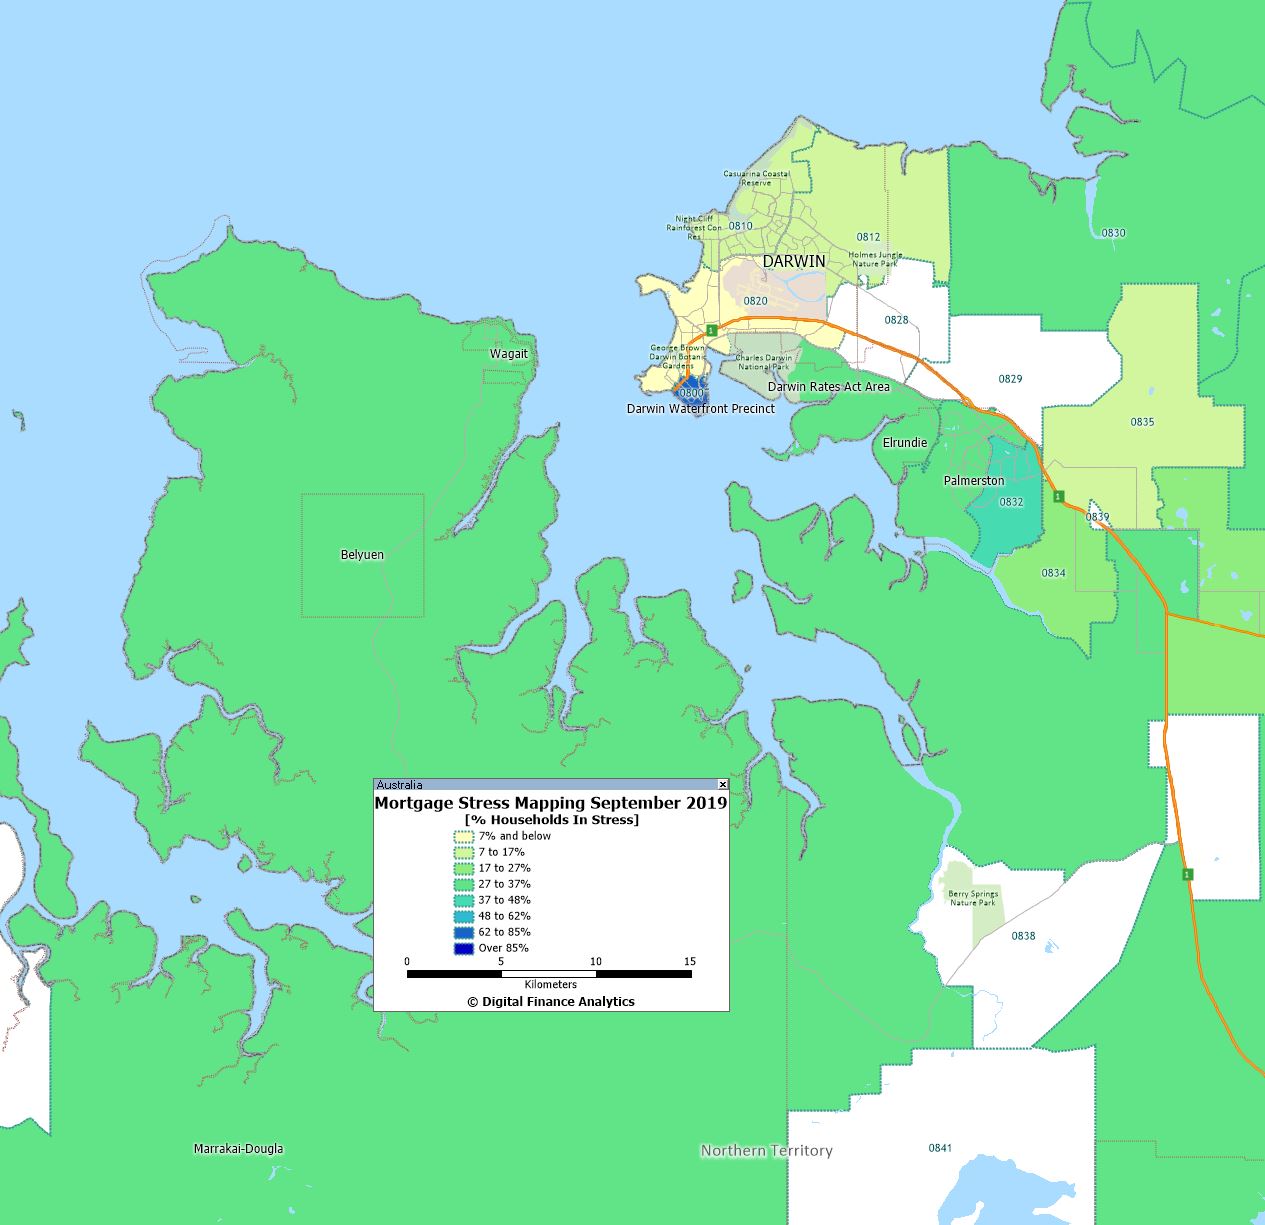
Darwin Stress September 2019
Our earlier post explains our definitions and approach to evaluating mortgage stress.

– Had another good look at the maps and compared that with other maps (Mortage Stress & Negative Equity). It turns out that the postcodes surrounding Blacktown (postcode 2148) do have a high(-er) score in both maps (MS & NE) but when I look at the % then that region seems to be doing a (tiny) little better.
– The only pattern I can find in Melbourne is that suburbs in the south east (surrounding Monash) are doing (fairly) well. Otherwise it seems to be a “hodge podge” without a consistent pattern.
– A closer look at Perth suggests that central and western Perth are actually doing (a bit) worse (on a % basis) than the other maps suggest (with Negative Equity & Mortgage Stress).
– I thought that stress in Liverpool would be somewhere in the “middle of the range” (percentage wise) but it turns out that stress in Liverpool (in % terms) is surprisingly low. Although some postcodes that are directly east of Liverpool do have (much) higher stress % (e.g. Fairfield) than Liverpool itself. Are these postcodes with a (more) rural character ? Are these postcodes suffering from the drougth in NSW ?
– I also would have thought that in the eastern suburbs of Sydney there would have been one or two postcodes that would have stood out like a sore thumb. But the mortgage stress seems to be fairly evenly spread out over there.
More thoughts on the Sydney map:
– I thought that the socalled “latte line” (the A6 highway that runs from Heathcote in the south to(wards) Ryde and farther north) would have been “more divisive”. On average houses on the west of that line are priced below AUD one million and the houses on the east side of that line are at or above AUD 1 million. I would have thought that the postcodes west of that line would show a (much) higher % than households east of that line. It seems to me that the differences are much smaller (in %) that I would have expected.
– But higher houseprices also mean higher mortgages and therefore households living on the east side of that “latte line” should also fear MORE the day that interest rates start to go higher/ballistic. (think: “Affluent Mortgage/Financial Stress”)
– Hobart suddenly doesn’t seem to stand out in a positive way anymore.
– The picture of postcodes in and surrrounding Perth – more or less – confirms the overall mortgage stress picture in W.A. compared to previous (stress) maps.
– It seems that stress in rural postcodes is also (comparatively) surprisingly high, especially in NSW.
– Thanks for the efforts !!!! Interesting maps !!!
– Are there things displayed in these maps that have shed a different light on the overall mortgage stress picture ? Any surprises ?