
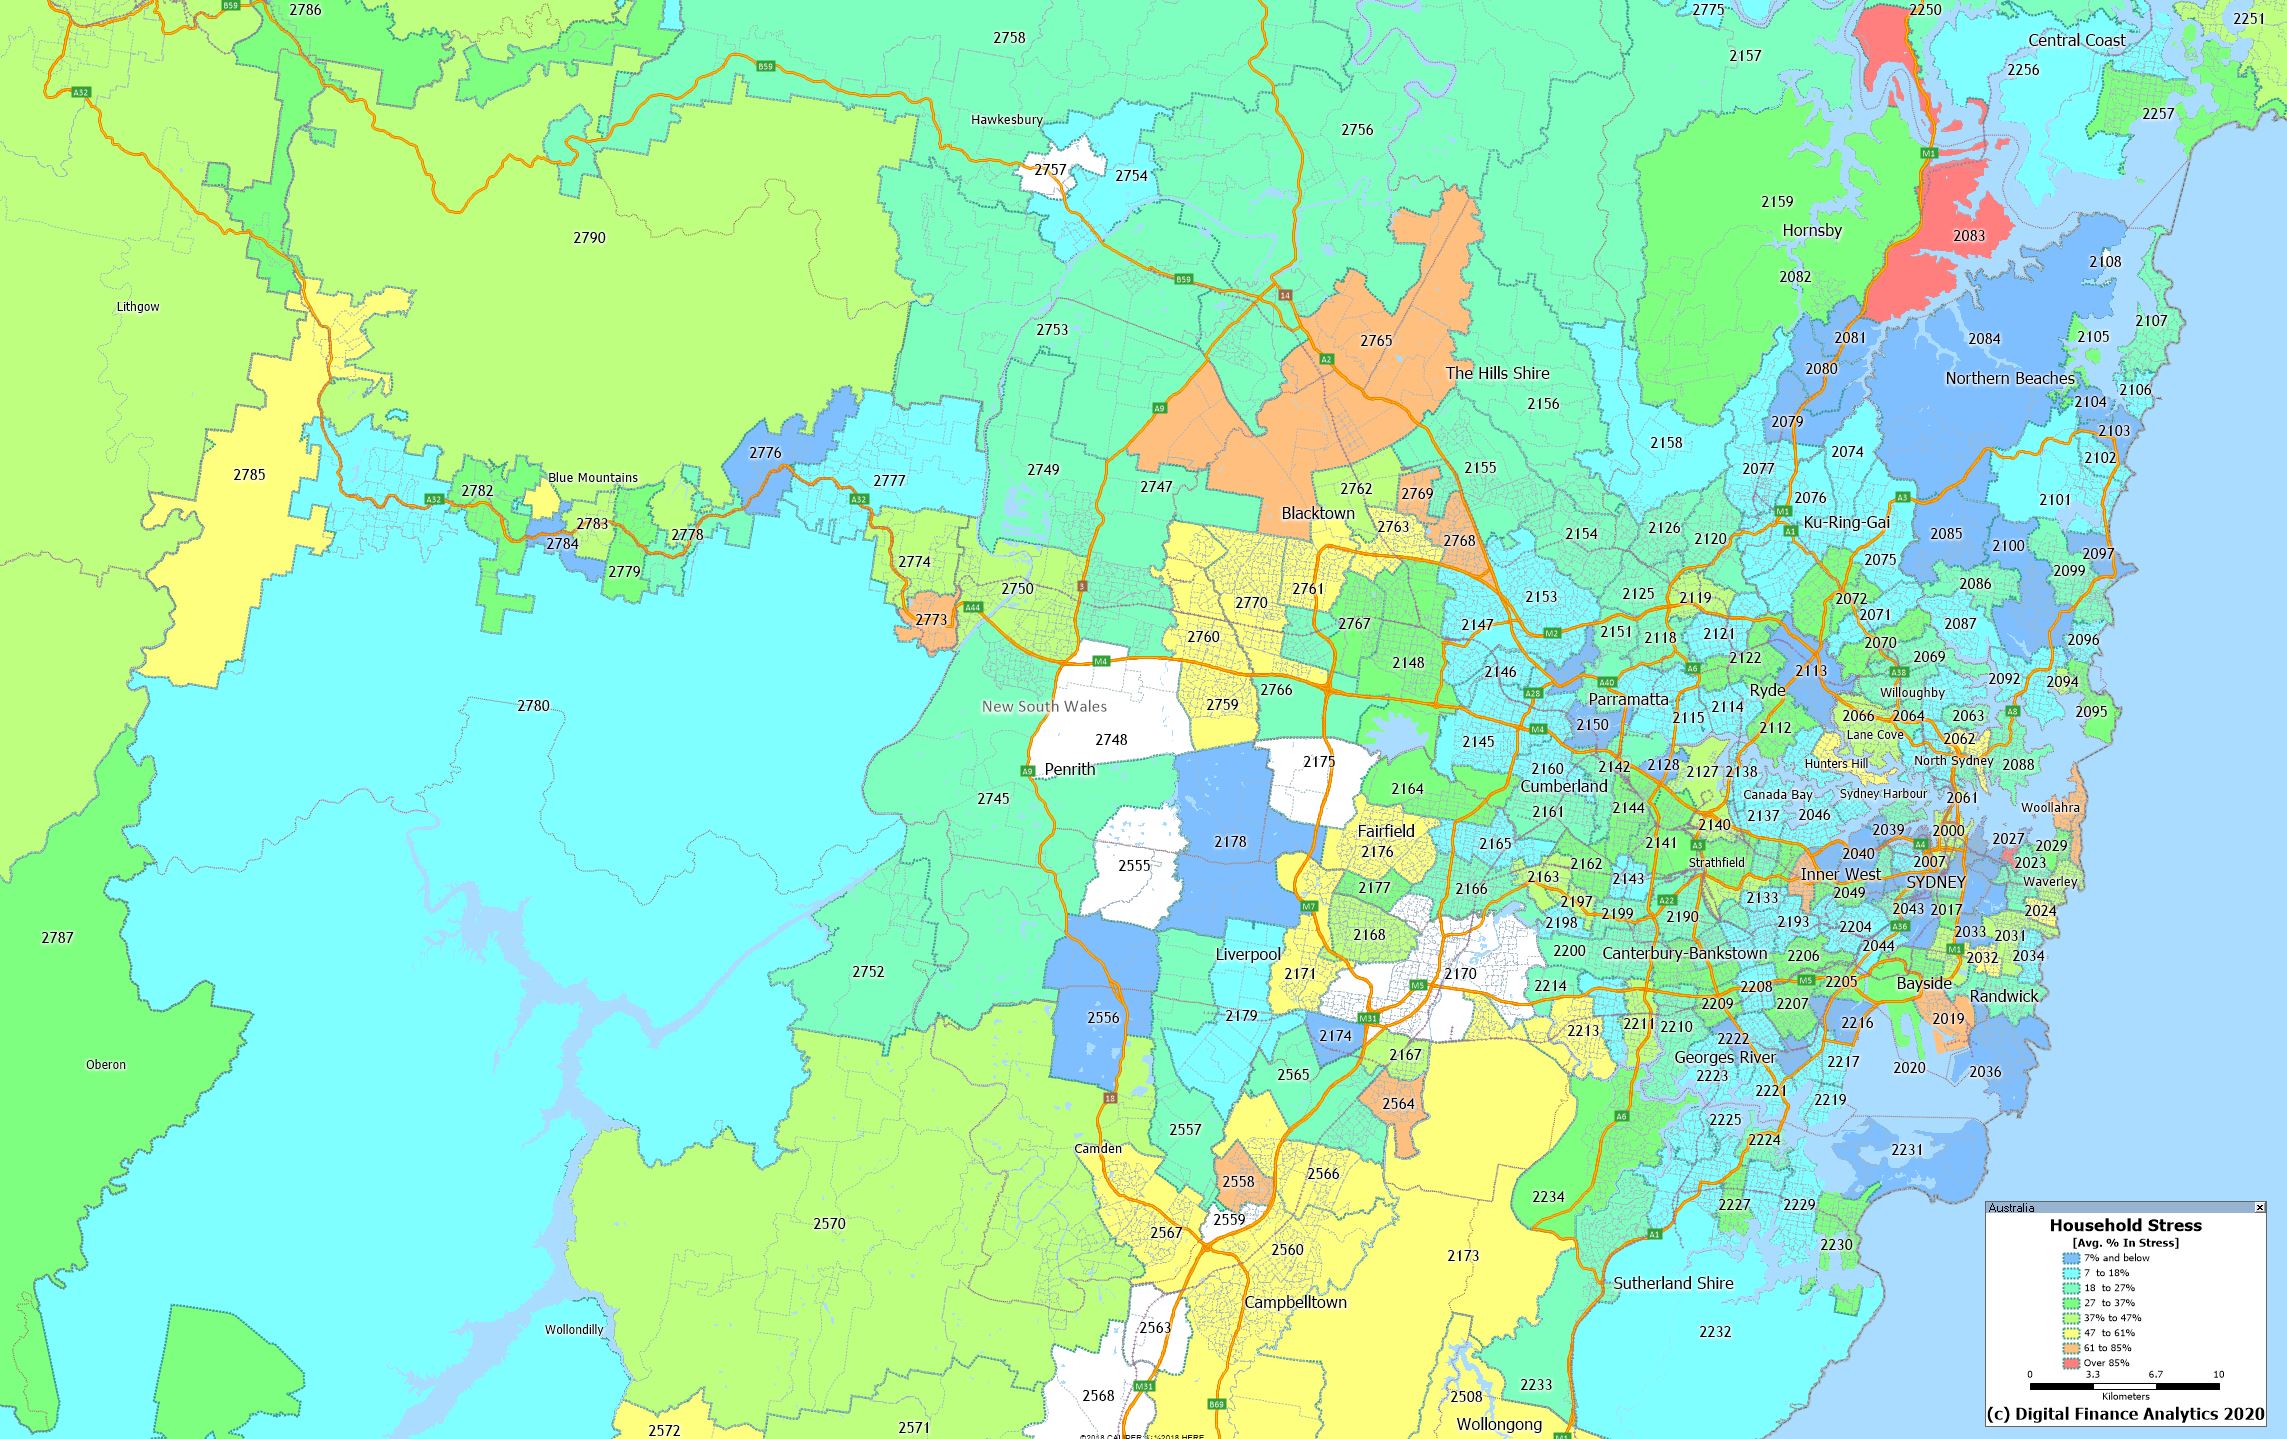
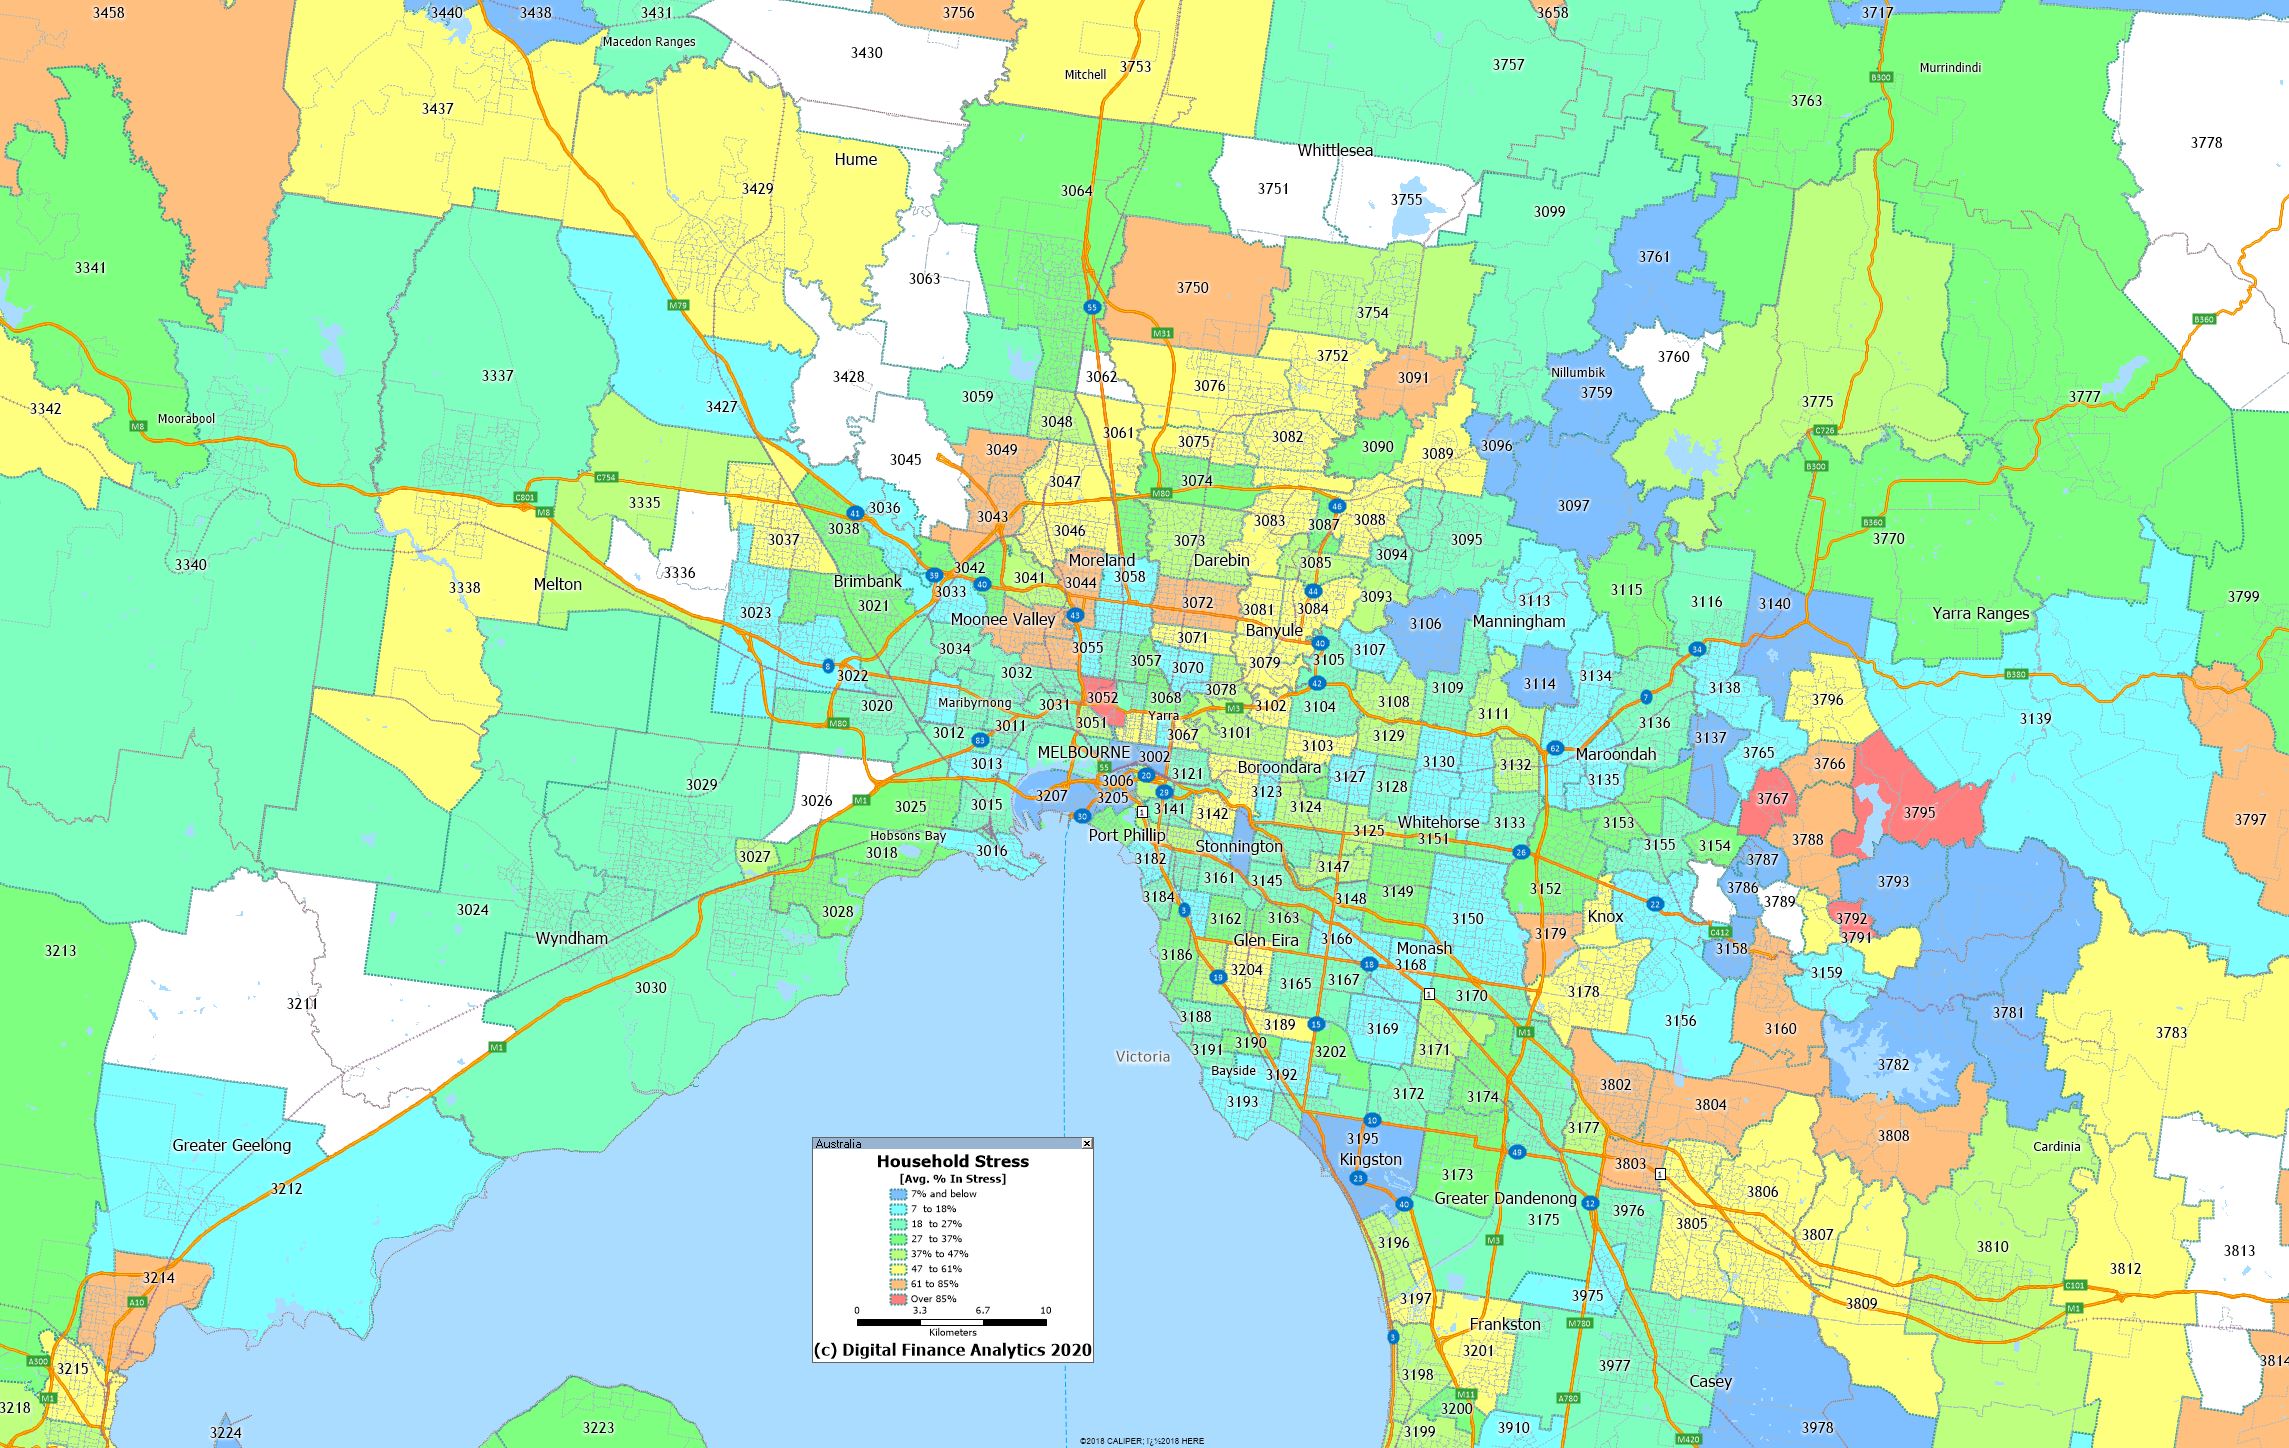
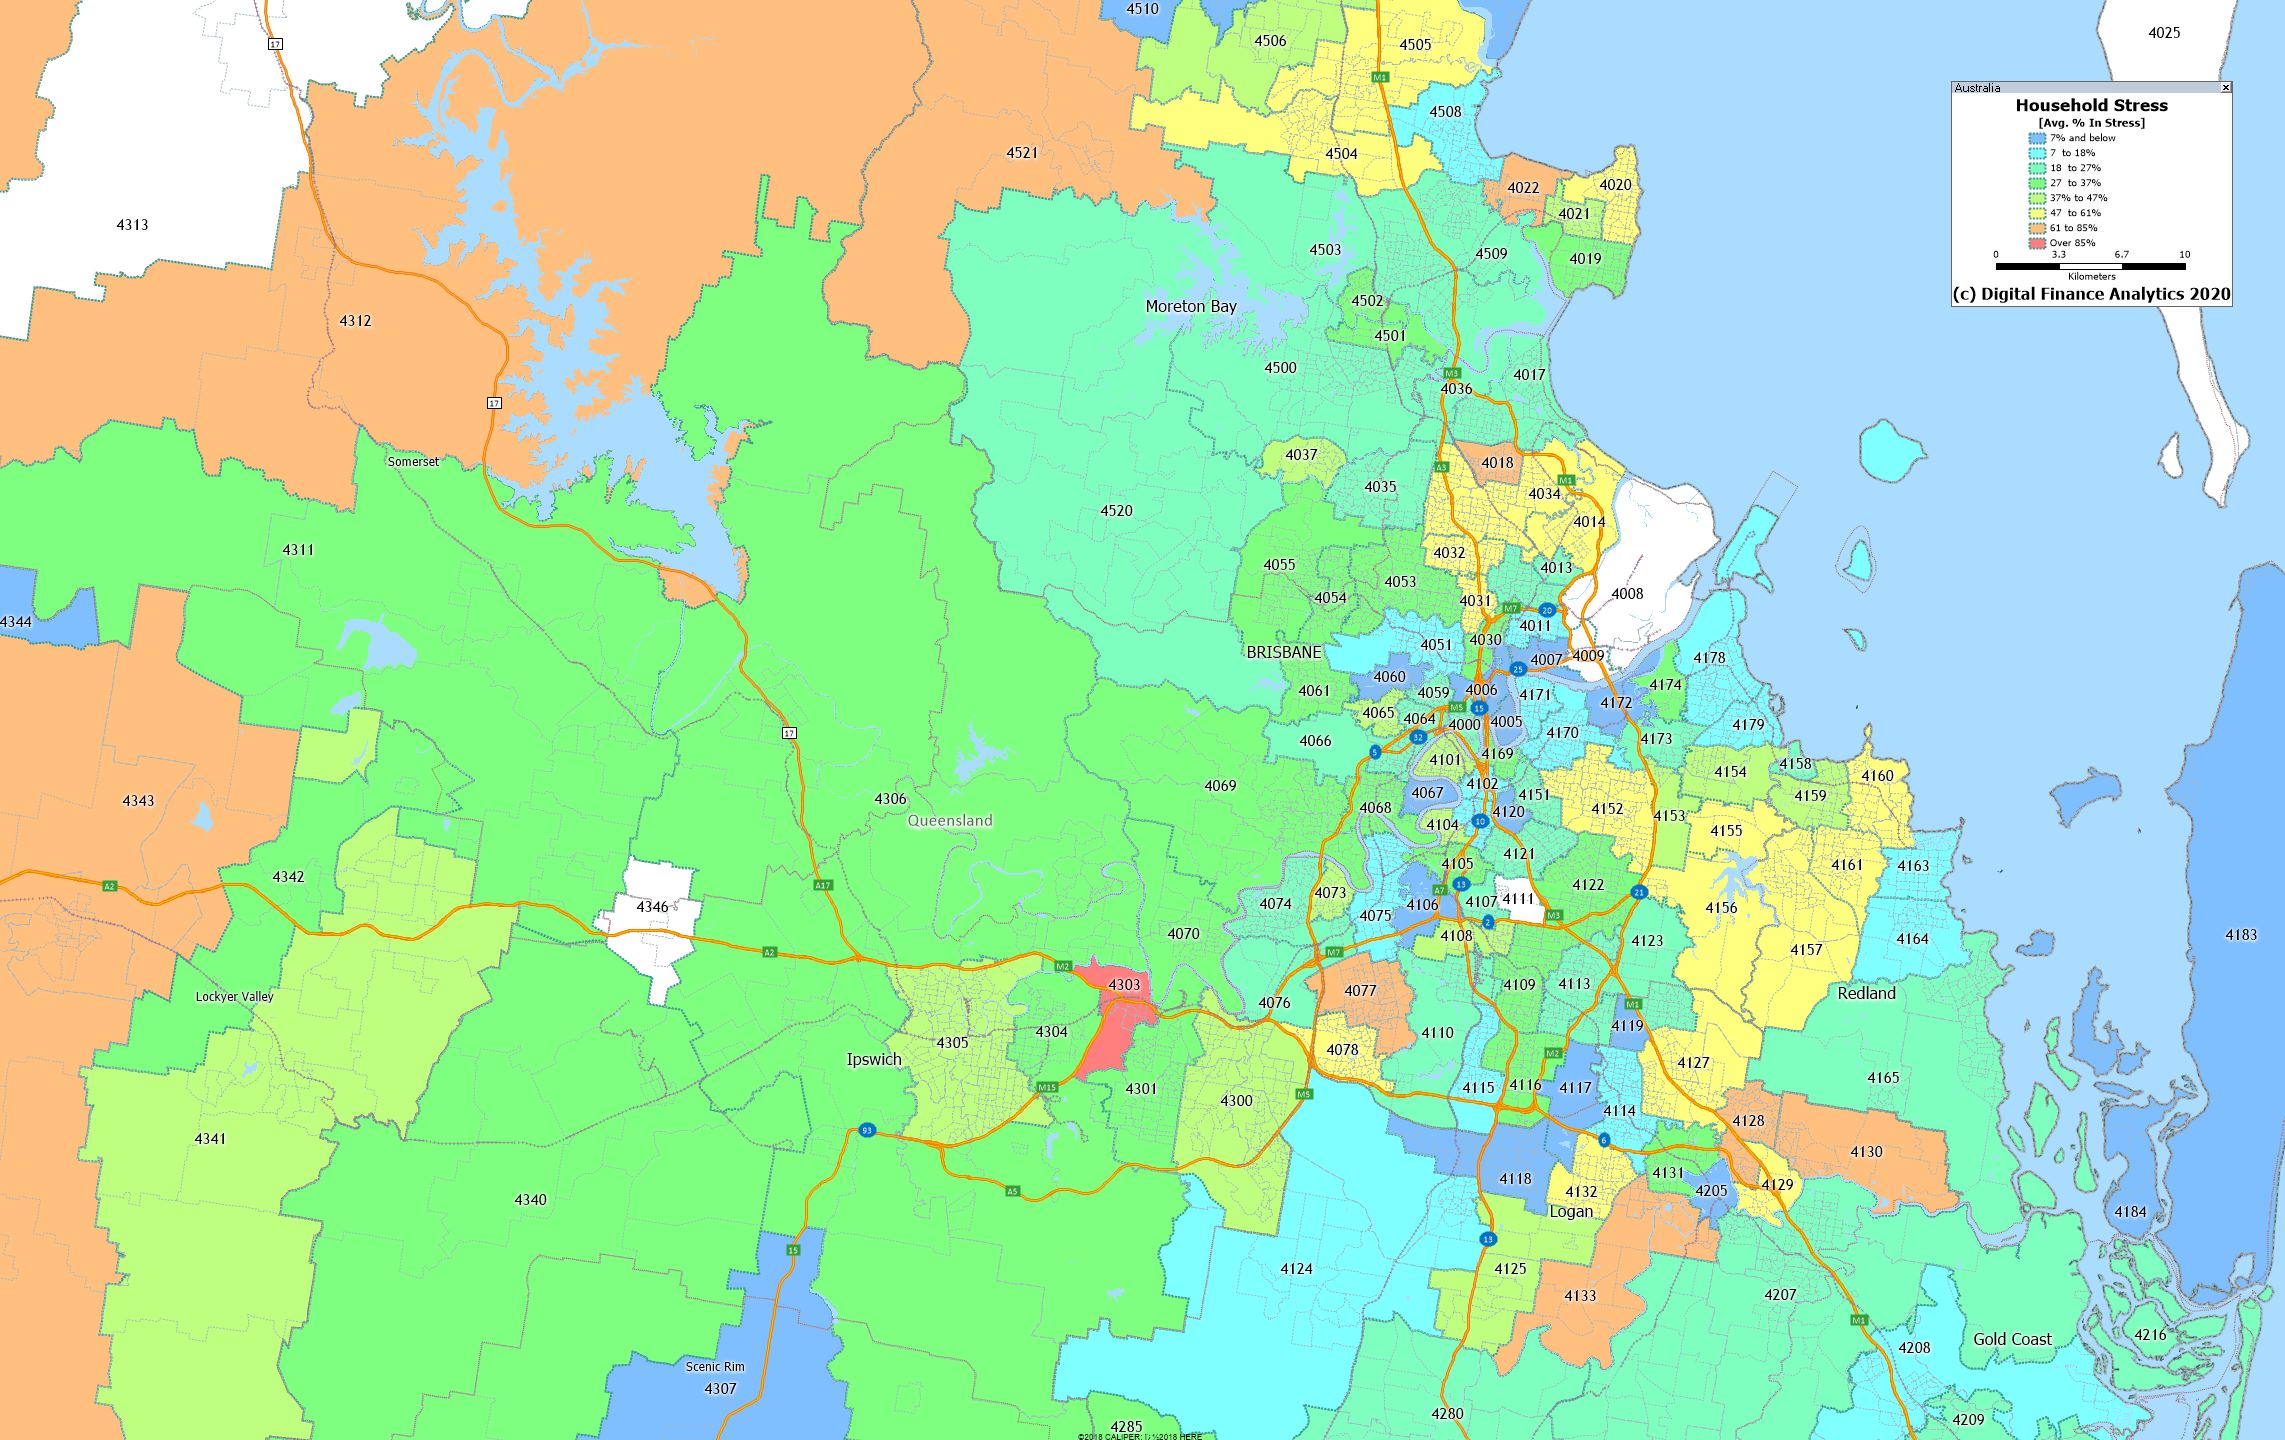
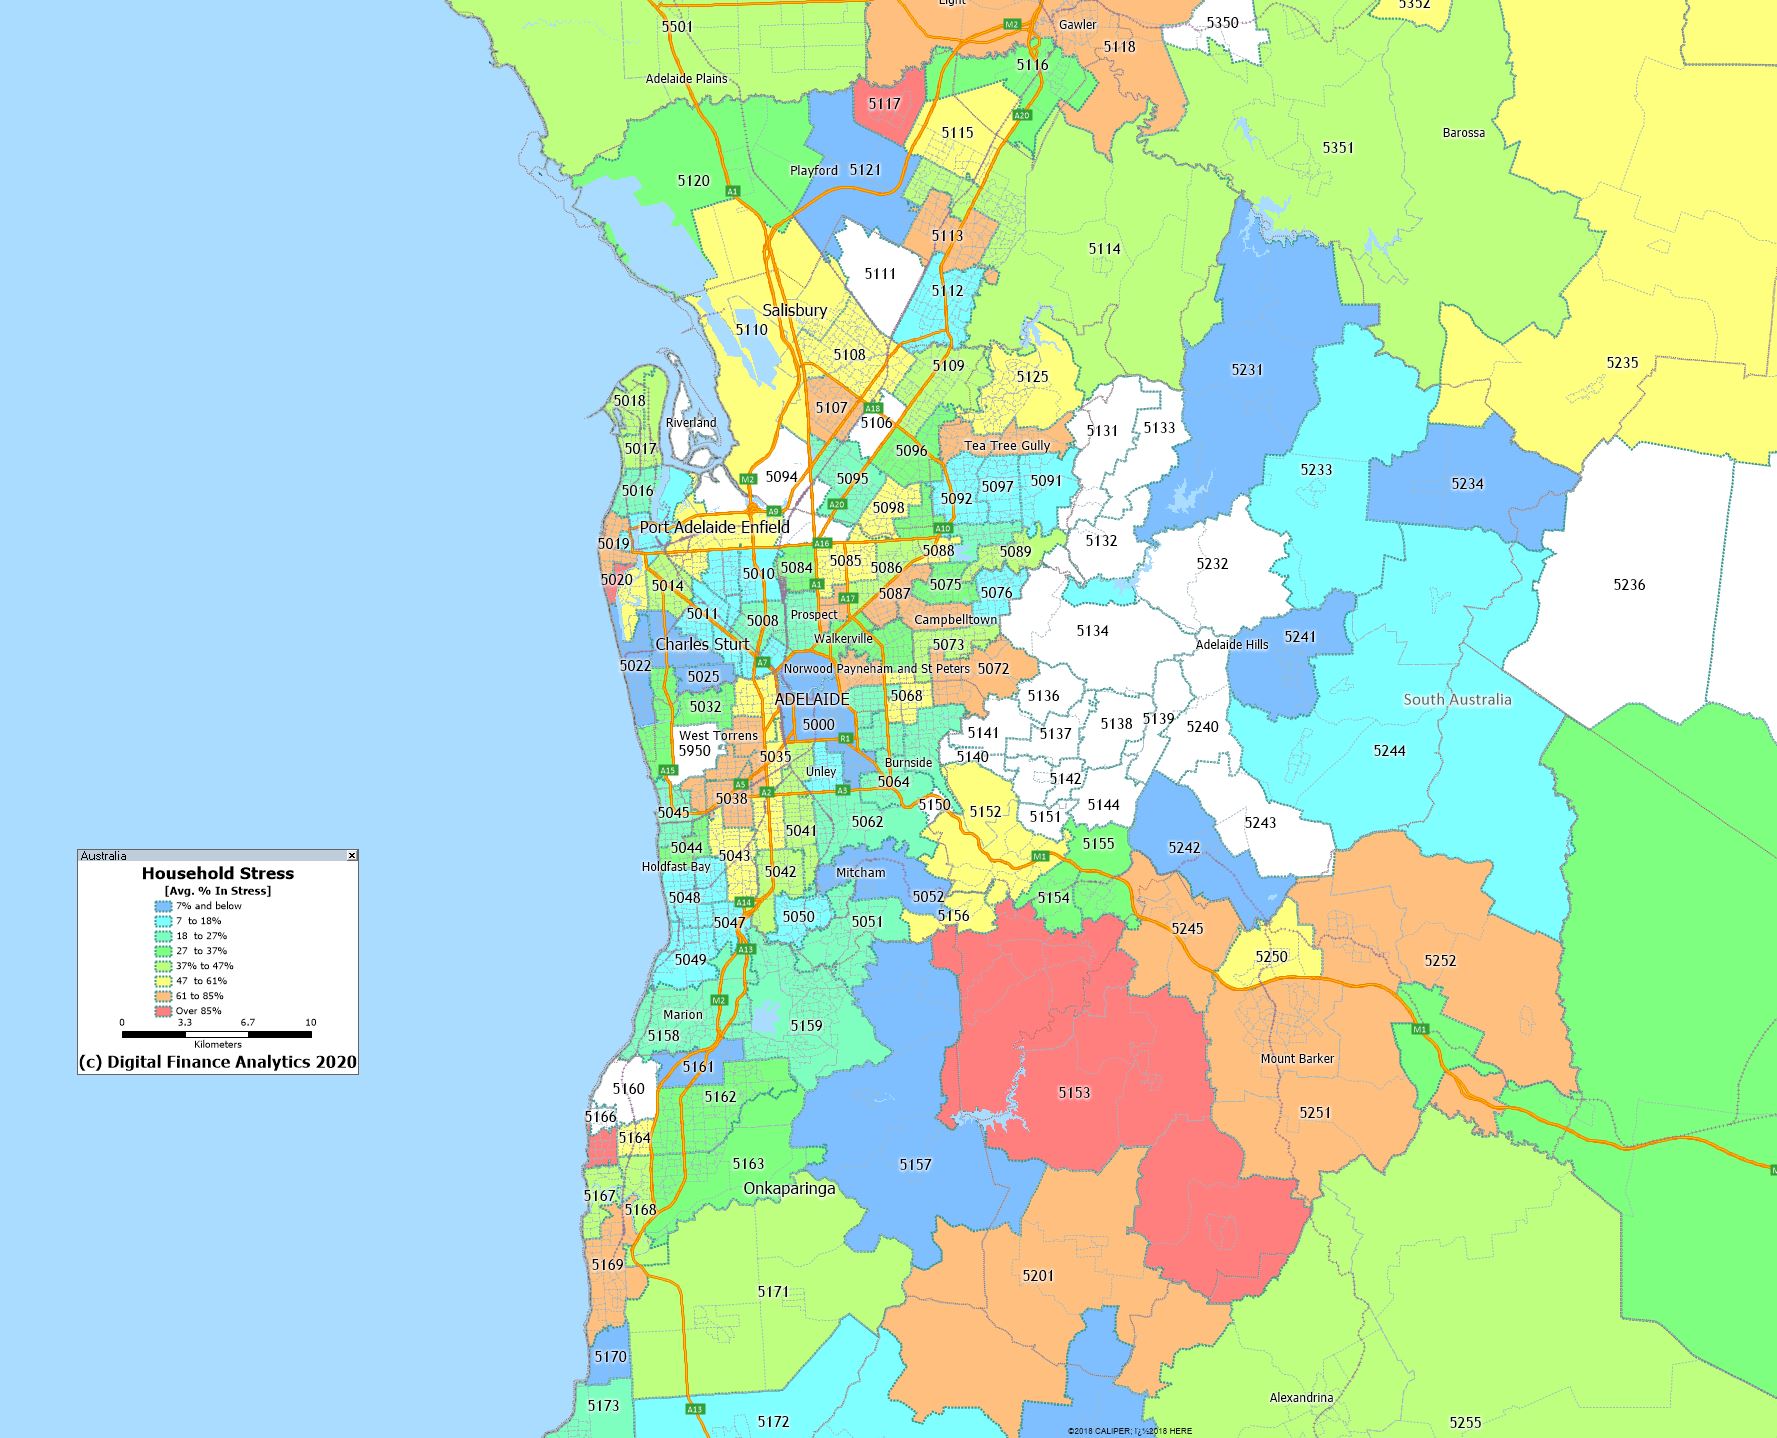
We have had many requests for updated mortgage stress maps, so today we include the latest post code level analysis – with data to end January 2020. We as showing the proportion of households in each state in stress, centered on the main urban centres. You can click on the maps to load and view the original capture.
Sydney
Melbourne
Brisbane
Adelaide
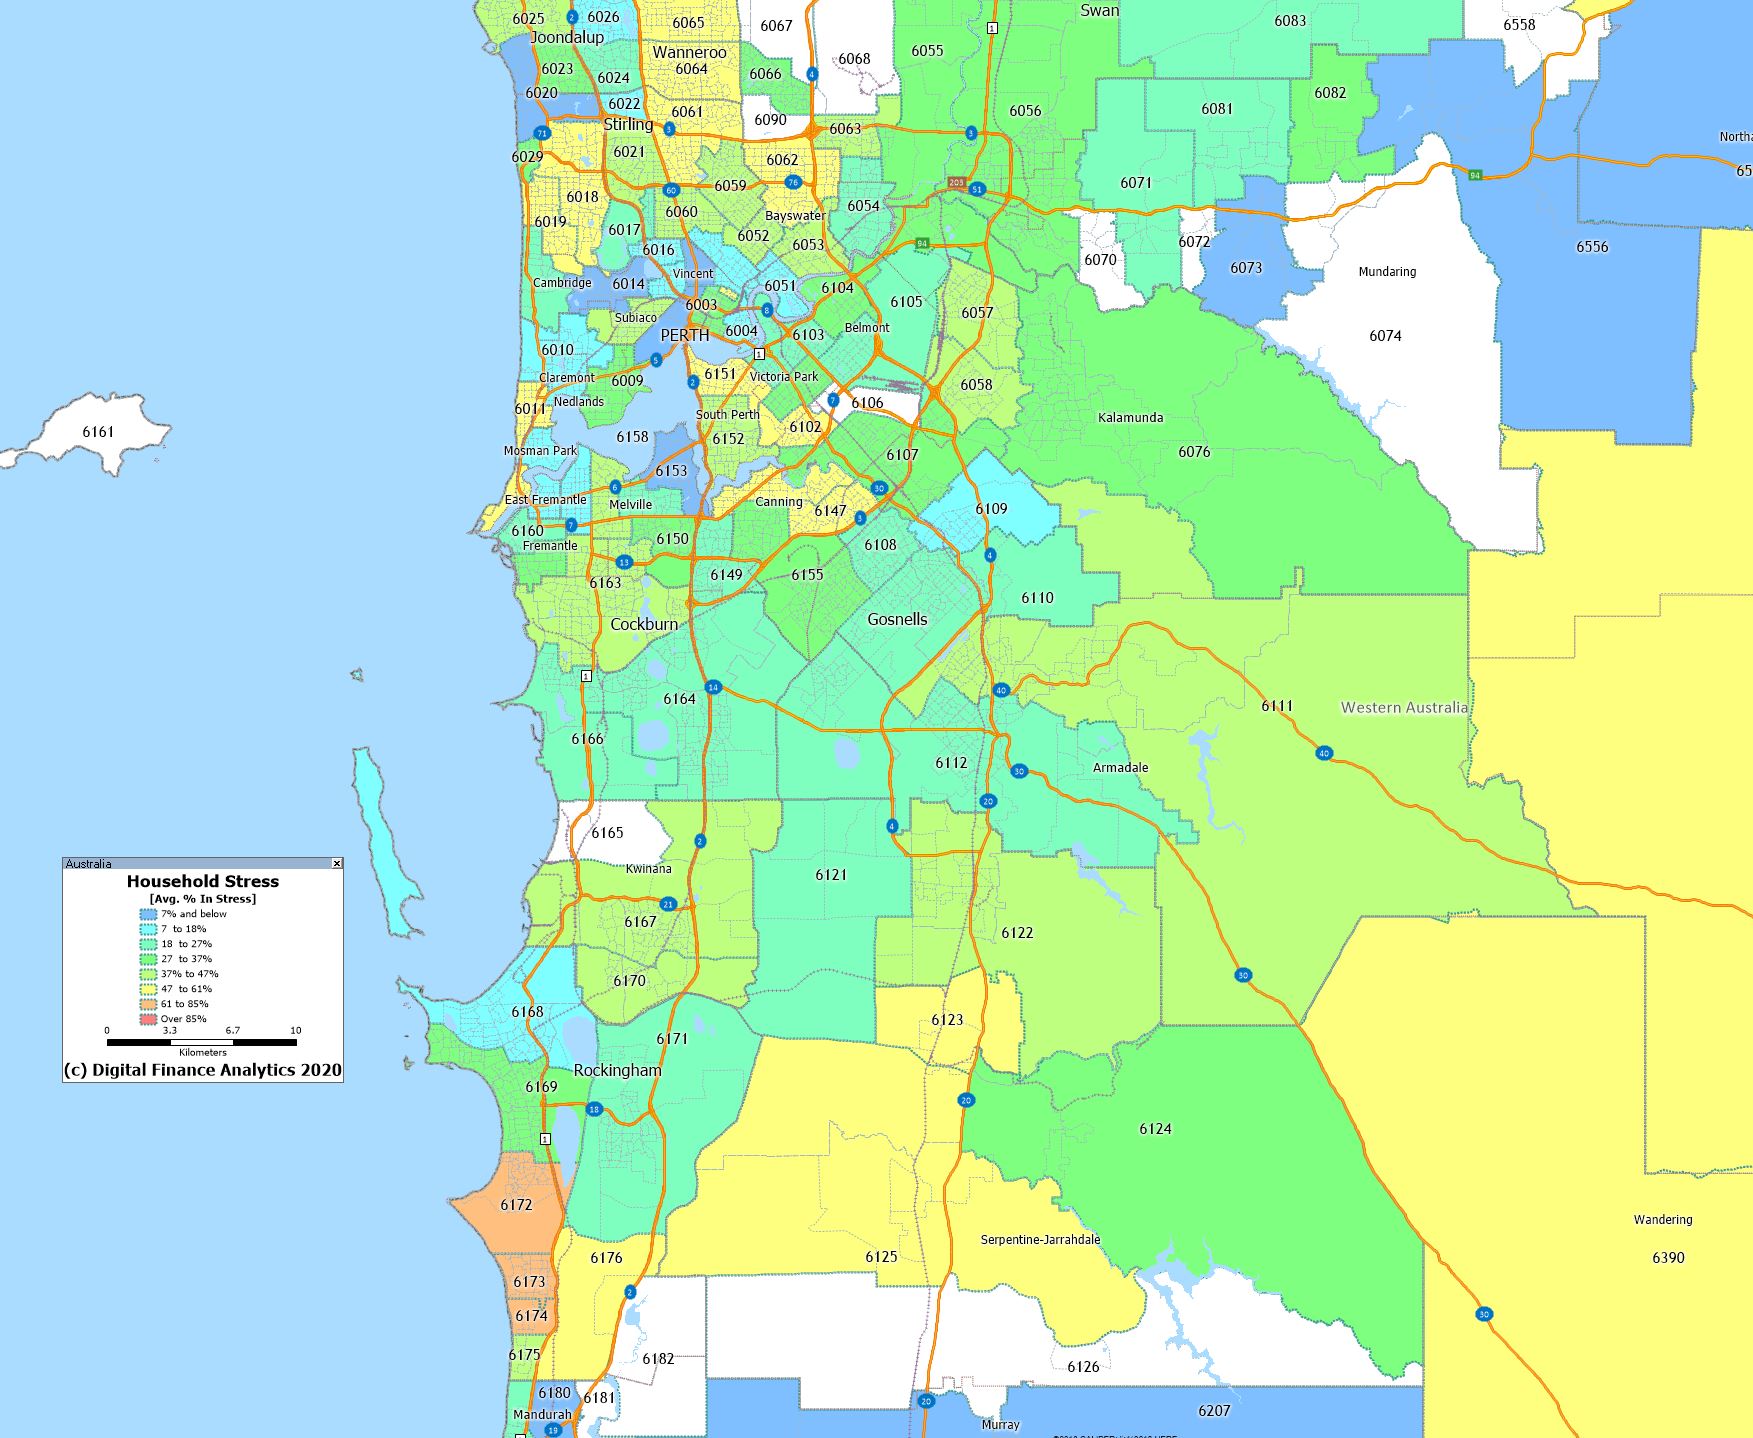
Perth
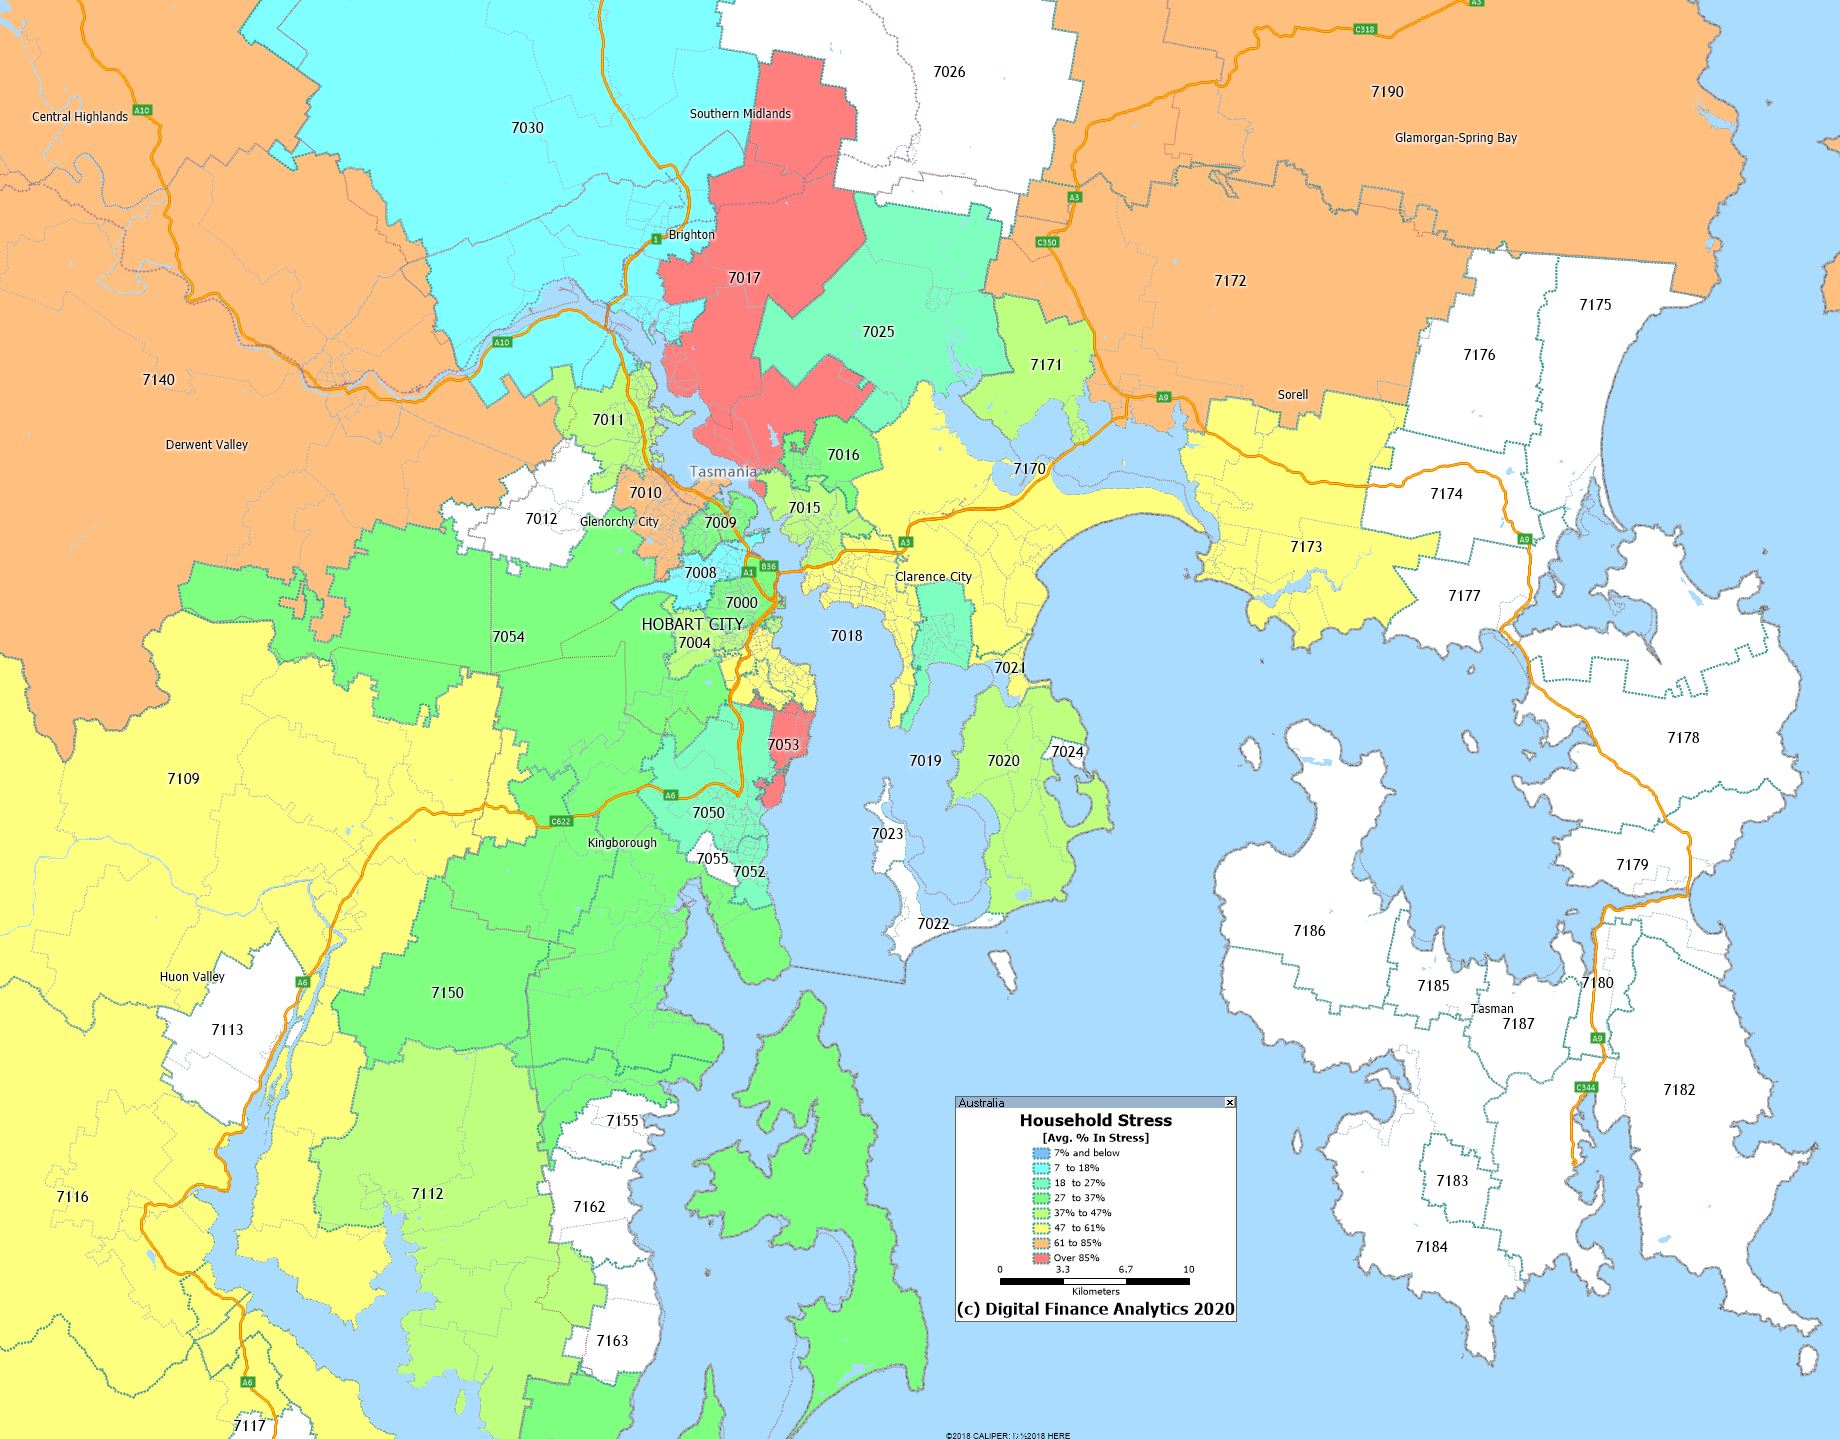
Hobart
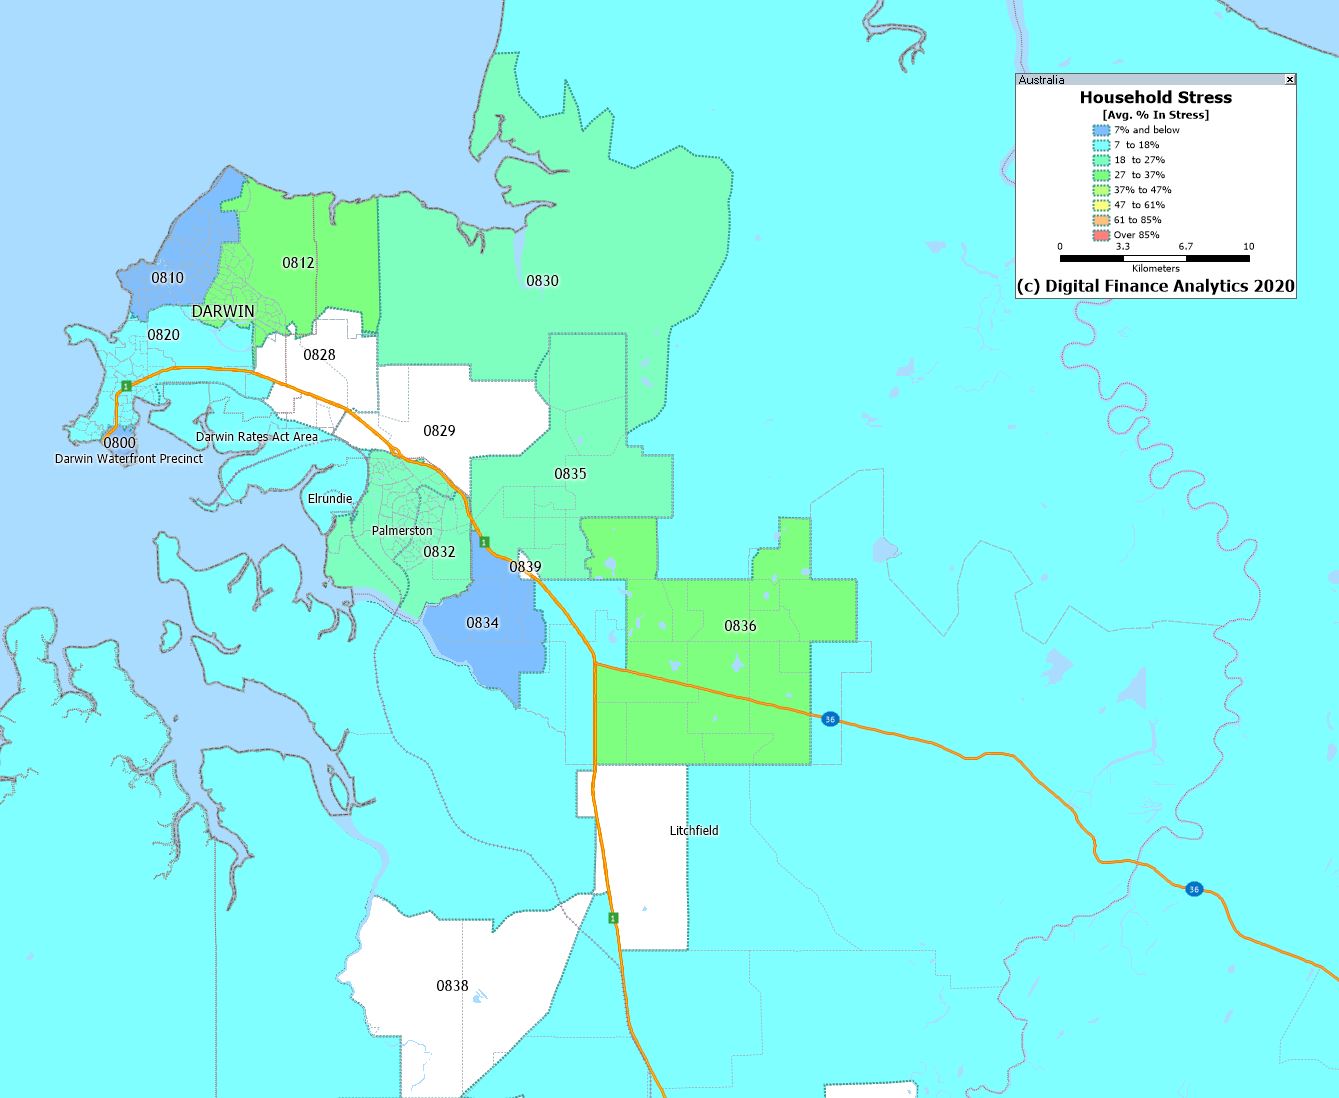
Darwin
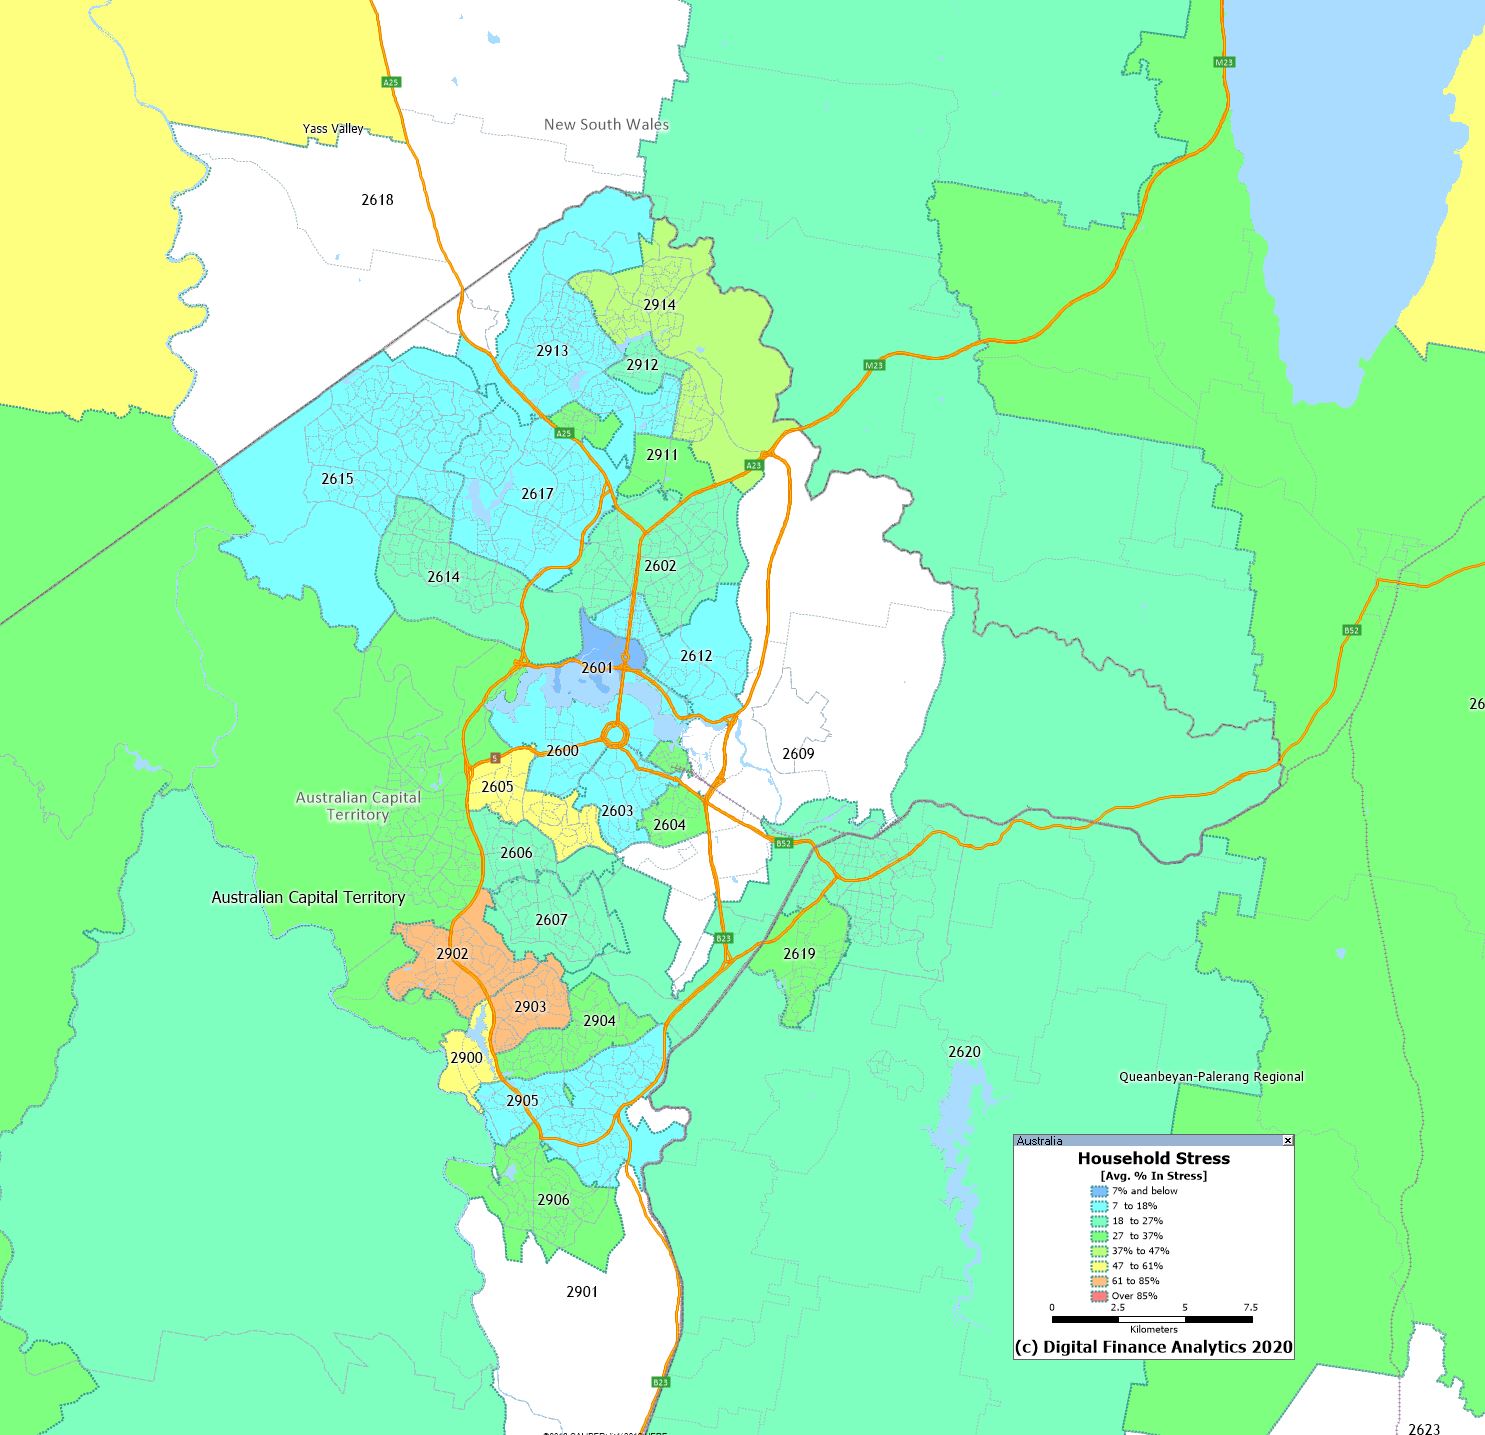
ACT
You can read more about our stress analysis here:
– The more I look the more I see.
– Another surprise: In previous charts/maps Campbelltown showed up in dark blue (high level of stress) but in this map stress in Campbelltown is (on a % basis) lower than in e.g. Vaucluse, Botany & Point Piper. Only 2 postcodes in Campbelltown have stress equal to these 3 suburbs in eastern Sydney. The rest have a (somewhat) lower level of stress.
– Postcode 2170 (Liverpool): I looked at a previous map (one year old) and it had a high amount of stress but now this postcode shows up in white (no data ??). Is there an error in your model / program / ……… ?
No error.
Martin,
Have you looked at the household stress and see how it correlates to income and the multiplier effect on the mortgage (e.g high income with low multiplier of the mortgage vs median income and a higher multiplier and then against the mortgage values in 250K bands).
It would also be good to see if there are trend charts on the multiplier effect on houses over time to see if the growth in the multipliers were signs of increasing stress (i.e if the multiplier increases does the increase in stress follow regardless of the size of the mortgage).
Ray
Yes see our earlier post, where we look at stress by segment (a proxy for income). High income households have bigger debts, more leverage, and higher exposure as stress rises.
– Interesting maps. Especially that one of Sydney.
– For the first time I see mortgage stress showing up in the eastern suburbs of Sydney in an serious way. In postcodes like Vaucluse, Botany (postoced 2019) and Point Piper (postcode 2027 ???) ???
– People in Vaucluse & in mortgage stress could have decided to sell their property in order to aleviate their stress. And luckily for those sellers, there is – for the time being – still FOMO to get into the property market in Vaucluse.
– I noticed that you have changed the meaning of the colors. E.g. (dark) blue no longer indicates high levels of stress but it indicates now low levels of stress. And that confused me when I looked at the charts for the first time.
Thanks – they updated my charting programme and changed the pallet options! And yes some more affluent post codes continue to be hit….
Thanks as always Martin. This is very useful information and much appreciated.
It’s something I look forward to each month.
Regards,
Nobby