A fintech start-up is celebrating a $25million raise as it continues on its pathway to becoming Australia’s “most innovative home loan provider”; via AustralianBroker.
Athena Home Loans, which is still in its pilot phase, has closed its most recent Series B raise led by Square Peg Capital.
Industry super fund Hostplus and venture firm AirTree also joined the round, taking the group’s total capital raised to date to $45m.
The Series B raise comes six months after the company announced a Series A fund raise led by Macquarie Bank and Square Peg Capital and three months after announcing a strategic partnership with Resimac Group.
Powered by Australia’s first cloud native digital mortgage platform, Athena aims to bypass the banks to connect borrowers to superfund backed loans.
The company was founded by two ex-bankers, Nathan Walsh and Michael Starkey, who said they wanted the journey to home ownership to be faster, cheaper and stress free.
Square Peg Capital invested in Athena in Series A and has further solidified its support of the home loan provider by leading the Series B round.
Venture capitalist and co-founder of Square Peg, Paul Bassat, who also sits on the Athena Board, said investing further into Athena proves the potential they see in the business.
He said, “Having worked with Nathan, Michael and the team over the last year I have enormous admiration for the speed at which they have navigated complex financial systems to develop a robust and customer-centric mortgage service.
“Athena is solving a really important problem for home buyers and is certainly one of the most exciting Fintech companies in Australia.
“We are thrilled to back the team again and look forward to supporting them on this extraordinary journey.”
Industry superannuation fund Hostplus has more than 1.1 million members and $37billion in funds under management.
Hostplus has spearheaded investment in the local start-up ecosystem, with more than $1billion of its fully diversified portfolio committed to Australian venture capital managers.
Hostplus chief investment officer, Sam Sicilia, said that “Athena is a great example of disruptive innovation delivering big savings for home loan borrowers”.
Athena COO Michael Starkey said, “We are delighted to have Hostplus and AirTree joining Athena as investors. Athena’s journey has benefited hugely from the insights and support from some of Australia’s smartest investors. It’s clear the timing has never been better to offer a fairer home loan.”
Athena CEO Nathan Walsh said, “During our pilot, we are already seeing the power of the Athena proposition to save money and change lives.
“A single mum who will be able to pay off her home loan 19 months earlier and save $130,000 over the life of the loan.
“A family with three young kids who will save $40,000 on their home loan can now take the family on the first holiday in years. It’s powerful stuff.”
Commenting on the company’s upcoming launch in Q1 2019, Nathan said, “Our key priorities with the investment will be to continue to innovate our platform, invest in talent and scale the business.
Asked at the banking royal commission how long it might take to embed the right culture in the National Australia Bank, its chairman Ken Henry replied: ten years.
As head of the Commonwealth Treasury before he left to join the NAB board in 2011, Dr Henry was regarded as a good, if cautious, forecaster. So ten years might be about the right answer.
He said there were “cultural inhibitors” at the bank, and he is right.
Deeply embedded within the workings of many financial institutions is a corrupt ethos of client exploitation.
These words might seem harsh, a kneejerk reaction to outrageous and possibly transient circumstances.
But they are neither my words, nor new ones.
Commissions corrupt, inevitably
Way back in 1826, when life insurance was in its infancy, it was already apparent that many policies were being mis-sold.
Charles Babbage, better known as the inventor of the first programmable computer, but also actuary of the Protector Life Assurance Society of London, identified the fundamental problem with commission-based selling of financial products, which he likened to “the acceptance of a bribe”.
What Babbage described is what economists have subsequently called the “agency problem”, and it is endemic to commission-based remuneration where the agent is supposed to be working in the best interest of the client, but will gain greatest personal benefit by selling the product that offers the largest commission.
It is present whether the product is insurance, or financial advice, or a mortgage.
Bankers’ codes of ethics don’t work
The Royal Commission has shown that insurance companies, banks, brokers and advisers are prepared to trample on the trust placed in them by millions of Australians by putting their own income and interests ahead of their clients’.
The way professions have typically addressed the agency problem is by constructing a set of moral codes and formal regulations to prevent (or at least limit) bad behaviour.
Medics have their Hippocratic Oath; lawyers have their Code of Ethical Conduct, and in large measure they seem to work.
Insurers, bankers, brokers and financial planners have less formal codes of conduct, but it is now clear that they don’t work – they are little more than smokescreens to conceal self-interested avarice.
As Babbage noted almost two centuries ago, wherever financial products are sold on commission, the payment received by the agent or broker has all the characteristics of a bribe.
What will work is removing temptation
These habits of rapacity are so deeply ingrained in the culture and operation of financial institutions that no amount of self regulation, no elaboration or reinforcement of voluntary codes of conduct, has been able to spare the sector from the corruption and debasement that Babbage foresaw.
More self regulation won’t help.
Here’s what would.
First, ban commissions of all types
The government should impose an outright ban on the payment of any commission of any kind with respect to any consumer financial transaction.
The cost of the work should be transparently priced, and should be paid for at the point of delivery.
It would, at a stroke, end high-pressure selling and would reward financial advisers and brokers for the service they actually deliver to clients.
Those who deliver good advice would prosper. The rest would go out of business.
The idea lies at the heart of the banning of commissions in Labor’s Future of Financial Advice Act, which unfortunately did not extend its ban on commissions to those for insurance.
Then report fees as dollar amounts
Second, where clients buy a financial product that charges an annual management fee, such as a superannuation account, the fee should be reported to the client in dollar terms rather than the percentage of funds under management.
Each year the client should be given the option of a “free transfer” of their funds to an alternative provider that can offer the same product for a lower fee.
It would open up the opaque structure of management fees to critical review by clients, and would impose competitive pressure to drive down fees, which in Australia’s bloated superannuation sector are more than double the OECD average.
Such reforms would be greeted with howls of protest from super funds (and banks, where banks still control them) but as Babbage foresaw and the Royal Commission has demonstrated, the industry has become so beholden to its own self-interest that it has forfeited the right to control its future.
Author: Paul Johnson Warden, Forrest Research Foundation, University of Western Australia
Agustín Carstens, General Manager, Bank for International Settlements spoke in Beijing recently and discussed the challenges going forward for central banks, as the monetary policy normalistion (following a decade of ultra-low interest rates, QE and the like), are unwound. He admits that the starting point of the ongoing normalisation is unprecedented, and there are extreme uncertainties involved.
Household debt is high and rising in many advanced and emerging market economies. Quantitative easing has been a “volatility stabiliser” in financial markets and when it is removed or reversed, it is not clear how the market will react. We are in uncharted territory! Yet, monetary policy normalisation is essential for rebuilding policy space, creating room for countercyclical policy.
Monetary policy normalisation in the major advanced economies is making uneven progress, reflecting different stages of recovery from the GFC. The Federal Reserve has begun unwinding its asset holdings by capping reinvestments and has increased policy rates. The ECB has scaled back its large-scale asset purchases, with a likely halt of net purchases by end-year. Meanwhile, the Bank of Japan is continuing with its purchases and has not communicated any plan for exiting.
The ongoing unwinding of accommodative monetary policy in core advanced economies is a welcome step. It is a sign of success as economies have been brought back to growth and inflation rates back towards target levels. Monetary policy normalisation is essential for rebuilding policy space, creating room for countercyclical policy. Moreover, it can help restrain debt accumulation and reduce the risk of financial vulnerabilities emerging.
But there are also significant challenges. The starting point of the ongoing normalisation is unprecedented, and there are extreme uncertainties involved. The path ahead for central banks is quite narrow, with pitfalls on either side. Central banks will need to strike and maintain a delicate balance between competing considerations. This includes, in particular, the challenge of achieving their inflation objectives while avoiding the risk of encouraging the build-up of financial vulnerabilities.
Central banks have prepared and implemented normalisation steps very carefully. Policy normalisation has been very gradual and highly predictable. Central banks have placed great emphasis on telegraphing their policy steps through extensive use of forward guidance. As a consequence, major financial and economic ructions have so far been avoided. In this regard, the increased resilience of the financial sector as a consequence of the wide regulatory and supervisory reforms undertaken since 2009 has also helped.
That said, there are still plenty of risks out there.
First, central banks are not in control of the entire yield curve and of the behaviour of risk premia. Investor sentiment and expectations are key factors determining these variables. An abrupt repricing in financial markets may prompt an outsize revision of the expected level of risk-free interest rates or a decompression in risk premia. Such a snapback could be amplified by market dynamics and have adverse macroeconomic consequences. It could also be accompanied by sudden sharp exchange rate fluctuations and spill across borders, with broader repercussions globally.
Second, many intermediaries are in uncharted waters. Exchange-traded funds (ETFs) have grown faster than actively managed mutual funds over the past decade, and needless to say, they have brought very important benefits to bond markets, among other factors, by enhancing the depth of such markets and making possible new ways of financing for many sovereigns and corporations. ETFs are especially popular among equity investors, but they have also gained importance among bond investors.
They have attracted investors because they charge lower fees than traditional mutual funds, which has proved to be an important advantage in the ultra-low interest rate environment. Moreover, they promise liquidity on an intraday basis, hence more immediately than mutual funds, which provide it only daily.
Such promise of intraday liquidity is, however, a double-edged sword. As soon as ETF investors are confronted with negative news or observe an unexpected fall in the underlying asset price, they can run – that is, sell their ETF shares immediately – adding to the downward pressure on market prices. As equity markets become choppier, we will need to be on the look-out for ETFs possibly accentuating the volatility of the underlying asset market.
Currently, bond ETFs are still small compared with bond mutual funds in terms of their assets under management. However, as the market share of ETFs increases, their impact on market price dynamics will also increase. Moreover, they have yet to be tested in periods of high interest rates.
More generally, investors may face unforeseen risks – in particular, unforeseen dry-ups in liquidity. As I mentioned earlier, the growing size of the asset management industry may have increased the risk of liquidity illusion: market liquidity seems to be ample in normal times, but dries up quickly during market stress. Asset managers and institutional investors do not have strong incentives to play a market-making role when asset prices fall due to large order imbalances. Moreover, precisely when asset prices fall, asset managers often face redemptions by investors. This is especially true for bond funds investing in relatively illiquid corporate or EME bonds. Therefore, when market sentiment shifts adversely, investors may find it more difficult than in the past to liquidate bond holdings.
Central banks’ asset purchase programmes may also have contributed to liquidity illusion in some bond markets. Such programmes have led to portfolio rebalancing by investors from safe government debt towards riskier bonds, including EME bond markets, making them look more liquid. However, such liquidity may disappear in the event of market turbulence. Also, as advanced economy central banks unwind their asset purchase programmes and increase policy rates, investors may choose to rebalance from riskier bonds back to safe government bonds. This can widen spreads of corporate and EME bonds.
Moreover, asset managers’ investment strategies can collectively increase financial market volatility. A key source of risk here is asset managers’ “herding” in illiquid bond markets. Fund managers often claim that their performance is evaluated over horizons as long as three to five years. Nevertheless, they tend to have a strong aversion to underperforming over short periods against industry peers. This can lead to increased risk-taking and highly correlated investment strategies across asset managers. For example, recent BIS research shows that EME bond fund investors tend to redeem funds at the same time. Moreover, the fund managers of the so-called actively managed EME bond funds are found to closely follow a small number of benchmarks (a practice known as “benchmark hugging”).
Third, the fundamentals of many economies are not what they should be while at the same time there seems to be less political appetite for prudent macro policies. High and rising sovereign debt relative to GDP in many advanced economies has increased the sensitivity of investors to the perceived ability and willingness of governments to ensure debt sustainability. Sovereign debt in EMEs is considerably lower than in advanced economies on average, but corporate leverage has continued to rise and has reached record levels in many EMEs.
Also, household debt is high and rising in many advanced and emerging market economies. In addition, a large amount of EME foreign currency debt matures over the next few years, and large current account and fiscal deficits in some EMEs could induce global investors to take a more cautious stance. Tightening global financial conditions and EME currency depreciation may increase the sensitivity of investors to these vulnerabilities.
Fourth, other factors may augment the spillover effects from unwinding unconventional monetary policy. Expansionary fiscal policy in some core advanced economies may further push up interest rates, by increasing government bond supply and aggregate demand in already-overheating economies. Trade tensions have started to darken the growth prospects and balance of payments outlook of many countries. Such tensions also have repercussions on exchange rates and corporate debt sustainability. Heightened geopolitical risks should not be ignored either. The sharp corrections in advanced economy and EME equity markets alike in October 2018 are generally attributed to both aggravating trade tensions and geopolitical risks.
Fifth, there is much uncertainty about how investors will react to monetary policy normalisation. Quantitative easing has been a “volatility stabiliser” in financial markets. Thus, when it is removed or reversed, it is not clear how the market will react. Market segments of particular concern are high-yield bonds and EME corporate bonds. As I pointed out a moment ago, liquidity tends to dry up more easily in these markets. Knowing this, asset managers may try to rebalance their portfolios by deleveraging more liquid surrogates first, which creates an avenue for contagion to other markets.
“Tourist investors” are another source of concern. For example, in contrast to “dedicated” bond funds, which follow specific benchmarks relatively closely, “crossover” funds have benchmarks but deviate from them and cross over to riskier asset classes such as EME bonds and high-yield corporate bonds in search of yield. Crossover funds are not new, but they have gained prominence recently. They include high-yield, high-risk bonds in their portfolio by arguing that the extra return from such investments is high enough to compensate for their risk. They are likely to underprice risks when markets are calm, but overprice risks when markets become volatile. They are, indeed, very responsive to interest rate and exchange rate surprises and tend to pull out suddenly from risky investments.
Finally, significant allocations by global asset managers to domestic currency bond markets, in particular to EME local currency sovereign bonds, have generated new challenges. After the Asian financial crisis of 1997–98, many emerging Asian economies made concerted efforts to develop their local currency bond markets. This was a welcome development, overcoming “original sin”, a term coined by Barry Eichengreen and Ricardo Hausmann in 1999 for the inability of developing countries to borrow in their domestic currency. By relying on long-term local currency bonds instead of short-term foreign currency loans, many Asian EME borrowers were able to avoid currency mismatch and reduce rollover risk. In addition, over the past several years, the average maturity of EME local currency bonds has increased overall.
However, as the share of foreign investment in EME local currency bond markets has increased, currency and rollover risks have been replaced by duration risk. The effective duration of an investment measures the sensitivity of the investment return to the change in the bond yield. Recent BIS research shows that EME local currency bond yields tend to increase in tandem with domestic currency depreciation. This can make returns of EME local currency bond investors, whose investment performance is measured in the US dollar (or the euro), extremely volatile. As an analogy, incorporating exchange rate consideration is similar to viewing temperatures with and without a wind chill factor.
This suggests that the exchange rate response to capital flows might not stabilise economies as textbooks predict: it might instead lead to procyclical non-linear adjustments. Exchange rate changes can drive capital in- and outflows via the so called risk-taking channel of exchange rates.
The core mechanism of the risk-taking channel works as follows. In the presence of currency mismatch, a weaker dollar flatters the balance sheet of the EME’s dollar borrowers. This induces creditors (either global banks or global bond investors) to extend more credit. As a consequence, a weaker dollar goes hand in hand with reduced tail risks and increased EME borrowing. However, when the dollar strengthens, these relationships go into reverse.
Policy implications
Monetary policy normalisation by major advanced economies, escalating trade tensions, heightened geopolitical risks and new forms of financial intermediation all pose challenges going forward for both advanced and emerging market economies. How can policymakers rise to these challenges?
Inadequate growth-enhancing structural policies have been a major deficiency over the past years. Such policies would facilitate the treatment of overindebtedness. In contrast to expansionary monetary and fiscal policies, which boost both debt and output, growth-enhancing structural reforms would primarily boost output, thus reducing debt burdens relative to incomes. Moreover, by improving the supply side of the economy, they would contain inflationary pressures. And, if sufficiently broad in scope, they would have positive distributional effects, reducing income inequality.
Advanced economies should be mindful of spillovers, also because they can mutate into spillbacks. During phases in which interest rates remain low in the main international funding currencies, especially the US dollar, EMEs tend to benefit from easy financial conditions. These effects then play out in reverse once interest rates rise. A reversal could occur, for instance, if bond yields snapped back in core advanced economies, and especially if this went hand in hand with US dollar appreciation. A clear case in point is the change in financial conditions experienced by EMEs since the US dollar started appreciating in the first quarter of 2018.
Global spillovers can also have implications for the core economies. The collective size of the countries exposed to the spillovers suggests that what happens there could also have significant financial and macroeconomic effects in the originating economies. At a minimum, such spillbacks argue for enlightened self-interest in the core economies, consistent with domestic mandates. This is an additional policy dimension that complicates the calibration of the normalisation and that deserves close attention.
Financial reforms should be fully implemented. If enforced in a timely and consistent manner, these reforms will contribute to a much stronger banking system. Indeed, the Basel Committee’s Regulatory Consistency Assessment Programme has found that its members have put in place most of the major elements of Basel III. But implementation delays remain. It is important to attain full, timely and consistent implementation of all the rules. This would improve the resilience of banks and the banking system. It is also necessary for attaining a level playing field and limiting the room for regulatory arbitrage.
For EMEs, keeping one’s house in order is paramount because there is no room for poor fundamentals during tightening global financial conditions. EMEs may nevertheless face capital outflows, and their currencies may depreciate abruptly, which would trigger further capital outflows. In such instances, EME authorities must be prepared to respond forcefully. They should consider combining interest rate adjustments with other policy options such as FX intervention. And they should consider using the IMF’s contingent lending programmes.
At the same time, EMEs should not disregard non-orthodox policies to deal with stock adjustment. If a large amount of foreign capital has flowed into domestic markets and threatens to flow out quickly, the central bank can use its balance sheet to stabilise markets. As an example, the Bank of Mexico has in the past swapped long-term securities for short-term securities via auctions. This was done because such long-term instruments were not in the hands of strong investors, and there was market demand for short-term securities. This policy stabilised conditions in peso-denominated bond markets.
Finally, policymakers need to better understand asset managers’ behaviour in stress scenarios and to develop appropriate policy responses. One key question for policymakers is how to dispel liquidity illusion and to support robust market liquidity. Market-makers, asset managers and other investors would need to take steps to strengthen their liquidity risk management. Policymakers can also provide them with incentives to maintain robust liquidity during normal times to weather liquidity strains in bad times – for example, by encouraging regular liquidity stress tests.
He makes the point that non-banks are picking up the investor slack, as reflected in the composition of the collateral underpinning RMBS. The high volume of RMBS issuance by non-banks is consistent with a sizeable increase in their mortgage lending.
More evidence that this sector of the market needs tighter controls?
Today I’ll provide an update on developments in the markets for housing and housing credit. These markets are closely related and both are of considerable interest to those that issue and those that invest in Australian residential mortgage-backed securities (RMBS).
Along the way, I’ll make use of data on residential mortgages from RMBS that are eligible for repurchase operations with the Reserve Bank.[1] Among other things, these data are a useful source of timely information on interest rates actually paid, loan by loan. As I’ll demonstrate, this allows us to infer something about shifts in the supply of, and demand for, housing credit, thereby shedding some light on the different forces driving these markets.
With this background in mind, I’ll also review some recent developments in the RMBS market. And I’ll finish by taking the opportunity to emphasise that RMBS issuers and investors should be prepared for any future changes in the use and availability of benchmark interest rates.
Interactions between the housing market and the market for housing credit
As highlighted recently in a speech by the Deputy Governor, the markets for housing and housing credit are going through a period of significant adjustment.[2] After years of strong growth, housing prices have been declining nationally, driven by falls in Melbourne and Sydney over the past year. Also, there has been a noticeable decline in investor credit growth and an easing in owner-occupier credit growth. The cycles in the growth of overall housing prices and investor credit have moved together quite closely over the past few years (Graph 1).
Graph 1
Underpinning these changes, there have been shifts in the demand for, and supply of housing, as well as in the demand for, and supply of, housing credit.
Credit supply affecting housing demand
The links between these two markets run in both directions, from housing credit to the housing market, and from the housing market to housing credit. Of late, the story more commonly told, though, is that a tightening in the supply of credit over recent years has impinged on the demand for housing.
This story is certainly the more apparent one in terms of its causes and effects. In particular, the measures implemented by regulators over recent years to address the risks associated with some forms of housing lending have worked to mitigate those risks and they have also led to a noticeable slowing of investor credit. This, in turn, has contributed to a decline in the demand for housing.
Again, these links have been discussed by Guy Debelle and are well-documented in the Bank’s latest Financial Stability Review (FSR).[3] In late 2014, the Australian Prudential Regulation Authority (APRA) set a benchmark for investor lending growth at each bank of no more than 10 per cent per annum (Graph 2).[4] Then in March 2017, APRA announced it would require interest-only loans – which are disproportionately used by investors – to be less than 30 per cent of each bank’s new lending. Over the same period, several other measures were implemented, including to tighten up the ways in which banks assessed the ability of borrowers to service their loans, and to limit the share of loans that constituted a large portion of the value of the property being purchased.
Graph 2
Banks responded to these requirements in two key ways. First, for some years now they have been tightening lending standards, thereby reducing the availability of credit to higher-risk borrowers. Second, banks raised interest rates for new and existing borrowers, first on investor loans from 2015, and then on interest-only loans in 2017 (Graph 3). In other words, the banks tightened the supply of credit, most notably for investors.
Graph 3
The FSR presents estimates of the effect of APRA’s first round of regulatory changes from late 2014. The key conclusions of that analysis are that, with the introduction of the 10 per cent investor credit growth benchmark:
the composition of new lending shifted away from investors and towards owner-occupiers, with little change in overall housing loan growth;
and housing prices have grown more slowly in regions with higher shares of investor-owned properties.
So, that’s the story that emphasises the effect of prudential measures on the supply of credit. And, in turn, the effect of tighter credit supply on the demand for housing.
I now want to draw your attention to the story less often told about the important causal link going in the other direction. In particular, the correction in the housing market over the past year or so appears to have been impinging on the demand for credit.
There are a number of reasons for the ongoing adjustment in housing prices:
the aforementioned reduction in the supply of credit;
the large increase in the supply of new housing associated with the high levels of housing construction in Brisbane, Melbourne and Sydney;
weaker demand from foreign buyers due to stricter enforcement of Chinese capital controls and various policy measures in Australia (many of which were implemented by various state governments) that have made it more costly for foreign residents to purchase and hold housing;
and last, but by no means least, the very substantial growth in housing prices over a long period, which had pushed housing prices to record levels as a share of household incomes and raised the prospects for a correction.
In support of this last point, I note that housing prices in Melbourne and Sydney (which had increased by 55 and 75 per cent respectively since 2012) are currently experiencing larger declines than in Brisbane (where housing prices had risen 20 per cent from 2012 to the recent peak; Graph 4).[5] It is also worth noting that housing prices are currently rising in Adelaide and Hobart. In addition, in Melbourne and Sydney house prices had run up further than apartment prices, and it is now house prices that have declined the most.[6]
Graph 4
While there may have been numerous causal factors, after a period of slowing housing price growth, more recently it is clear that housing prices are in decline in a number of major markets. This dynamic would have weighed heavily on the minds of buyers; particularly investors whose only motivation for buying is the return on the asset. An expectation of even a modest capital loss provides a strong incentive for them to delay buying a property, particularly in an environment of relatively low rental yields.
But how can we assess the role of factors affecting credit supply versus those affecting credit demand? Changes in the price of credit – that is, interest rates – can help. Other things equal, a fall in the supply of credit relative to demand can be expected to be associated with higher interest rates on housing loans. In contrast, a fall in the demand for credit (relative to supply) should be associated with a decline in interest rates. Just to be clear, I’m talking about the credit supply and demand curves shifting inwards. The former, by itself, reduces quantities while prices rise as the equilibrium shifts up along the demand curve. The latter, by itself, reduces quantities but decreases prices as the equilibrium shifts down along the supply curve.
So what’s happened to the interest rates borrowers are actually paying? The Securitisation Dataset provides estimates for both owner-occupiers and investors.
There has been a modest broad-based decline in outstanding mortgage rates in the Securitisation Dataset over the year to August (Graph 5). This suggests that banks were responding to weakness in credit demand by competing more vigorously to provide loans to high-quality borrowers. Indeed, looking just at new loans there is some evidence that average variable interest rates declined by more for investors than owner-occupiers, which is consistent with a noticeable decline in the demand for investor credit.
Graph 5
However, compositional changes might also explain why there was a slight decline in interest rates over this period. In particular, the tightening in lending standards has helped to shift the profile of loans away from higher-risk borrowers. This shift would have contributed to the decline in average interest rates paid as better quality borrowers tend to get loans at lower rates. However, it turns out that rates have declined over this period even within the set of low-risk borrowers – for example, those with low loan-to-valuation ratios (LVRs) (Graph 6). So the decline in average rates paid has been driven by factors other than just compositional changes.[7]
Graph 6
While banks began the process of tightening lending standards from around 2015, over the past year or so they have extended these efforts by applying greater rigour to their assessments of the ability of prospective borrowers to service loans. For example, banks have been assessing borrowers’ expenditures more thoroughly, which is likely to have contributed to reductions in the maximum loan sizes offered to borrowers.[8] Notwithstanding these changes, there are two other pieces of evidence that suggest that factors other than just a tightening in constraints on the supply-side have been affecting housing credit and housing market developments over the past year or so:
First, the majority of borrowers had earlier chosen to borrow much less than the maximum amounts offered by lenders. Hence, reductions in the sizes of maximum loans on offer over the past year does not imply one-for-one reduction in credit actually extended.[9]
Second, given that owner-occupiers have lower incomes on average than investors, they are likely to have faced noticeable reductions in maximum loan sizes as a result of the recent tightening in serviceability practices. However, owner-occupier credit growth has remained notably higher than investor credit growth.
In summary, weakness in credit demand – stemming from the dynamics in the housing market – has been a significant development over the past year or so. This is not to say that ongoing weakness of credit supply has not also been at work since then, but that credit supply is not the only part of the story.
Broader developments in the securitisation market
So far I have focused on the prudentially regulated banks. While the non-banks still only account for a modest share of outstanding mortgages, the sector has experienced very strong growth over recent years and is an important source of competition for the banks.
The RMBS market is a major source of funding for the non-bank providers of residential mortgages, and so RMBS issuance provides an indication of the recent growth in this sector. Last year, RMBS issuance was at its highest level since the global financial crisis. Non-banks’ issuance was in line with the high levels issued by this sector in the mid-2000s (Graph 7). In 2018, RMBS issuance in aggregate has been lower, but this has been largely been driven by decreased issuance by banks. Non-banks, by contrast, are continuing to issue close to $4 billion of RMBS per quarter.
Graph 7
This high volume of RMBS issuance by non-banks is consistent with a sizeable increase in their mortgage lending. This is an unsurprising consequence of the tighter supervision and regulation of mortgage lending by banks. This is not to say that non-banks are unregulated. They operate under a licensing regime managed by the Australian Securities and Investments Commission. And, as my colleague Michele Bullock mentioned recently, the members of the Council of Financial Regulators (which includes the Reserve Bank, APRA and ASIC) are monitoring the growth of the non-bank lenders for possible emerging financial stability risks.[10]
The Reserve Bank’s liaison indicates that non-banks have been lending to some borrowers who may otherwise have obtained credit from banks in the absence of the regulatory measures. Consistent with this, the Securitisation Dataset shows that a rising share of non-bank lending has been to investors. Indeed, there has been at least a five-percentage-point increase in the share of investor loans across all outstanding non-bank deals in the Securitisation Dataset over the past two-and-a-half years (Graph 8).[11] This is in contrast to the share of total bank loans to investors, which has been declining over that period.
Similarly, the share of non-bank loans that are on an interest-only basis has been stable over the past couple of years, whereas the share of bank loans that are interest-only has declined significantly over the same period.
Graph 8
The increase in the share of investor housing in deals issued by non-banks is one of the few noticeable changes in the composition of the collateral underpinning RMBS in the past couple of years. Indeed, for deals by non-banks the share of loans with riskier characteristics such as high LVRs or self-employed borrowers has been little changed.
One of the other changes to loan pools in new deals is a fall in seasoning (i.e. the age of loans when the deal is launched). This has been most pronounced for non-banks (Graph 9). It is consistent with non-banks writing a lot more loans. Hence, warehouses of their loans are reaching desired issuance sizes more quickly.
Graph 9
Despite the pull-back in RMBS issuance by the major banks over recent years, the broader stock of asset-backed securities (ABS) on issue increased by around $20 billion over the past 18 months, after remaining broadly stable for the previous 5 years (Graph 10; in addition to RMBS, ABS cover other assets such as car loans and credit card receivables). Demand for these additional asset-backed securities has been driven by non-residents.
Graph 10
As well as a shift in the composition of investors in ABS, we have observed some changes in deal structures over recent years. Of particular note, the average number of tranches per deal has increased from around four to eight (Graph 11). The increase has been broad-based across different types of issuers. This general trend covers deals with a greater number of tranches with differing levels of subordination, as well as deals where the top tranche is split into a number of individual tranches with different characteristics but equal subordination.
Graph 11
We have also seen what might be termed greater ‘specialisation’ of individual tranches. For instance, in recent years the use of one or more tranches with less common features – such as foreign currency, short term or green features – has increased.[12] This increased specialisation is consistent with issuers addressing the needs of different types of investors.
All of these developments point to the evolution of the Australian securitisation market over the past few years, with non-bank issuers playing an increasingly important role and non-resident investors taking an increasing share of issuance.
Benchmark interest rates, RMBS pricing and funding costs
The increase in bank bill swap (BBSW) rates in early 2018 has led to a modest rise in the funding costs of both banks and non-banks.[13] However, the increase in overall funding costs has been a bit greater for non-bank issuers than for banks. This is because banks have a sizeable proportion of their liabilities – such as retail deposits – that do not reprice in line with BBSW rates. Also, the bulk of non-banks’ loans are funded via RMBS issuance, and the cost of issuance has risen by a bit more than BBSW rates (Graph 12). The premium over the BBSW benchmark rate has risen to the level of two years ago. At the margin, these changes mean that non-bank issuers are not able to compete as aggressively on price for new borrowers as banks than was the case a year ago.
Graph 12
Most lenders have passed through modest increases in their funding costs to borrowers over the past few months. Despite these increases, competition for new loans remains strong, and interest rates for new loans are still well below outstanding rates. So credit supply is available to good quality borrowers on good terms and there is a strong financial incentive to shop around.
Interest Rate Benchmarks for the Securitisation Market
One final point I’d like to make on pricing, is that RMBS issuers and investors should be considering the implications of developments in interest rate benchmarks. In light of the issues around benchmarks such as LIBOR (the London Inter-Bank Offered Rate), substantial efforts have been made to reform these benchmarks to support the smooth functioning of the financial system.
BBSW rates are important Australian dollar interest rate benchmarks, and the 1-month BBSW rate is frequently used in the securitisation market. We have worked closely with the ASX and market participants to ensure that BBSW rates are anchored as much as possible to transactions in the underlying bank bill market. However, the most robust tenors are 6-month and 3-month BBSW, which are the points at which banks frequently issue bills to investors. In contrast, the liquidity of the 1-month BBSW market is lower than it once was. This is mainly due to the introduction of liquidity standards that reduced the incentive for banks to issue very short-term paper.
Given this, RMBS issuers should consider using alternative benchmarks.[14] One option would be to reference 3- or 6-month BBSW rates for new RMBS issues. Another option is the cash rate, which is the (near) risk-free benchmark published by the Reserve Bank.[15] Given the underlying exposure in RMBS is to mortgages rather than banks, it could make more sense to price these securities at a spread to the cash rate rather than to BBSW rates, which incorporate bank credit risk.
Issuers and investors globally, including in Australia, should also be prepared for a scenario where a benchmark they are using ceases to be published. In such an event, users would have to rely on the fall-back provisions in their contracts. However, for many products – including RMBS – the existing fall-back provisions would be cumbersome to apply and could generate significant market disruption. This is most urgent for market participants using LIBOR, since the regulators are only supporting LIBOR until the end of 2021. While we expect that BBSW will remain a robust benchmark, it is prudent for users of BBSW to also have robust fall-backs in place. The International Swaps and Derivatives Association (ISDA) recently conducted a consultation on how to make contracts more robust. We would expect Australian market participants to adopt more robust fall-backs in their contracts following this process.
Conclusion
As the housing market undergoes a period of adjustment, it is useful to have an understanding of some of the drivers at play. Much attention has been given to the effect of prudential measures in dampening the supply of credit and how this has affected the housing market. However, it is also important to acknowledge causation going in the other direction, whereby the softer housing market has led to weakness in credit demand. My assessment is that the slowing in housing credit growth over the past year or so is due to both a tightening in the supply of credit and weaker demand for credit. Within that environment, lenders are competing vigorously for high-quality borrowers.
Developments in the RMBS market are consistent with non-bank lenders providing an extra source of supply. While non-banks remain small as a share of total housing lending, developments over the past couple of years show that the sector continues to evolve. The recent increase in issuance spreads may provide some slight headwinds for the sector; however, spreads remain below their levels in early 2016.
Finally, I would urge both issuers and investors to be responsive to the forces affecting benchmarks used to price RBMS and to focus on preparing for the use of alternative benchmarks.
See our show where John and I pose the question, will the central banks simply try to print their way out of a crisis as they did a decade ago, and what the potential consequences may be. This puts Harry’s views into a broader context.
The ACCC says many people are either abandoning their private health insurance policies or downgrading to lower-cost, lower-benefit products as premium increases continue to outpace inflation and wage growth.
In its annual report into the private health insurance industry, the ACCC found Australians are increasingly dropping their hospital cover, instead opting for just extras cover. Many people are also choosing policies with higher excess payments in an attempt to keep policy premiums to a minimum.
“People are increasingly feeling the pinch of private health premium increases and growing gap payments. In response, many are shifting to cheaper products with reduced coverage, and some are dropping their cover altogether,” ACCC Deputy Chair Delia Rickard said.
The affordability of private health insurance has been an increasing concern for consumers in recent years.
Many insurers will be updating their policies ahead of the Australian Government’s private health insurance reforms, which aim to make private health insurance simpler and more affordable, and come into effect on 1 April 2019.
The ACCC is warning private health insurers they must provide clear, prominent and timely communication with customers regarding changes.
“Private health funds have clear obligations not to mislead their customers under the Australian Consumer Law. Failing to properly tell customers about cuts to their benefits or policies may be a breach of the law,” Ms Rickard said.
“Ahead of 1 April 2019, we will be monitoring to see how health funds are telling consumers about changes to their policies and benefits. Private health insurers need to be transparent about what is and isn’t included in their policies or risk losing their customers’ trust and ultimately, their business.”
In 2017–18, consumers paid about $23.9 billion in private health insurance premiums, an increase of almost $834 million or 3.6 per cent from 2016–17.
The amount of hospital benefits paid by health insurers was $15.1 billion and the amount of extras treatment benefits paid was $5.2 billion.
In June 2018, 45.1 per cent of the Australian population held hospital-only or combined health insurance cover, a decrease of 0.9 percentage points from June 2017.
The proportion of the population holding extras-only policies increased from 8.9 per cent in June 2017 to 9.2 per cent in June 2018.
About 88 per cent of in-hospital treatments were delivered with no gap payments.
The average out-of-pocket expenses from hospital treatment increased by 3.3 per cent. Extras treatment recorded a decline of 0.7 per cent.
Consumers are also continuing to shift to lower cost policies with exclusions, or excess and co-payments. In June 2018, 44 per cent of hospital policies held had exclusions, compared with 40 per cent in June 2017. There was also an increase in hospital policies with an excess or co-payment from 83 per cent to 84 per cent.
Complaints to the Private Health Insurance Ombudsman (PHIO) have decreased by 21 per cent since June 2017. The PHIO attributes this to improved complaint handling processes of larger insurers and the smaller premium increases in 2018 compared to recent years.
Despite the decrease, the number of complaints received by the PHIO in 2017–18 is the second highest level recorded over the past five years.
Private health funds must provide accurate disclosures about their policies including any changes to the benefits available under their policies. Funds are not exempt from regulation and can face significant penalties if they breach the Australian Consumer Law (ACL).
Private health insurers and other health industry participants have been the subject of a number of recent ACCC enforcement matters for alleged ACL breaches. The ACCC has recently finalised action against Australian Unity. Enforcement matters involving NIB and Ramsay Health Care are ongoing, and the ACCC’s appeal in the Medibank matter is awaiting judgment.
Background
Each year, the ACCC is required by the Senate to produce a report on key competition and consumer developments and trends impacting on people’s health cover. This report covers the 2017–18 period.
This is the ACCC’s 20th report to the Senate under this order.
The chair of ASIC told the royal commission that ASIC’s strongest message to banks was an expression of disappointment in a press release, via InvestorDaily.
James Shipton, chair of ASIC, was again on the stand during day five of the seventh round of the royal commission and told the commission that ASIC often sent to the banks the strongest message it could.
“We sent the strongest message we could have which was a public expression of disappointment, and also a private expression of disappointment,” said Mr Shipton.
“That is the strongest message you could have sent Mr Shipton?” said Ms Orr.
“That is what I have been advised,” said Mr Shipton.
Mr Shipton was responding to questions from counsel assisting Rowena Orr about the commissions response to NAB’s spot foreign exchange business.
ASIC entered an enforcement undertaking with NAB and it was negotiated that the bank would pay a $2.5 million community benefit and develop a program of changes within its foreign exchange business to prevent, detect and respond to conduct.
It was to be assessed by independent expert Promontory in November 2017, yet the commission heard that by March 2018, Promontory produced a report that it was unable to assess the program.
“Progress in developing the program has been slow. There appears to have been no comprehensive risk assessment across NAB’s spot foreign exchange business against the enforceable undertaking requirements and relevant regulatory standards and guidance,” said Promontory.
It was then decided that, despite the enforceable undertaking requiring it to take action, ASIC gave NAB another three months to deliver the program without any action taken against them for not complying.
Mr Shipton said that it was a reasonable decision and that NAB did face negative consequences for their failure to comply with the undertaking.
“Our approach, we wish our approach was stronger, but we sent the strongest message we could,” he said.
Mr Shipton throughout day 5 continued to assert that ASIC had made mistakes but that it hadn’t failed.
“I prefer mistakes. I use the expression mistakes because failings to me means there has been no success, no functioning and that we haven’t been doing it at all. And we have,” he said.
Another ‘mistake’ of ASICs was to offer infringement notices ahead of litigation, suggested Ms Orr, who questioned why the notices had to be voluntarily entered into by the entity.
“Why do you need to get an indication as to whether they will accept and pay it? The parking inspector doesn’t seek an indication from the person he’s giving a parking fine to as to whether they will accept and pay it,” she said.
Mr Shipton blamed ASICs response on limited resources but said they did not cosy up to the banks.
Mr Shipton said the commission still sought indication from entity’s around infringement notices but that it had changed the mindset around litigation.
“The starting point today would be to ask the question and turn our minds to why not litigate this demonstrable breach,” he said.
Economist John Adams and I discuss our conversations with Author Harry Dent during his recent Australian tour.
Specifically, we pose the question, will the central banks simply try to print their way out of a crisis as they did a decade ago, and what are the potential consequences?
Caveat Emptor! Note: this is NOT financial or property advice!!
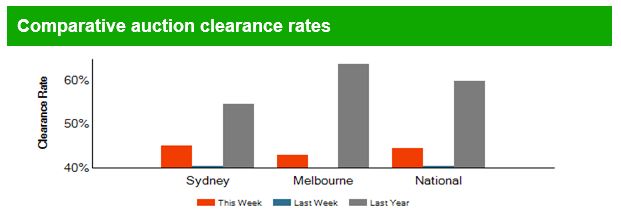
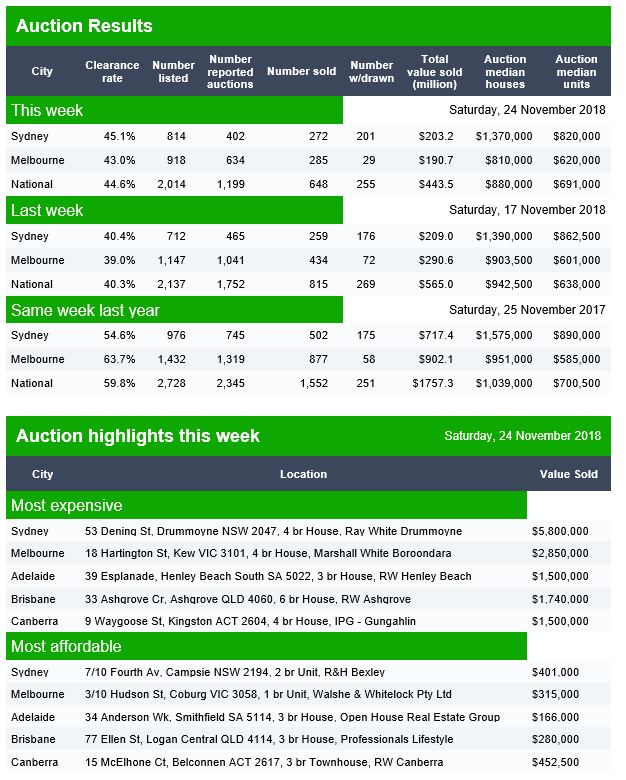
The data from Domain released today shows the preliminary auction clearance results remains stuck in neutral.
Last weeks final results came it at 40.3% with Melbourne at 39%, below Sydney’s 40.4%.
This week so far, Melbourne again looks weaker than Sydney and is likely to fall further as more data comes in. Again we see a significant number of withdrawn properties.
Brisbane reported a provisional clearance rate of 40%, Canberra 46% and Adelaide 62%, all on low volumes. The fuller schedules from Domain are not available at this time.
Welcome to the Property Imperative weekly to 24th November 2018, our digest of the latest finance and property news with a distinctively Australian flavour.
More volatility on the markets this week, more home prices falls, and more revelations from the Royal Commission which put the spotlight on poor culture in the banks and regulators. It’s time to be very cautious in my view.
So let’s get started. Watch the video, listen to the podcast or read the transcript. Caveat Emptor! Note: this is NOT financial or property advice!!
Property listings are skyrocketing according to CoreLogic, with an 11.6% rise in total listings over the last year nationally, but with a 17.4% rise in Sydney and a massive 19.3% rise in Melbourne. New listings are down, so property is sitting on the market for longer and longer, and vendor discounts are rising. Darwin units are seeing discounts of 14.64% and Perth units 10.5%. All signs of a stalling property market.
Sydney has been one of the strongest markets for value growth over recent years however, a big spike in listings and tighter credit conditions has made selling much more difficult. At one point in mid-2015 more than three quarters of properties sold for more than the original list price. Fast forward to the current market and 83.3% of properties are selling for less than the original list price compared to 13.3% selling above the list price. Sydney vendors are now discounting their asking prices by 7.3% on average in order to make a sale, compared with only 5.4% a year ago.
Melbourne is currently seeing 76.3% of properties selling below the original list price which is the highest share in at least 12 years. As recently as April last year, when values were rising at a double-digit annual rate, 34.4% of properties were selling for less than the original list price. By comparison today, only 18.7% of properties have sold over the past three months for more than the original list price and vendors are, on average, discounting their prices by 6.1% to make a sale.
And CoreLogic’s latest home price update revealed their 5-city daily dwelling price index, which covers the five major capital city markets, declined another 0.27% last week, which is the biggest weekly decline of the past year. Prices fell across all the major markets, with Melbourne leading the way down, as expected, with a drop of 0.38%, Sydney down 0.31%, Perth down 0.29%, Adelaide down 0.04% and Brisbane down 0.01%. The falls in Sydney Melbourne and Perth this month are mounting, with Sydney down 0.91%, Melbourne 0.59% and Perth 0.63%.
Remember that Perth has been in the doldrums for years, and while many “property expects” claimed there were signs of a recovery in the West, this is just not true. Through Sydney and Melbourne prices are up compared with a couple of years back, the falls are likely to continue. The declines from the last peak are down 9% in Sydney, 5.4% in Melbourne and 14.7% in Perth.
ANZ said this week “The fall in Sydney housing prices is already the largest in many years. Prices are now 9% below the June 2017 peak, a larger correction than in 2010-11, 2008, 2004-05, 1994-95 and, by the end of this month, the fall will be larger than the 9% fall in 1988–91”. They now think housing prices in Sydney and Melbourne will fall around 15–20% from peak to trough. They link the falls to tighter credit availability, plus additional risks from changes to negative gearing and higher mortgage rates.
And the combined capital city final auction clearance rate saw further weakening last week, with 42 per cent of homes successful at auction; the lowest weighted average result seen since June 2012. The lower clearance rate was across a higher volume of auctions week-on-week with 2,745 capital city homes taken to market, increasing on the 2,386 held the week prior. Both volumes and clearance rates continue to trend lower each week this year relative to the same week’s last year.
Melbourne’s final clearance rate was recorded at 41.3 per cent last week, making it the weakest result the city has seen since June 2012. There were 1,401 homes taken to auction across Melbourne last week, increasing on the week prior when 1,127 auctions were held. One year ago, a much higher 1,732 auctions were held with 66.9 per cent selling.
Sydney’s final auction clearance rate was recorded at 42.8 per cent across 875 auctions last week, increasing slightly from 42.1 per cent across a lower 844 auctions over the previous week. Over the same week last year, 1,061 Sydney homes went to auction and a clearance rate of 54.8 per cent was recorded.
Across the smaller auction markets, Adelaide returned the highest clearance rate of 59 per cent, while Perth saw only 28 per cent of homes successful at auction
The combined capital cities are expected to see a slightly lower volume of auctions this week with CoreLogic currently tracking 2,571 auctions, down from the 2,745 auctions held last week.
Melbourne is the busiest city for auctions again this week, with 1,069 auctions being tracked so far. This week’s volumes are down from the 1,401 auctions held last week and significantly lower than the 1,736 Melbourne homes taken to auction this week one year ago.
Sydney has over 1,000 homes scheduled for auction this week. This is not only an increase on last week’s 875 auctions, but the highest number of auctions the city has seen since March this year. Last year there were a higher 1,215 auctions held across the city over the same week.
Adelaide and Canberra are both expecting a higher volume of auctions week-on-week, while the remaining auction markets have fewer scheduled auctions this week.
S&P Ratings said falling property prices triggered by tightened lending conditions are dominating Australian media headlines. The Australian residential mortgage-backed securities (RMBS) sector so far has been relatively resilient to pressure, with mortgage arrears remaining low and ratings performance stable. The RMBS sector is now facing more elevated risk than it was 12 months ago. Alongside high household debt and low wage growth are emerging risks such as lower seasoning levels in new transactions and increasing competition.
Meantime, looking in the rear-view mirror, Fitch Ratings said that their RMBS index 30+ days’ arrears fell by 4bp quarter on quarter to 1.04% during 3Q18. Fitch Ratings has observed a drop in third-quarter arrears for the previous decade. They say national dwelling prices continued to decline in 3Q18, led by falls in Melbourne, which dropped by 2.33% from the previous quarter, and Sydney, down by 2.11%. The price falls followed tighter lending standards, which restricted new loans and made refinancing more difficult, reducing demand in Australia’s property market. The peak-to-trough decline in Sydney is now 8.2%, which is the second-largest fall in the past 35 years. The largest fall was seen during the last recession in the early 1990s when prices fell by 9.2%.
RMBS transactions rated by Fitch continued to experience extremely low levels of realised losses and a rising lenders’ mortgage insurance (LMI) payment ratio since 4Q12. Excess spread was sufficient to cover principal shortfalls on all transactions during 3Q18.
This is starting to hit the broader economy now, as expected. Home price falls often lead broader economic falls by 12-18 months.
ANZ said momentum slowed further in the September quarter across most of Australia. All states and territories except Tasmania and the Northern Territory decelerated and recorded growth at below their trend rates. The loss of momentum demonstrated by the Stateometer is consistent with their forecast that the Australian economy will grow at a year-ended pace of 2.9% by the June quarter 2019, down from 3.4% in June this year. The slowing, brings into doubt the 3.25% year-ended growth rate forecast by the Reserve Bank for June 2019. Every state, except Tasmania, experienced a drag to momentum from the housing component of the index in the September quarter. The labour market also became less positive for all states and territories except Victoria and the Northern Territory. Trade was a highlight with the mining states of Western Australia and Queensland recording stronger positive contributions as resource prices, export volumes and the AUD/USD exchange rate moved in their favour. In New South Wales and Victoria, which are less commodity intensive but have large service sectors, trade momentum also picked up, suggesting a further boost to tourism and education exports. They concluded that tightening of credit market conditions remains a negative factor that together with a poorer outlook for house prices is pulling back demand in this important sector, especially in New South Wales and Victoria.
And the six-month annualised growth rate in the Westpac–Melbourne Institute Leading Index, which indicates the likely pace of economic activity relative to trend three to nine months into the future, fell from 0.41% in September to +0.08% in October. With this latest slowdown, the Index growth rate continues to point to slowing momentum into the new year. Over the seven months from October last year to April this year the growth rate averaged 0.89%. In the six months since April the growth rate has averaged only 0.19% – a clear step down.
So to the Royal Commission. In Sydney this week, with most time spent on CBA (CEO and Chairperson) and ASIC (Chairperson). A few key areas came into focus including Broker remuneration, where CBA advocated a fix fee model, Front line staff and senior executive remuneration; how the boards looked at risk related issues (often seemingly myopically); the question of vertical integration – especially relating to the question of advice versus sales in wealth management, and oversight and enforcement by regulators.
The core issue was the question of misaligned incentives, which has led to the misconduct thrown into sharp relief in the inquiry. As a result, we would expect to see reform in the areas of broker commissions, front line remuneration, and vertical integration. All significant, and likely to crimp bank performance further.
On brokers, CBA estimated that the average remuneration for a broker writing an average loan would fall from $6,627 to just $2,310. And that CBA would save $197m on a cumulative basis over 5 years. So some would say they are talking their own book! At very least we expect trail commissions to go, and a best interest obligation introduced.
ASIC rightly copped flack, and as a result, we would expect them to be more proactive, demanding larger penalties, perhaps naming and shaming, and more litigation through the courts. Frankly ASIC was too close to the big banks, and has not met its regulatory obligations, and insufficient funding is not a valid excuse. The inquiry also questioned why ASIC needs to discuss the terms of “infringement notices” with banks before they are finalised. “The parking inspector doesn’t seek an indication from the person he’s giving a parking fine to as to whether they will accept and pay it. He just does it. Why don’t you just do that?” Ms Orr asked. “My understanding from the team is that if there is an unwillingness to accept an infringement notice we would just go straight to court,” Mr Shipton said rather weakly.
We will see more next week, when the Melbourne Banks and APRA are up.
As the AFR put it “Kenneth Hayne looks like reshaping the governance of Australia’s leading public companies judging from the line of questioning directed at Commonwealth Bank of Australia chairman Catherine Livingstone and chief executive Matt Comyn. Based on the lines of inquiry pursued by counsel assisting, Rowena Orr, QC, the Hayne governance era looks something like this: verbatim records of conversations held by board and sub-committee members, longer board meetings, more extensive board room information packs, intensive director induction programs, more robust challenging of management, and increased employment of lawyers and accountants as non-executive directors. This would go hand-in-hand with the increased rules and regulations such as those already pushed through parliament covering bank remuneration. The new laws have given greater intervention powers to the Australian Securities and Investments Commission and the Australian Prudential Regulation Authority, both of which will need significantly expanded budgets.
There was nothing here that suggested the lending tightening we have seen will be reversed, which then puts the acid back on the RBA, APRA and Treasury. As we discussed this week, Governor Lowe went public at CEDA with his concern that banks were becoming too risk adverse. See our post “The People’s Gold Will Not Be Kept Among the People”, which also covered the Governors comments on Australia’s gold. All the more reason for effective banking separation in my book!
But the more immediate point is the fact that home prices are tightly locked to accelerating rates of credit growth, – we call this the credit impulse. Even a slowing of the rate of credit growth is more than sufficient to lower home prices, precisely as we see now – so a fall to 5.2% or thereabouts as reported by the RBA is sufficient to drive prices lower. Most Central Bankers just do not understand this critical linkage, preferring to believe that as credit creates assets, increasing debt is a zero sum game – this is just plain wrong!
We updated our scenarios, and you can watch the replay of our recent live stream where we discussed our thinking – the probability of more significant home price falls is rising. Even in the smaller markets. Have no doubt this will have a significant impact on the broader economy. GDP will fall.
Locally, the markets, were all over the place this week, in volatile trading. The S&P ASX 100 rose 0.51% to 4,711, still reflecting recent lows on Friday. The ASX VIX eased a little on Friday down 2.41%, but at 16.55 is still in “fear” territory. The banks did better on Friday, with the S&P ASX 200 Financials up 1.08% to 5,731. AMP was up 1.65% to 2.46, still near the bottom, ANZ was up 2.29% to 26.34, Bank of Queensland was up 0.62% to 9.79, Bendigo was up 1.17% to 10.40, CBA rose 0.95% on Friday, to 71.30, NAB was up 1.03% to 24.48, Suncorp was up 0.67% to 13.49, Westpac was up 1.4% to 26.04, Mortgage Insurer Genworth was up 0.91% to 2.21 and continues in the doldrums. Macquarie Group was up 0.29% to 114.53.
The Australian Dollar US Dollar slid 0.25% to 72.36, still in its trading range, while the bitcoin Aussie fell 10.38% to 5,297 and the Aussie Spot Gold rate fell 0.11% to 1,691.
Stocks on Wall Street ended lower as another tumble in oil prices weighed on energy stocks. The Dow fell 0.73% ending at 24,286, while the broader S&P 500 index lost 0.66% to 2,632. The tech-heavy Nasdaq composite was down 0.48% to 6,939. The volatility index rose 2.74% to 21.37 as the gyrations continue. Trading was light after the Thanksgiving break. The S&P 100 was down 0.84% to 1,161.
The S&P 500 Financials was down 0.91% to 430.5 signalling more weakness in the financial sector, while Goldman Sachs fell 1.86% to 189.02.
Crude oil prices fell more than 7.7% as concerns persisted about a supply glut, down to 50.42. Dow components Exxon Mobil fell 2.7% and Chevron slumped 3.3%.
Helping the sinking sentiment, of course, was the notion that President Donald Trump would successfully prevent OPEC from slashing production when the cartel meets in Vienna on Dec. 6, by using his “no-sanctions trump card” for Saudi Arabia, which has admitted a premeditated murder of journalist Jamal Khashoggi, but denies any involvement by Crown Prince Mohammed bin Salman.
The energy sector has lost 16.5% since the beginning of October, making it the worst performing S&P sector during the period and putting it on pace for its biggest two-month drop since September 2011.
“If we get clarity on any of these – oil prices, trade war with China and the Federal Reserve’s rate of monetary policy tightening – we could go a long way towards making investors comfortable in investing in the market,” one analyst said.
Meanwhile, retail stocks were in focus with Black Friday sales underway. Discounts will continue through to Cyber Monday as investors will look to see if the companies can overcome an underwhelming retail earnings season. Walmart was up more than 1%, but Amazon.com dropped 0.96% to 1,502. Apple fell 2.54% to 172.20 and Intel fell 1.04% to 46.54. Google was also down 1.28% to 1.030.
Cryptocurrency prices slumped on Friday, with Bitcoin falling to a new 14-month low down 6.59% to $4,342, The digital currency is down more than 75% from its peak of $20,000 in 2017. Meanwhile, UK regulators warned investors against digital coin derivatives earlier this week. The Financial Conduct Authority (FCA) could ban some crypto-based derivatives, Christopher Woolard, executive director of strategy and competition at the FCA, said at a crypto event in London. “We’re concerned that retail consumers are being sold complex, volatile and often leveraged derivatives products based on exchange tokens … Given this, the FCA will also consult on a prohibition of the sale to retail consumers of derivatives referencing certain types of cryptoassets (for example, exchange tokens), including contracts-for-difference, options, futures and transferable securities,” Woolard warned.
The US Dollar index was up 0.26% to 96.96. The Euro USD was down 0.61% to 1.13 and the British Pound US Dollar was down 0.47% to 1.28, on more Brexit weakness. Deutsche Bank was down 0.84% to 8.18. Gold was down 0.37% to 1,223.
All this may slow the FED’s drove towards higher rates, with the 3-month rate down 0.02% to 2.41% and the 10-Year rate down 0.48% to 3.05. That said, I expect another couple of hikes, which will put the cat among the pigeons in terms of corporate debt, and funding costs more generally.
We believe there will be further market volatility in the run up to Christmas, and more home price falls locally. Thus we cannot think of any good reason why you would consider buying property in the current climate – best to ignore the spruikers, and so call great mortgage offers, and bide your time. Those with a current mortgage should check to see if better refinanced rates are available, but that will depend on your risk profile. But for some, there are savings to be made (though the Banks may like to hope you are not smart enough to find them!).
And by the way, if you value the content we produce please do consider joining our Patreon programme, where you can support our ability to continue to make great content.