Building sub-contractors worry about tough 2018

From Smart Company.

There could be troubled times ahead for small businesses and contractors working in construction, with property analysts and economists kicking of the year with predictions the residential apartment sector slowdown could cause pain.

“There is absolutely no question we have seen a considerable softening in the construction end of the residential apartment space,” Watpac managing director Martin Monro warned in The Australian today.

While data from the Australian Bureau of Statistics shows new housing starts in the year to September rebounded, experts and industry leaders have been divided in commentary on the state of the sector and what the next 12 months will hold for builders and their suppliers.

Digital Finance Analytics principal Martin North says while it’s not a uniform trend across the country, there are troubling signs on the eastern seaboard in particular.

“What I’m noticing is that those in the construction sector – from small builders to sub-contractors – have significantly lower confidence levels than they did six months ago,” he says.

“Their forward pipeline of work is wilting, especially across Brisbane and Melbourne.  And now I’m seeing it in and around Sydney for the first time.”

And it’s demand for high rise apartments, he says, that is seeing the biggest drop.

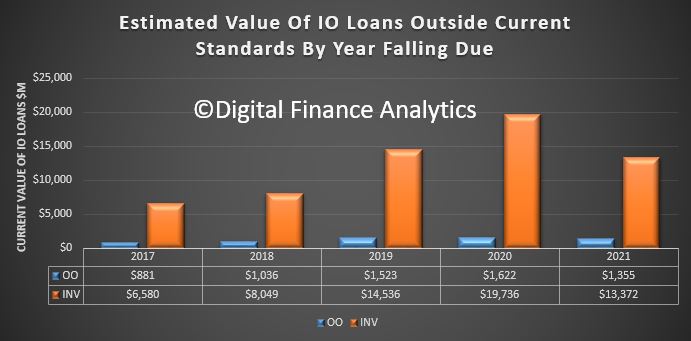
“Investors are quite concerned because capital values look to have stalled and could be reversing.  It’s also much more difficult to get financing now and foreign buyers have defected,” he says.

North says there could be more pain to come in Queensland.

“Brisbane is where the pain is most extreme, but I’m seeing it in and around Melbourne and Sydney now.”

Sub-contractors concerned over risks of non-payment

Weakness in the Brisbane market has already claimed its casualties, with several builders having liquidated in the last year.

Among the 2017 collapses was Queensland One Homes back in August and CMF Projects in June. 

With several other builders having suffered a similar fate, there are fears any continued slowdown could see more sub-contractors not getting paid. Those working as contractors in the building space are worried more pain could be to come this year.

“The industry is a shambles and is overseen by an inept QBCC who are hamstrung by poor legislation,” says Subbie United’s John Goddard.

Goddard claims sub-contractors have a difficult time recovering what they owe in the event a building company collapses.

“You then have pre-insolvency advisors telling these builders how to hide assets before they recommend a friendly liquidator to defeat creditors who are in the main, subbies.”

Housing a cyclical industry

However, small business ombudsman Kate Carnell says while weakness exists in some parts of the building sector, small businesses and contractors should not be alarmed.

“The thing about the industry is it’s cyclical.  There’s big ups and downs and that’s how it works. And in some places there’s an oversupply in that space,” she says.

“But if you look at some of the figures around new home starts, there’re looking pretty good and strong.  There’s still a dearth of new homes in the markets as we’ve got quite strong population growth.”

Aussie Bank Profitability to Come Back Under Pressure

Australian banks’ profit growth is likely to slow in 2018 as global monetary tightening pushes up funding costs, loan-impairment charges rise, and tighter regulation has an impact on business volumes and compliance costs. Fitch Ratings maintains its negative sector outlook to reflect these pressures.

Australian banks are more reliant on offshore wholesale funding than global peers, as the superannuation scheme has created a lack of domestic customer deposits. Global monetary tightening could therefore push up banks’ funding costs. That said, the impact is likely to be contained by banks’ hedging of foreign-currency borrowing back to Australian dollars, while only a portion of the wholesale funding is refinanced each year. Meanwhile, improved liquidity should mitigate the risks associated with dependence on wholesale funding.

Loan-impairment charges fell close to record lows in 2017, which is one reason why profit growth held up better than we had expected. However, impairment charges are likely to increase this year, with asset quality still being challenged in some sectors and regions. At the same time, write-backs from previously impaired assets are likely to fall. Implementation of the Australian equivalent of IFRS9 might also result in higher provisioning charges.

Despite the headwinds, the major Australian banks are likely to remain more profitable than most international peers, owing largely to dominant domestic market positions that give them strong pricing power.

The main risks to banks’ performance stem from high property prices and household debt. We forecast house prices to rise modestly this year. Moreover, the proactive approach by regulators to address household debt risks – such as a tightening of underwriting standards and restrictions on investment mortgages and interest-only loans – should offer some protection to banks’ asset quality in the event of a housing market downturn.

Nevertheless, Australian banks are more highly exposed to residential mortgages than international peers, while households could be sensitive to an eventual increase in interest rates or a rise in unemployment, given that their debt is nearly 200% of disposable income. A significant deterioration in asset quality in the mortgage sector could undermine bank profitability and weaken capitalisation, although this is not our base case.

Are US Rates Going Higher?

The 10-Year US Bond yield is moving higher.  This is important because it has a knock-on effect in the capital markets and so Australian Bank funding costs, potentially putting upward pressure on mortgage rates.

Whilst the US Mortgage rates were only moderately higher today, the move was enough to officially bring them to the highest levels since the (Northern) Spring of 2017.

So this piece from Moody’s is interesting.  Is the markets view that rates won’t go higher credible?

Earnings-sensitive securities have thrived thus far in 2018. Not only was the market value of U.S. common stock recently up by 4.5% since year-end 2017, but a composite high-yield bond spread narrowed by 23 basis points to 336 bp. The latter brings attention to how the accompanying composite speculative-grade bond yield fell from year-end 2017’s 5.82% to a recent 5.72% despite the 5-year Treasury yield’s increase from 2.21% to 2.39%, respectively.

Thus, the latest climb by the 10-year Treasury yield from year-end 2017’s 2.41% to a recent 2.62% is largely in response to the upwardly revised outlook for real returns that are implicit to the equity rally and the drop by the speculative-grade bond yield. The 10-year Treasury yield is likely to continue to trend higher until equity prices stagnate, the high-yield bond spread widens, interest-sensitive spending softens, and the industrial metals price index establishes a recurring slide. In view of how the PHLX index of housing sector share prices has risen by 4.5% thus far in 2018, investors sense that home sales will grow despite the forthcoming rise by mortgage yields.

Moreover, increased confidence in the timely servicing of home mortgage debt has narrowed the gap between the 30-year mortgage yield and its 10-year Treasury yield benchmark from the 172 bp of a year earlier to a recent 152 bp. The latter is the narrowest such difference since the 150 bp of January 2014, which roughly coincided with a peaking of the 10-year Treasury yield amid 2013-2014’s taper tantrum.

Do suppliers of credit to the high-yield bond market and mortgage market correctly sense an impending top for benchmark Treasury yields? If they are wrong and the 10-year Treasury yield quickly climbs above its 2.71% average of the six-months-ended March 2014, they will regret having acquiesced to the atypically thin spreads of mid-January 2018.

Softer property could weaken Aussie equities

From InvestorDaily.

Although global equity markets are looking strong for 2018, local equities may be hurt by troughs in the domestic property market, says Tribeca Investment Partners.

According to Tribeca Investment Partners portfolio manager Sean Fenton, there is mounting evidence that the Australian housing cycle has already reached its peak, further reinforced by APRA’s efforts in curbing mortgage lending.

“A heavily indebted household sector that is experiencing flat to negative real income growth, as well as dealing with higher energy and healthcare costs, and which has drawn down its savings rate, is unlikely to fill the gap in growth,” Mr Fenton said.

“Further downside risk to the economy may emerge if the current tightening in mortgage lending standards pushes house prices lower and generates negative equity effects.”

With global markets encouraged by “easy monetary conditions”, central banks would be unwilling to make any sudden moves and lower the interest rate too quickly, “particularly as inflation has remained quiescent”.

“This provides fertile ground for equity markets to rally, but also creates an environment of heightened risk as areas of stretched valuation become more apparent,” Mr Fenton said.

Tribeca would continue to underweight sectors sensitive to the interest rate as well as increase its underweight to the building materials, retail and property development sectors.

“Domestically, we are positioned more defensively in gaming, select industrials and a small overweight to banks,” Mr Fenton added.

Bank Profits and the Yield Curve

From The Bank Underground.

The conventional wisdom amongst financial market observers, academics, and journalists is that a steeper yield curve should be good news for bank profitability.   The argument goes that because banks borrow short and lend long, a steeper yield curve would raise the wedge between rates paid on liabilities and received on assets – the so-called “net interest margin” (or NIM).  In this post, we present cross-country evidence that challenges this view.  Our results suggest that it is the level of long-term interest rates, rather than the slope of the yield curve, that drives banks’ NIMs.

Net interest margins are calculated as the interest banks earn on their assets—e.g. on the loans they make — minus the interest they pay out on their liabilities – e.g. the interest they pay to savers.  Meanwhile, the slope of the yield curve is defined as the difference between the long-term interest rate (10 year government bond) and a short-term rate.

The conventional wisdom follows from  banks’ fundamental business model— to act as maturity transformers by borrowing short term (e.g. from deposit accounts) and lending long term (e.g. through mortgages or loans to companies).  This activity is typically profitable as short-term interest rates are usually lower than long- term interest rates. This reflects the fact that depositors are generally willing to sacrifice returns because they value the liquidity of holding their money in cash rather than in an illiquid investment. Figure 1 illustrates this with the aid of a stylised yield curve.  In the example, a bank issues a loan at 3.5%, matched with bank deposits of shorter maturities offering an interest rate of 1%.  If the long rate rose to 5%, it would steepen the yield curve, increase the interest rate spread between lending and borrowing, and increase the NIMs.

It is worth noting that we wouldn’t expect this theoretical relationship, between the slope of the yield curve and NIMs, to hold perfectly in the real world.  For example, NIMs capture much more than just the gains of maturity transformation. For example, NIMs also reflect the rewards banks collect for bearing different types of risk (e.g. credit risk).

Stemming from this understanding of maturity and liquidity transformation Bill English  observes that this intuitive positive relationship has been the conventionalwisdom for some time.

We find no systematic positive relationship between the slope of the yield curve and NIMs

However, a very simple plot of the slope of the yield curve and the NIM does not deliver a positive relationship (Figure 2).  Instead, the slope goes the wrong way – it is negative for the UK confirmed by a simple regression – suggesting that an increase in the slope of the yield curve lowers the NIM. Indeed Table 1 (below) shows that this negative relationship arises in all countries in our sample bar the US, a point observed by a Liberty Street Economics blog post.

It is worth noting that in recent decades the countries in our sample have been through large economic, structural and policy changes, such as the introduction of inflation targeting, and changes in competition, financial liberalisation and regulation. These changes no doubt will have some impact on the slope of the yield curve and its relationship with NIMs, but those are beyond the scope of this article.

2) So how do interest rates affect NIMs?

Motivated by this discovery, we sought to inspect how the individual components of the slope of the yield curve (the short and long rate) affect NIMs. We find that the long rate is more important than the short rate in determining NIMs in a very simple regression model.  The long rate has a higher coefficient and is statistically significant for most countries.  The short rate is closer to zero and is insignificant for most countries, apart from Italy and Spain. Overall though, we find that a steepening of the yield curve is generally associated with a fall in the NIM (Table 1).

From this we conclude that, when it comes to interest rates, the long-term interest rate (unlike the short-term interest rate and the slope of yield curve) has a substantial positive impact on bank NIMs.  This finding helps to explain why an upwards parallel shift in the yield curve is good for net interest margins (because while the slope does not change the long rate goes up).  It is worth remembering that the results are driven by the average maturity and composition of assets and liabilities of bank balance sheets.  If the structure of their balance sheets changes, so too might these results.

What do these findings tell us about the past and the future?

The long rate in many economies has fallen gradually over time since the late 1980s.  Our simple empirical results suggest that there would be a corresponding fall in bank NIMs.  Figure 3 shows that while that relationship held in the UK prior to the financial crisis, it appears to have broken down since – as the NIM has flattened out in recent years, despite the continued fall in the long rate.  This isn’t just a UK phenomenon — NIMs in other countries have remained relatively stable since the global financial crisis too, despite falling long-term interest rates in these economies (Figure 4).  This may be because of the large macroeconomic and financial shocks that affected banks, or because banks have changed their business models and the structure of their balance sheets.  This is beyond the remit of this article. In light of this caveat it is hard to say with certainty whether this observed relationship between long rates and NIMs will reinstate itself or not; it is too early to tell.

Conclusions

Some central banks, such as the Fed and the Bank of England, have started the tightening phase of monetary policy, which has been associated with a steepening of the yield curve.  The commonly held view is that such a steepening of the yield curve should be unequivocally good news for bank profitability because it raises banks’ net interest margins.  This article challenges that conventional wisdom.  Using data for a panel of 10 countries over four decades, we find no systematic positive relationship between the slope of the yield curve and bank net interest margins.  Instead, we find that long-term interest rate tend to drive bank margins.  But even this latter relationship has weakened since the global financial crisis.  This suggests there is much uncertainty about the future relationship between interest rates and bank profitability.

Note: Bank Underground is a blog for Bank of England staff to share views that challenge – or support – prevailing policy orthodoxies. The views expressed here are those of the authors, and are not necessarily those of the Bank of England, or its policy committees.

ANZ and ASIC reach settlement on suspected third party frauds

ANZ today announced it is filing joint court submissions with the Australian Securities and Investments Commission (ASIC) on an agreed settlement for a number of cases where car finance brokers or dealers engaged in suspected fraud when submitting loan applications on behalf of customers to Esanda between 2013 and 2015.

In a statement of agreed facts, ANZ acknowledged it did not take reasonable steps to verify customers’ financial situation in relation to 12 loan contracts in circumstances where there was reason to doubt the information being provided by third party intermediaries.

The third party intermediaries involved in these cases were: United Financial Services Pty Ltd trading out of the Best Buys Auto car dealerships; Motorcycle Finance and Insurance Pty Ltd; and Combined Motor Traders Pty Ltd.

ANZ detected and reported the suspected fraudulent conduct by these third party intermediaries. ANZ has disaccredited the individuals responsible for submitting the 12 loan contracts and no longer accepts loan applications from them.

Commenting on the agreed settlement, ANZ Group Executive Australia Fred Ohlsson said: “ANZ has worked closely with ASIC on its investigation of this matter. We take our responsible lending obligations seriously and we have since taken steps to strengthen our ability to prevent and detect fraud by third parties.”

Since reporting the issue, ANZ has significantly increased both the supervision and training of asset finance brokers.

ANZ has agreed to pay a $5 million fine as part of the settlement and $390,000 of ASIC’s costs. This is subject to court approval. ASIC acknowledged ANZ’s cooperation throughout the investigation.
ASIC has also reviewed ANZ’s proposed approach to remediating approximately 320 customers who took out car loans through these three intermediaries (between 2013 and 2015), with the total remediation amount expected to be around $5m.

Employment Wobbles In December

The latest ABS data on employment to December 2017, shows the trend unemployment rate decreased slightly to 5.4 per cent in December 2017, after the November 2017 figure was revised up to 5.5 per cent.  The trend unemployment rate was 0.3 percentage points lower than a year ago, and is at its lowest point since January 2013.

The seasonally adjusted number of persons employed increased by 35,000 in December 2017. The seasonally adjusted unemployment rate increased by 0.1 percentage points to 5.5 per cent and the labour force participation rate increased to 65.7 per cent.  The number of hours worked fell.

By state, trend employment rose in NT, WA and SA.  Over the past year, all states and territories recorded a decrease in their trend unemployment rates, except the Northern Territory (which increased 1.6 percentage points). The states and territories with the strongest annual growth in trend employment were Queensland and the ACT (both 4.6 per cent), followed by New South Wales (3.5 per cent).

The ABS says monthly trend full-time employment increased for the 14th straight month in December 2017. Full-time employment grew by a further 17,000 persons in December, while part-time employment increased by 8,000 persons, underpinning a total increase in employment of 25,000 persons.

“Full-time employment has now increased by around 322,000 persons since December 2016, and makes up the majority of the 393,000 net increase in employment over the period,” the Chief Economist for the ABS, Bruce Hockman, said.

Over the past year, trend employment increased by 3.3 per cent, which is above the average year-on-year growth over the past 20 years (1.9 per cent). The last time it was 3.3 per cent or higher was in September 2005.

The trend monthly hours worked increased by 4.0 million hours (0.2 per cent), with the annual figure also reflecting strong growth over the year (3.6 per cent).

The labour force participation rate remained at 65.5 per cent after the November 2017 number was revised up, the highest it has been since March 2011. The female labour force participation rate also increased to a further historical high of 60.4 per cent, having increased steadily over the past year.


Trust In Banks May Be Improving, But Its Still Below Average In Australia

The ABA released new research today – The Edelman Intelligence research conducted late last year which tracks community trust and confidence in banks. Whilst progress may being made, the research shows Australian banks are behind the global benchmark in terms of trust.

The ABA, of course accentuates the positive!

Based on the Annual Edelman Trust Barometer study released in January 2017, Australia remains 4 points behind the global average. Hence, while there is more work to be done to increase trust in the sector, Australians acknowledge that the banking industry is a well-regulated industry that is more stable than many of its international counterparts in Europe. Overall, the two percentage point year on year increase in trust from 2016 to 2017 in the Financial Services sector, and the increment in Australians’ trust from the June 2017 study, has demonstrated a positive shift from ‘distrusted’ to ‘neutral’.  This ‘neutral’ trust indicates that the industry sits above trust in business, media and Government, all of which are distrusted.

The ABA says this new report shows a significant improvement in the perceptions of banks since the first research report published six months ago.

Nearly 80 per cent of people believe that their bank is becoming more customer focused, up from 63 per cent, and 86 per cent believe that banks help customers to make decisions in their own interest, up from 74 per cent.

Customers’ level of trust in their own bank and their perception of the industry overall has also improved.

Australian Bankers’ Association Deputy Chief Executive Officer, Diane Tate, said the results were encouraging and showed that the significant efforts made by the banks to respond to customer expectations and rebuild trust with the community is making banking better.

“Although there’s still a long way to go to restore trust and confidence in the industry, it’s encouraging that the impact of these reforms is being recognised by customers and making an impact on the ground,” Ms Tate said.

“The banks recognised that they needed to change and began undertaking the largest program of reforms in decades.

“This new research is a sign that more customers are experiencing the benefits of change in the way banks conduct their business.

“Through the Banking Reform Program – Better Banking, banks have been changing their practices to be more transparent and make it easier for individuals and small business to do their banking,” she said.

The research shows that awareness of each of the reforms has increased, in particular initiatives to improve how banks manage complaints and compensate customers when mistakes are made.

Strengthening the Code of Banking Practice has again been identified as one of the most important initiatives to drive trust. The new Code was lodged late last year with ASIC and currently awaits approval.

Other factors identified by the research as important factors in change were confidence and transparency in banking, while supporting customers experiencing financial difficulty and removing individuals for poor conduct has increased in importance for customers. Other key findings in the research include:

• 55 per cent of people believe their bank is more interested in what’s good for customers, up from 44 per cent.

• The level of importance that Australians place on the reforms remains strong, with half the initiatives scoring 70 per cent or higher.

Edelman surveyed 1,000 Australians in November 2017 following the first round of research conducted in May 2017, which set benchmarks for the industry to assess the impact of its Banking Reform Program.

Will Your Interest Only Loan Get Refinanced?

The Australian Financial Review featured some of our recent research on the problem of refinancing interest only loans (IO).  Many IO loan holders simply assume they can roll their loan on the same terms when it comes up for periodic review.  Many will get a nasty surprise thanks to now tighter lending standards, and higher interest rates.  Others may not even realise they have an IO loan!

Thousands of home owners face a looming financial crunch as $60 billion of interest-only loans written at the height of the property boom reset at higher rates and terms, over the next four years.

Monthly repayments on a typical $1 million mortgage could increase by more than 50 per cent as borrowers start repaying the principal on their loans, stretching budgets and increasing the risk of financial distress.

DFA analysis shows that over the next few years a considerable number of interest only loans (IO) which come up for review, will fail current underwriting standards.  So households will be forced to switch to more expensive P&I loans, assuming they find a lender, or even sell. The same drama played out in the UK a couple of years ago when they brought in tighter restrictions on IO loans.  The value of loans is significant. And may be understated.

A few observations. ASIC in 2015, released a report that found lenders providing interest-only mortgages needed to lift their standards to meet important consumer protection laws. They identified a number of issues relating to bank underwriting practices. We would also make the point that despite the low losses on interest-only loans to date in Australia, in a downturn they are more vulnerable to credit loss.

In April this year we addressed the problem of IO loans.

Lenders need to throttle back new interest only loans. But this raises an important question. What happens when existing IO loans are refinanced?

Less than half of current borrowers have complete plans as to how to repay the principle amount.

Interest-only loans may seem like a convenient way to reduce monthly repayments, (and keep the interest charges as high as possible as a tax hedge), but at some time the chickens have to come home to roost, and the capital amount will need to be repaid.

Many loans are set on an interest-only basis for a set 5-year or 10-year  term, at which point the lender is required to reassess the loan and to determine whether it should be rolled on the same basis. Indeed, the recent APRA guidelines contained some explicit guidance:

For interest-only loans, APRA expects ADIs to assess the ability of the borrower to meet future repayments on a principal and interest basis for the specific term over which the principal and interest repayments apply, excluding the interest-only period

There is a strong correlation between interest-only and investment mortgages, so they tend to grow together. Worth reading the recent ASIC commentary on broker originated interest-only loans.

But if households are not aware they have IO loans in the first place, then this raises the systemic risks to a whole new level. The findings from the follow-up study by UBS, after their “Liar-Loans” report (using their online survey of 907 Australians who recently took out a mortgage – they claim a sampling error of just +/-3.18% at a 95% confidence level) are significant.

They say their survey showed that only 23.9% of respondents (by value) took out an interest only loan in the last twelve months. This compares to APRA statistics which showed that 35.3% of loan approvals in the year to June were interest only.

They believe the most likely explanation for the lack of respondents indicating they have IO mortgages is that many customers may be unaware that they have taken out an interest only mortgage. In fact, around 1/3 of interest only borrowers do not know that they have this style of mortgage.


So You Want To Be An International Financial Centre?

From The Bank Underground.

The UK has a comparative advantage in financial services. But specialisation in this activity brings with it the challenge of the large gross capital flows that are linked to financial services exports.

The modern financial services industry allocates global capital flows through its balance sheets. Crudely speaking, profits correspond to a percentage over the value of flows, especially (volatile) banking flows, as banks arbitrage between assets and liabilities in different countries.

The chart captures this relationship by comparing the assets generated by banking flows (relative to GDP) – a measure of financial openness – with financial services exports (also relative to GDP). Countries which host international financial centres (the green dots in the chart), such as London for the UK (the red dot), are amongst the most open in the world.

Crucially, the chart is not capturing a mechanical effect. In the UK, for example, only one sixth of the statistical estimate for financial services exports is derived indirectly from international investment position statistics. The bulk of it is obtained from surveys conducted with banks. The estimate is also not affected by recent revisions to the UK national accounts.

International financial centres are compensated for providing essential financial services to the rest of the world. But the flipside is the need to absorb and manage the potential risks from volatile capital flows.

Note: Bank Underground is a blog for Bank of England staff to share views that challenge – or support – prevailing policy orthodoxies. The views expressed here are those of the authors, and are not necessarily those of the Bank of England, or its policy committees.