Top 20 Fund Managers By Country

Following this mornings data on the top 500 Fund Managers, which has passed US$80 trillion under management in 2016 (contained in the 2017 report) and which helps to explain the inflated asset prices of property and the stock market; it is worth looking at the country break down by percentage of funds under management, all stated in US$.

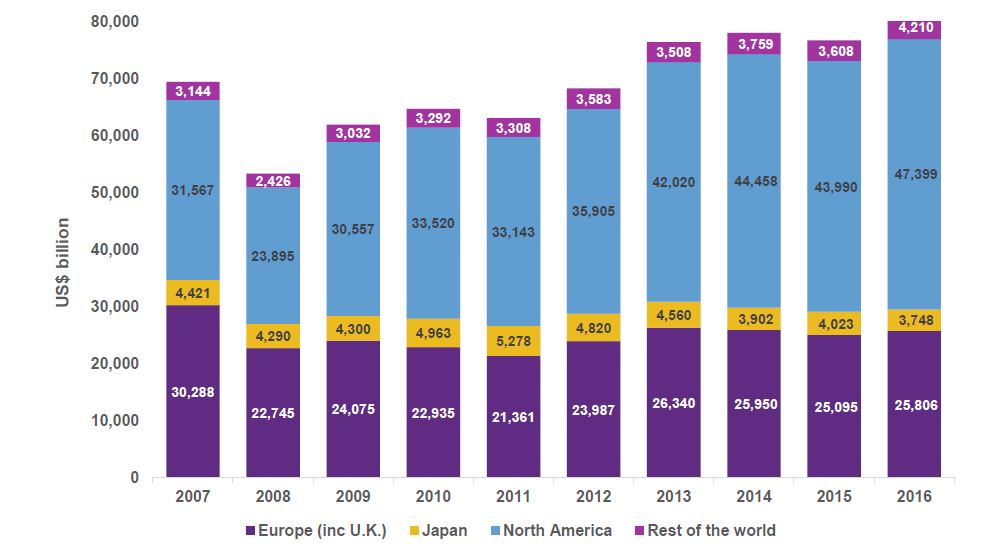
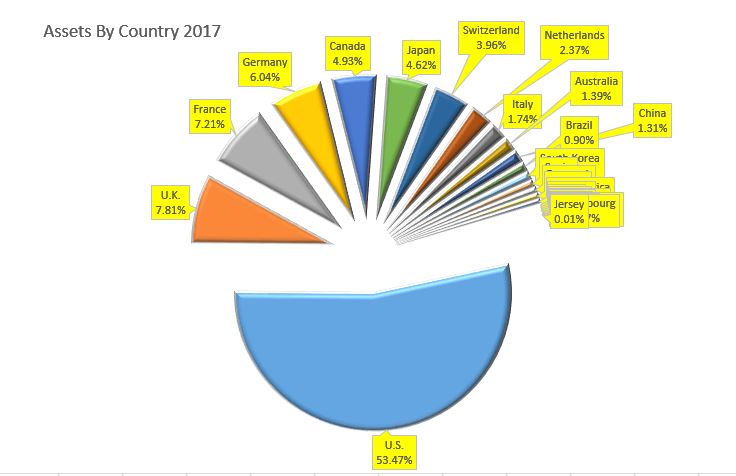
More than half of assets are held by managers in the USA, followed in descending order by UK, France, Germany, Canada and Japan. Australia has 1.39% of assets, but that may be overstated as this includes Macquarie who has more business off shore than on shore.

Here are the top 20 globally, by manager. Black Rock is by far the largest.

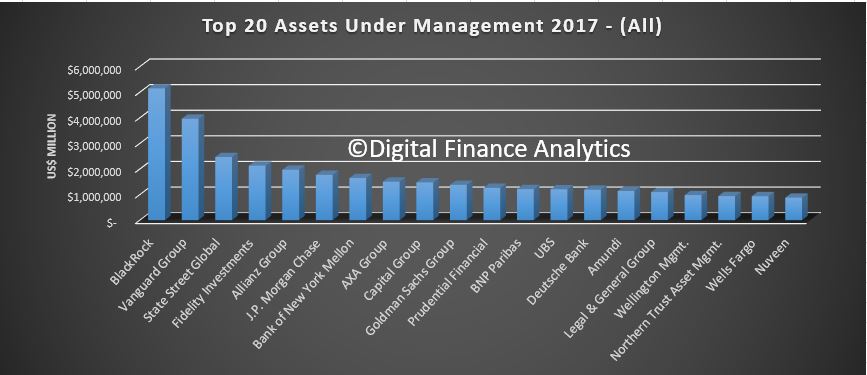
Here are the top 20 from the USA.

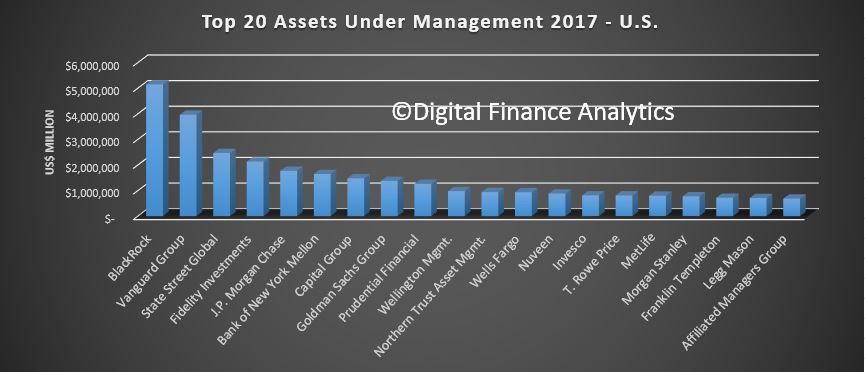
Here are the top 20 from the UK.

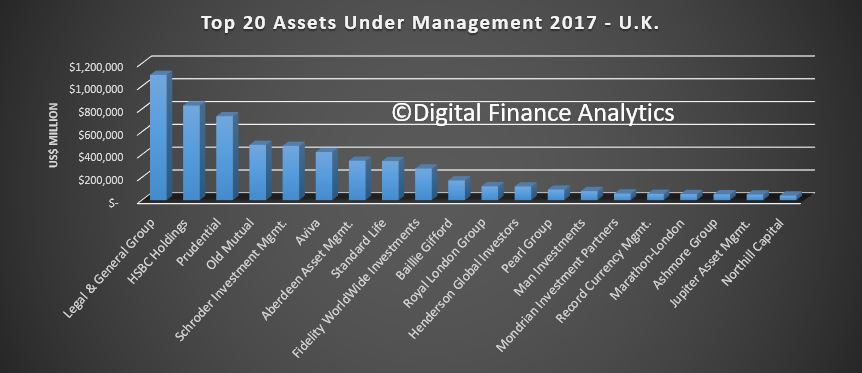
Switzerland is dominated by funds managed by UBS.

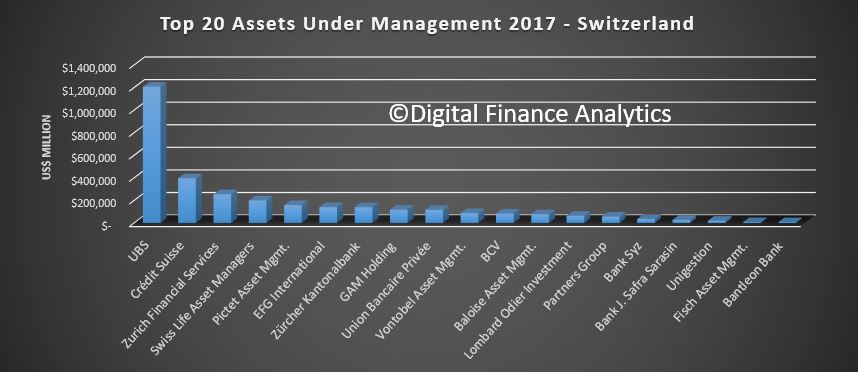
Here are the Australian top 20.

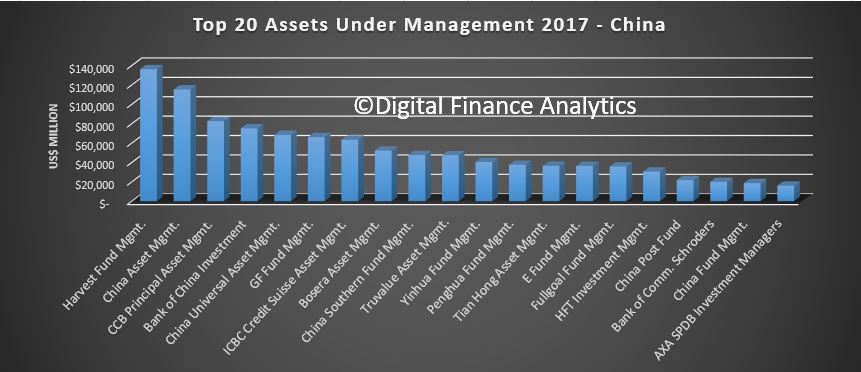
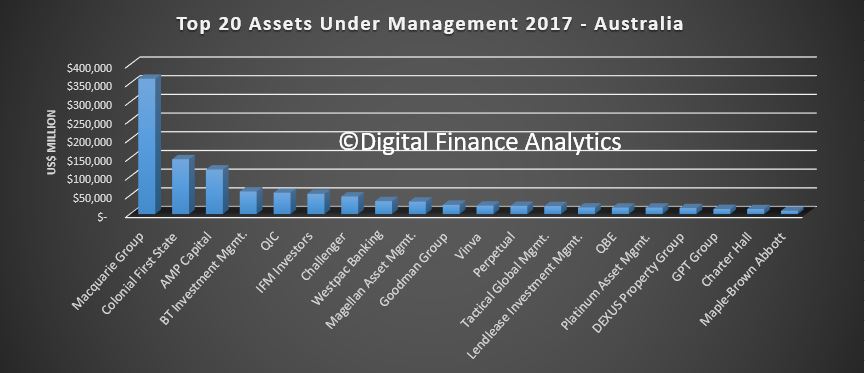
Finally, here is the China footprint – given the wealth accumulation there, I have little doubt they will be overtaking Australia, and moving well up the rankings in the years ahead.


Bendigo and Adelaide Bank Feel The Cold Hand Of The Regulator

Bengido and Adelaide Bank’s CEO provided a brief trading update as part of the FY17 AGM. There are some interesting comments on the FY18 outlook.

First they have been forced to “slam on the breaks” on mortgage lending to ensure they comply with APRA’s limits on interest only loans and investor loans. As a result their balance sheet will not grow as fast as previously expected.

On the other hand, this should help them maintain their net interest margins, their previous results had shown a steady improvement and strong exit margin.  They are forecasting 2.34%.

The recent ATM fee changes will have a negative impact, with costs rising ~2% although the amount is not stated from their ~1,700 ATM’s.

Finally, the slower loan book growth means they will be in a better capital position, and will be able to meet APRA’s “unquestionable strong” metric, on a standard basis, and perhaps 50 basis points above. The journey towards advanced accreditation appears still uncertain, but they believe there will be a more “level playing field”.

ADI’s Still Doubling Down On Mortgages

The APRA ADI data released today to September 2017 shows that owner occupied loan portfolio grew 0.48% to $1.03 trillion, after last months fall thanks to the CBA loan re classifications. Investment lending grew just a little to $550 billion, and comprise 34.8% of all loans. Overall the loan books grew by 0.3% in the month.

This confirms our view that last months results were more to do with CBA’s changing their loan classification, rather than macroprudential biting.  The relative mix of investment loans did fall a little, so you could argue the tightening of interest only loans did help.

Overall market shares were pretty static with CBA still the largest owner occupied loan lender and Westpac the largest investment property lender.

The 12 month loan growth for investor loans is well below the 10% speed limit imposed by APRA, and all the majors are below the threshold.

We see some significant variations in portfolio flows, with CBA, Suncorp, Macquarie and Members Equity bank all reducing their investment loan balances, either from reclassification or refinanced away. The majors focussed on owner occupied lending – which explains all the attractor rates for new business. Westpac continues to drive investor loans hard.

Comparing the RBA and APRA figures, it does appear the non-banks are lifting their share of business, as the banks are forced to lift their lending standards. But they are still fighting hard to gain market share, which is not surprising seeing it is the only game in town!


Lending In Sept 2017 Still Fixated On Housing

The RBA has released their financial aggregates to September 2017.  The data confirms the growth is still in the mortgage sector, with both owner occupied and investment lending growing quite fast, significantly faster than productive business lending. So expect to see household debt rise still further. The settings are just not right to create sustainable economic growth, rather they still support a debt driven property splurge.

There was a significant volume of loans switched in the month – $1.4m are shown in the aggregates table, but are corrected in the growth tables, which is why investor lending is reported more strongly there.

Overall lending for housing rose 0.5% in the months, or 6.6% for the year, which is higher than the 6.4% the previous year. Personal credit rose slightly in the month and down 1.% in the past year.  Lending to business rose just 0.1% to 4.3% for the year, which is down from 4.8% the previous year.

Owner occupied lending grew $5.5bn or 0.5% to $1.11 trillion while investment lending rose $1.9% or 0.3% to $583 billion. Lending to business rose just $0.3 billion and personal credit rose $0.3 billion or 0.2%, the first rise since February 2017.

The share of investment lending remained at 34.3% of lending for housing, while the share of all lending to business fell to 32.7%.

Looking at the adjusted RBA percentage changes we see that over the 12 months investor lending is still stronger than owner occupied lending, both of which showed a slowing growth trend, while last month growth in business lending continued to ease.

The RBA noted that:

Following the introduction of an interest rate differential between housing loans to investors and owner-occupiers in mid-2015, a number of borrowers have changed the purpose of their existing loan; the net value of switching of loan purpose from investor to owner-occupier is estimated to have been $59 billion over the period of July 2015 to September 2017, of which $1.4 billion occurred in September 2017. These changes are reflected in the level of owner-occupier and investor credit outstanding. However, growth rates for these series have been adjusted to remove the effect of loan purpose changes.

The Next Round In The Payments Wars

The Commonwealth Bank, Westpac, and National Australia Bank are working together to build the next generation of mobile payments and wallets in Australia.  These banks are not offering the Apple Pay solution, unlike ANZ. They sought unsuccessfully  to negotiate collectively with Apple in order to gain access to the iPhone’s near-field communications (NFC) chip which would allow their own apps to make contactless payments.

The first initiative of the new joint venture will be the development of a payment app that will enable instant payments for all Australians, including small businesses, regardless of who they bank with.

Beem will be a simple and convenient free app enabling anyone to make an instant payment using their smartphone, and request payment from someone who owes them money or to split a bill. The hope is that it will become an industry-wide payment solution, and is open to interest from other banks, industry, and retail players.

Beem will work on both iOS and Android smartphones, and will be compatible across devices and different banks – users won’t need to be customers of CBA or Westpac or NAB.

Commonwealth Bank Group Executive of Retail Banking Services, Matt Comyn, said Beem will give Australians a simpler way to pay and request payments, a pain point for both consumers and small businesses.

“Two thirds of small businesses say they are owed money for completed work, with around $7,300 owed to small traders. Beem will give small businesses a cost effective and easy way to collect payments instantly and on the go for their goods and services, without having to take the larger leap into using merchant credit facilities, or issuing invoices to be paid later,” Mr Comyn said.

Beem will benefit from bank level security and encrypted user account information. Every transaction will be authenticated and subject to real-time fraud monitoring.

Westpac Chief Executive, Consumer Bank, George Frazis, said Beem expands payment choices for customers, and is the latest offering in Australia’s long history of innovative payment solutions, including EFTPOS, Pin@POS, chip, tap and pay, and wearable payment devices.

“We are committed to giving our customers more choice by supporting a range of convenient ways for them to pay and transfer their money. Customers will soon be able to ‘Beem’ free payments instantly using any smartphone, regardless of who they bank with and without the need to add account details.

Innovations such as Beem and wearables are leading the way in payment solutions because they’re convenient, easy to use, and fit in with people’s lifestyles – we firmly believe in going to where our customers are and providing them with greater choice,” Mr Frazis said.

NAB Chief Operating Officer, Antony Cahill, said the bank is continually looking for opportunities to make banking easier, simpler, and more convenient for its customers, both consumers and businesses.

“Think about all the times you’ve gone out for dinner and split the bill – this app will make it easy for Australians to pay their family and friends instantly. Or, when you go to the local market and need to pay the butcher – this means instant payment through your phone. This is the industry working together to deliver an innovative payments solution, no matter who you bank with,” Mr Cahill said.

Commonwealth Bank is currently conducting user testing of a Beem prototype, with the app to be available for download on iOS and Android smartphones later this year.

Beem will initially have a sending limit of $200 a day ($6,000 per month), with a monthly receiving limit of $10,000 as an initial risk control measure.

Beem will be available to all bank customers and small businesses that hold a global scheme debit card issued by an Australian Authorised Deposit-taking Institution (ADI).

The joint venture will be independently run, with a mandate to actively seek new participants to join the initial three participants. Future product initiatives beyond the payments facility are being planned, including digital wallet features and capabilities.

New Home Sales Decline Further from Peak In September

The HIA says the decline in new home sales which commenced in 2015 has continued with a 6.1 per cent reduction during September 2017.

The results are contained in the latest edition of the HIA New Home Sales Report the market’s leading gauge of sales activity in residential building across the five largest states. During September 2017, new detached house sales fell by 4.5 with a reduction of 16.7 per cent on the multi-unit side of the market.

During September 2017, NSW was the only state to see growth in new detached house sales (+3.7 per cent) compared with August. WA experienced the largest reduction in sales during September (-15.1 per
cent) followed by Queensland (-8.7 per cent). New detached house sales also fell in Victoria (-2.3 per cent) and SA (-1.7 per cent) during September.

“The decline in home sales over the past 18 months reflects the slowing in output across the economy and is a guide to short term activity in the residential building industry,” HIA Senior Economist, Shane Garret said.

“New home sales is a leading indicator of approvals data and shows that building activity peaked in March 2016 following the longest ever upturn in new home building.

“This process of adjustment will involve quite sizeable reductions both in building activity on the ground.

We expect that activity will bottom out sometime in 2019 with a recovery then setting in – assuming the economy reverts to its long-term average growth rate of around 3 per cent,” concluded Shane Garrett.

Assets of world’s largest fund managers passes US$80 trillion for the first time

Total assets under management (AuM) of the world’s largest 500 managers grew to US$ 81.2 trillion in 2016, representing a rise of 5.8% on the previous year, according to latest figures from Willis Towers Watson’s Global 500 research.

Looking at the Australian players in the global list, Macquarie Group was in 52nd place with assets of US$362,511m, Colonial State was at 102 with US$147,154m, AMP Capital was at 120 with US$119,476m, BT Investment at 182 with US$60,699 and QIC at 193 with US$57,455m.

The research, which takes into account data up to the end of 2016, found that AuM for North American managers increased by 7.7% over the period and now stand at US$ 47.4 trillion, whilst assets managed by European managers, including the UK, increased by 2.8% to US$ 25.8 trillion. However, UK-based firms saw AuM decline for the second consecutive year, falling by 4.5% in 2016 to US$ 6.3 trillion.

Although the majority of total assets1 (78.4%) are still managed actively, its share has declined from 79.7% from end of last year as passive management continues to make inroads.

Luba Nikulina, global head of manager research at Willis Towers Watson, said: “It is encouraging to see a return to growth in total global assets, suggesting that managers are finding success in attracting investors towards innovative solutions to achieve superior risk-adjusted returns. Whilst passive assets remain significantly smaller than actively managed assets, the proportion of passively managed assets has grown from 16.5% to 21.6% over the last five years alone. We expect that this trend will continue to put downward pressure on traditional fee structures, particularly amongst active managers seeking to remain competitive and to maximise value to investors.”

The 20 largest asset managers experienced a 6.7% increase in AuM, which now stands at US$ 34.3 trillion, compared to US$ 26.0 trillion ten years ago and US$ 20.5 trillion in 2008. The share of total assets managed by this group of 20 largest managers increased for the third year in a row, rising from 41.9% in 2015 to 42.3% by the end of 2016. Despite this, the bottom 250 managers experienced a superior growth rate in assets managed, rising by 7.3% over the year.

As with previous years, equity and fixed income assets have continued to dominate, with a 78.7% share of total assets1 (44.3% equity, 34.4% fixed income), experiencing an increase of 3% combined during 2016. Continuing from the strong growth they experienced in 2015, assets1 in alternatives saw a 5.1% increase by the end of 2016, closely followed by equities at 4.1%.

Luba Nikulina said: “Alternatives continue to grow in popularity, with investors remaining under pressure to find effective means of diversification in an environment of lower expected returns from traditional asset classes. These strategies often come with greater complexity and require superior risk management. We see this as linked to the growth in assets managed by managers in the bottom half of our list, suggesting that investors favour smaller investment houses with specialist investment skills.”

“Our research has also highlighted awareness in sustainable investing, with 78% of the firms surveyed acknowledging a growing interest from their clients for these sorts of strategies as they continue to look for ways to add value for clients,” said Luba Nikulina.

Whilst BlackRock retains its position at the top of the manager rankings for the eighth consecutive year, further insight shows the main gainers, by rank, in the top 50 during the past five years include, Dimensional Fund Advisors (+31 [76 to 45]), Affiliated Managers Group (+20 [52 to 32]), Nuveen (+16 [36 to 20]), New York Life Investments (+15 [55 to 40]) and Schroder Investment Management, (+15 [59 to 44]).

The world’s largest money managers

Ranked by total assets under management, in U.S. millions, as of Dec. 31, 2016

Rank Manager Country Total assets
1 BlackRock U.S. $5,147,852
2 Vanguard Group U.S. $3,965,018
3 State Street Global U.S. $2,468,456
4 Fidelity Investments U.S. $2,130,798
5 Allianz Group Germany $1,971,211
6 J.P. Morgan Chase U.S. $1,770,867
7 Bank of New York Mellon U.S. $1,647,990
8 AXA Group France $1,505,537
9 Capital Group U.S. $1,478,523
10 Goldman Sachs Group U.S. $1,379,000
11 Prudential Financial U.S. $1,263,765
12 BNP Paribas France $1,215,482
13 UBS Switzerland $1,208,275
14 Deutsche Bank Germany $1,190,523
15 Amundi France $1,141,000
16 Legal & General Group U.K. $1,099,919
17 Wellington Mgmt. U.S. $979,210
18 Northern Trust Asset Mgmt. U.S. $942,452
19 Wells Fargo U.S. $936,900
20 Nuveen U.S. $881,748

Source: P&I/Willis Towers Watson World 500

NAB settles BBSW court case for $50m

From InvestorDaily.

In an announcement made late on Friday, NAB admitted that on 12 occasions between 2010 and 2011 its employees “attempted to engage in unconscionable conduct in breach of the ASIC Act”.

The settlement will see NAB fork out a $10 million penalty, cover ASIC’s costs of $20 million and donate $20 million to an ASIC-nominated financial consumer protection fund – all of which will be reflected in its 2017 financial year results.

NAB is the second of three major banks to settle with ASIC following claims of rigging the bank bill swap rate (BBSW). ANZ has already settled, leaving Westpac as the last bank remaining defending the court case.

Commenting on the settlement, NAB group chief executive Andrew Thorburn said the way BBSW was calculated “had changed since that time”.

“We accept we did not meet the high standards of professional conduct that ASIC, the community and NAB expects of itself, in that market during that period,” Mr Thorburn said.

“The ASX is now responsible for the administration of BBSW and NAB fully supports the reforms that are being introduced by the ASX to enhance trust and transparency in the BBSW market.

Auction Volumes Across the Combined Capital Cities Reach Their Highest Level Year-to-Date

From CoreLogic.

Preliminary clearance rates hold firm as volumes across the combined capital cities reach their highest level year-to-date and Melbourne records its busiest auction week on record.

This week, the combined capital cities saw the number of auctions held reach a new year-to-date high, with a total of 3,690 held, surpassing the previous 2017 high recorded over the week prior to Easter when 3,517 auctions were held. The higher volumes returned a preliminary auction clearance rate of 67.8 per cent, rising from a final clearance rate of 64.7 per cent last week, when fewer auctions were held (2,519).  This week’s surge in volumes can be attributed to activity across Australia’s largest auction market in Melbourne, where volumes across the city reached their highest on record this week, with 1,983 held recording a preliminary auction clearance rate of 71.7 per cent. Sydney also saw a substantially higher volume of auctions this week with 1,196 homes taken to auction, recording a clearance rate of 64.1 per cent.  Sydney’s clearance rate has been consistently below 65 per cent since the first week of October.  Activity across the remaining auction markets was varied with Brisbane recording the lowest preliminary clearance rate (47.1 per cent).  Historically auction volumes have peaked around late November / early December; if this trend holds true this year, we could see new records being set for auction volumes as the Spring season concludes.

2017-10-30--auctionresultscapitalcities

Household Debt Grinds Higher

The ABS published some revisions to their Household Income and Wealth statistics.

Two data series stood out for me. First, more households are in debt today, compared with 2005-6, and second more households have debts at more than three times their income.

Here is the plot of the proportion of households with debt, by income quintile. In 2003-4, 72.9% of all households had debt, and this rose to 73.6% in 2015-16, up 0.7% across the series.

But, those on lower incomes have borrowed harder, with 50% in the bottom income range borrowing, compared with 44.6% in 2003-4, a rise of 5.4%. The second lowest saw a rise of 2.2%, up from 64.5 to 66.7. On the other hand, the highest quintile saw a fall from 91.8% in 2003-4 to 89.2% in 2015-16, down 2.6%.

The ABS also said that in 2005-6 the proportion of households with debt more than three times income was 23.9%, while in 2015-16 it was 27.2%, up 3.3%.

This underscores the issue we face, debt is higher, and more lower income families are more stretched. Sure, net worth may be higher now, but the debt (mostly mortgage debt) is the problem. As we saw last week, most of the growth in wealth is associated with home prices. Should they reverse, then this looks very wobbly.