What happened to home loan rates a year on from APRA’s changes

Our friends at Mozo have written a highly relevant blog post for DFA on the impact of the APRA changes.  No wonder, some households are under pressure! And thanks to Mozo for their insights!

There’s been a reasonable amount of ups and downs in home loan interest rates over the last 12 months, especially considering the official cash rate hasn’t changed since August last year. Many of those changes served to draw clear lines between borrower and repayments types, as banks aim to cut back on risky lending after APRA updated regulations earlier in the year. The changes included a 30% cap on new interest-only lending and a mandate for stricter limits on interest-only loans with LVRs above 80%.

And the different interest rate changes between borrowers types have been pretty dramatic. While at one end of the scale, owner-occupiers making principal and interest repayments saw hardly any change, on the other, riskier, end, investors with an interest-only loan – who perhaps saw the biggest changes thanks to APRA’s updated rules – have been hit by the equivalent of more than two typical RBA rate hikes.

Here’s a full breakdown of the movement in different rate types over the 12 months from October 2016 to today.

Owner occupiers making principal and interest repayments – 0.01% increase

People buying their own home and paying off the principal and interest each month have fared the best over the past year, with an increase of just 0.01%, bringing the average rate to just 4.03%.

That’s good news, since according to analysis done by ASIC, the majority of owner occupiers fall into this category. Even better news is that the lowest rate around at the moment for this borrower group is 3.54% – 0.10% higher than it was in October 2016, but still a very competitive offer.

This very minimal rate change over a 12 month period in part reflects the fact that this group is the least risky from a bank’s perspective. Unlike other rate types, there was a pretty even split between the number of lenders who increased rates (30) and those who decreased (33).

Owner occupiers making interest only repayments – 0.25% increase

According to ASIC, one in four owner occupiers have an interest only loan. Unlike loans with principal and interest repayments, in this category there was an undeniable trend toward rate increases, with 40 lenders raising rates, while just 5 lowered them over the 12 month period from October 2016. This points to the extra risk interest only repayments pose for banks.

Borrowers in this category have been hit by an average rate increase of 0.25%, equal to a typical RBA rate hike. The average interest rate went from 4.15% in October 2016, to 4.40% today.

On a $500,000 home loan that change equates to $1,250 of extra interest per year.

Investors making principal and interest repayments – 0.27% increase

Investors are often hit harder by rate increases, and with APRA regulations tightening around new lending to ‘riskier’ borrower types, this year has been no different.

Rates rises for investors making principal and interest repayments were more or less on par with owner occupiers on an interest only loan, with an increase of 0.27%, to 4.61%. That change meant an extra $1,350 in interest over a year long period for those is this rate category.

This is a bit more than the equivalent of a Reserve Bank rate rise, reflecting the level of risk lenders see in investment lending. Again, there was a trend toward increases by lenders (53) rather than decreases (8).

Investors making interest only repayments – 0.53% increase

Where investors making principal and interest repayments saw a little over the equivalent of one typical RBA rate rise in the last 12 months, rates for interest only investor loans went up by an average of 0.53% – or more than two times an RBA rate rise.

There was an overwhelming trend towards lenders increasing instead of decreasing rates in this category as well, with just 1 lowering rates, while 45 hiked.

That brought the average rate from 4.39% in 2016 to 4.92% this year, a change that meant a whopping $2,650 of extra interest paid on average. Not only is this rate increase bigger than that for other borrower types by a pretty large margin, but it also likely affected more people, considering ASIC data found two in three investment borrowers have an interest only loan.

What this means

While the banks have the prerogative to protect themselves against riskier lending by imposing higher premiums, overall I’d argue that the rate changes over the past year have potentially had a negative effect on the wider economy.

Most borrower categories saw rate increases equivalent to one or more Reserve Bank hikes, which can have a significant impact on household budgets – and the economy overall. As more money goes toward home loan repayments and borrowers brace for more rate hikes to come, consumer confidence drops, and the economy starts to stall.

And that’s bad news for everyone, risky home loan or not.

About the Author: After starting his career working for the banks, Peter Marshall has spent the last 15 years helping consumers compare financial products. At Mozo he manages the Data Team which keeps track of banking, insurance and energy products in Australia.

Mortgage Arrears Ease A Little In August – S&P

From Business Insider.

According to ratings agency Standard and Poor’s (S&P), the percentage of delinquent housing loans contained in Australian prime residential mortgage-backed securities (RMBS) fell to just 1.10% in August from 1.17% in July.

S&P said arrears decreased in all states and territories except the Australian Capital Territory (ACT) over the month, with noticeable improvements in Australia’s mining states and territories.

“The Northern Territory (NT) recorded the largest improvement, with arrears declining to 1.63% from 1.98% a month earlier,” S&P said. “In Western Australia, arrears fell to 2.22% in August from a historic high of 2.38% in July.”

The improvement may reflect an improvement in economic conditions in those locations following recent increases in commodity prices, along with a pickup in employment levels.

Improvement was also seen in Australia’s most populous states, where most Australian home loans are domiciled.

“The more populous states of New South Wales, Victoria, and Queensland, where around 80% of loan exposures are domiciled, recorded an improvement in arrears in August,” the agency said.

Despite the small increase in the ACT, at 0.63%, arrears still remained at the lowest level across the country.

The broad improvement in home loan arrears over the month can be seen in the map below from S&P.

Source: Standard & Poor’s


And this chart and table shows the level of arrears by delinquency duration.

Source: Standard & Poor’s


S&P says that “relatively stable employment conditions and low interest rates continue to underpin the low levels of arrears for most Australian RMBS transactions”, adding that it believes “lending standards generally have tightened in many areas since attracting greater regulatory scrutiny beginning in 2015.”

Looking ahead, the ratings agency says that while the prospect of higher mortgage rates could lead to an increase in arrears, particularly among those with high loan-to-value ratios, stronger labour market conditions should keep any potential in check.

“Provided employment conditions remain relatively stable, however, we do not anticipate arrears materially increasing above current levels in the next 12 months,” S&P says.

“Some loans underwritten before 2015 could be more susceptible to higher arrears, particularly interest-only loans with higher loan-to-value (LTV) ratios for which no equity has built up during the interest-only period, in our opinion.”

Basel III Implementation Status In Australia

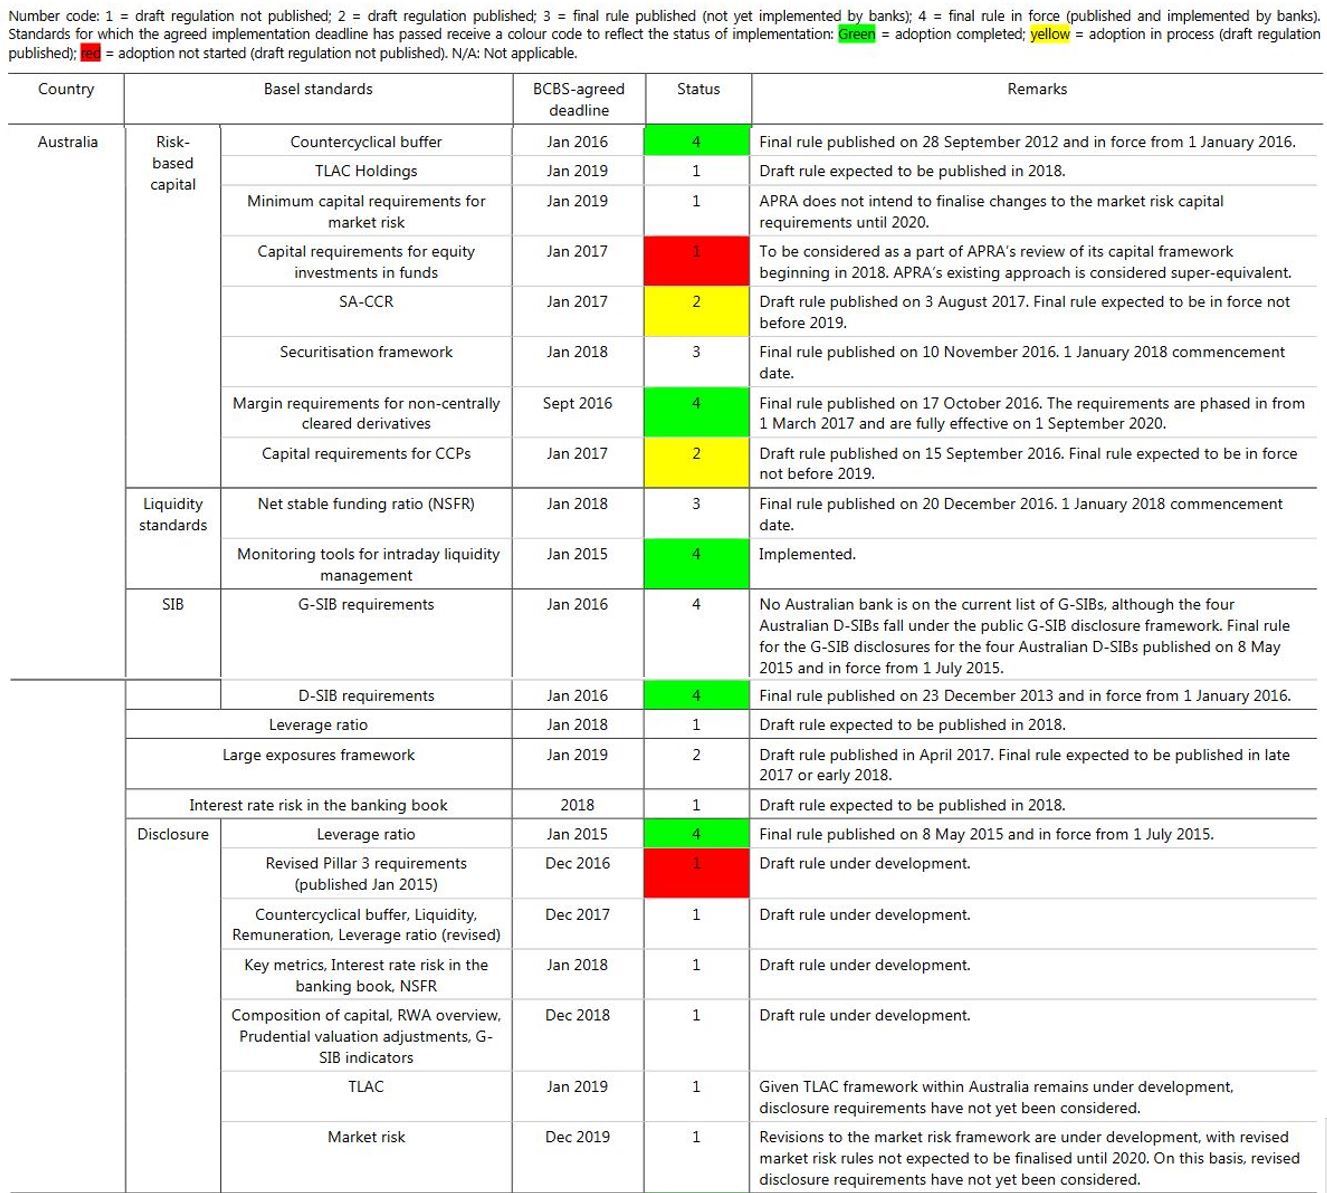
The Basel Committee published its latest status report on Basel III implementation to end-September 2017 – the 13th progress report. This includes a status report on Australia:

There are areas (in red) where the deadline has passed, and as yet plans are not announced. Many other countries have red marks, but it is worth noting the Euro area is ahead of many other regions. Disclose is a major gap in Australia according to the committee.

APRA provided comments on the status.

It also, once again, highlights the complexity in the Basel framework. Here the overall Basel Committee statement summary.

As of end-September 2017, all 27 member jurisdictions have final risk-based capital rules, LCR regulations and capital conservation buffers in force. 26 member jurisdictions have issued final rules for the countercyclical capital buffers and for domestic systemically important banks (D-SIBs) frameworks.

With regard to the global systemically important banks (G-SIBs) framework, all members that are home jurisdictions to G-SIBs have final rules in force. 21 member jurisdictions have issued final or draft rules for margin requirements for non-centrally cleared derivatives and 22 have issued final or draft rules for monitoring tools for intraday liquidity management.

With respect to the standards whose agreed implementation date passed at the start of 2017, 20 member jurisdictions have issued final or draft rules of the revised Pillar 3 framework (as published in January 2015, ie at the end of the first phase of review), 19 have issued final or draft rules of the standardised approach for measuring counterparty credit risk (SA-CCR) and capital requirements for equity investments in funds, and 18 have issued final or draft rules of capital requirements for bank exposures to central counterparties (CCPs).

Members are now striving to implement other Basel III standards. While some members reported challenges in doing so, overall progress is observed since the previous progress report (as of end-March 2017) in the implementation of the interest rate risk in the banking book (IRRBB), the net stable funding ratio (NSFR), and the large exposures framework. Members are also working on or turning to the implementation of TLAC holdings, the revised market risk framework, and the leverage ratio. The Committee will keep on monitoring closely the implementation of these standards so as to keep the momentum in implementing the comprehensive set of the Committee’s post-crisis reforms.

Regarding the consistency of regulatory implementation, the Committee has published its assessment reports on all 27 members regarding their implementation of Basel risk-based capital and LCR standards.

How Much Can Mortgage Holders Really Save By Refinancing?

We showed recently that households with specific post codes may have significantly higher mortgage rates than their neighbours. As a result, significant savings may be made by seeking out a mortgage with a better rate.

Of course households need to be careful, as they may incur transaction costs, and even break costs if the loan is fixed.

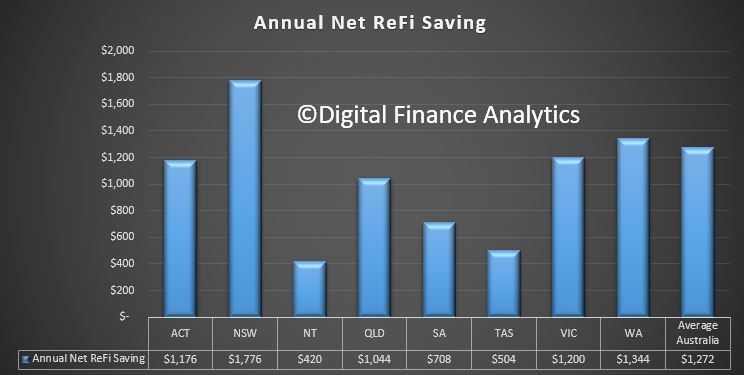
But we went though our Core Market Model looking at those who refinanced in the past year. We then calculated the annual savings they had, on average achieved. Here are the results:

The larger the loan, the bigger the potential saving, which is why there are state variations. There were quite big differences between the old rate and new rates, and we incorporated break costs where appropriate.

This again highlights that households should be checking their rates and seeking out better, lower rates. Substantial savings are available, and when we consider the average loan life is more than 5 years, the potential savings are significant.


Demand For Short Term Credit Skyrockets

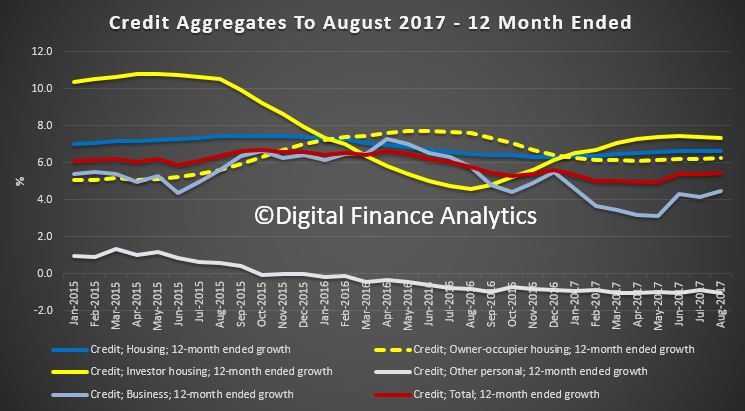
While personal credit, according to the RBA is not rising, as shown from their credit aggregates – to August 2017 – we see a more disturbing trend.

One of the less obvious impacts of flat incomes, rising costs and big mortgages or rents is that more households are under financial pressure, and so choose to turn to various unsecured lenders to tide them through.

Many of these are online lenders, offering instant loans, and confidential settlements. Re-borrowing rates are high, once they are on the hook inside the lenders “portal”.

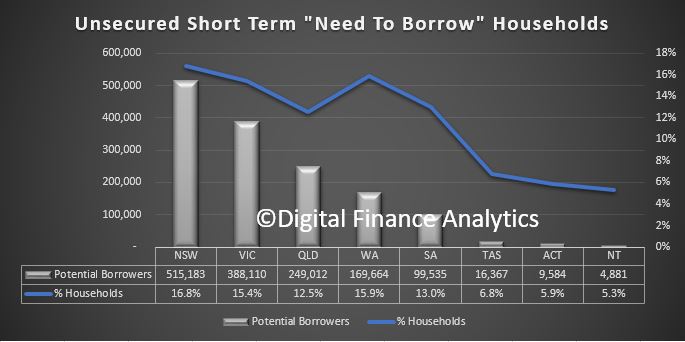
In our household surveys we asked whether households were likely to seek unsecured credit to assist in managing their finances. Here are the results by state to September 2017. More than 1.4 million of the 9 million households in Australia are in this state (and it is rising fast). Not all will get a loan.

Households in NSW and WA are most likely to seek out other forms of credit. These loans, could be from SACC (Pay Day) lenders, or other sources; but are not reported at all in the official figures.

We think more than $1 billion in loans are out there, and our research shows that such short term loans really do not solve household financial issues. However, when people are desperate, they will tend to grasp at any straw in the wind, regardless of cost or consequences. We also find these households within certain household segments, who tend to be less affluent, and less well educated.

We also think more robust official reporting would help shine a light on the sector, and separate the sheep from the goats!

NAB trialling IBM blockchain technology

From Investor Daily.

National Australia Bank is one of a number of global banks that are trialling a cross-border payments solution powered by IBM Blockchain.

IBM has rolled out a new blockchain banking solution designed to reduce settlement times for cross-border payments.

NAB is the only Australian bank involved in the trial so far, along with institutions from Argentina, Indonesia, Thailand and the Philippines, among others.

According to a statement by IBM, the solution uses a blockchain distributed ledger to allow all parties to have access and insight into clearing and settlement of payments.

“It is designed to augment financial flows worldwide, for all payment types and values, and allows financial institutions to choose the settlement network of their choice for the exchange of central bank-issued digital assets,” said the statement.

The IBM solution, which has been created in collaboration with open source blockchain network Stellar.org and KlickEx Group, is already processing live transactions in 12 currency “corridors” across the Pacific islands and Australia, said IBM.

“For example, in the future, the new IBM network could make it possible for a farmer in Samoa to enter into a trade contract with a buyer in Indonesia.

“The blockchain would be used to record the terms of the contract, manage trade documentation, allow the farmer to put up collateral, obtain letters of credit, and finalise transaction terms with immediate payment, conducting global trade with transparency and relative ease.”

The solutions is run from IBM’s open source Blockchain Platform on Hyperledger Fabric.

Do computers make better bank managers than humans?

From The Conversation.

Algorithms are increasingly making decisions that affect ordinary people’s lives. One example of this is so-called “algorithmic lending”, with some companies claiming to have reduced the time it takes to approve a home loan to mere minutes.

But can computers become better judges of financial risk than human bank tellers? Some computer scientists and data analysts certainly think so.

How banking is changing

On the face of it, bank lending is rather simple.

People with excess money deposit it in a bank, expecting to earn interest. People who need cash borrow funds from the bank, promising to pay the amount borrowed plus interest. The bank makes money by charging a higher interest rate to the borrower than it pays the depositor.

Where it gets a bit trickier is in managing risk. If the borrower were to default on payments, not only does the bank not earn the interest income, it also loses the amount loaned (provided there wasn’t collateral attached, such as a house or car).

A borrower who is deemed less creditworthy is charged a higher interest rate, thereby compensating the bank for additional risk.

Consequently, the banks have a delicate balancing act – they always want more borrowers to increase their income, but they need to screen out those who aren’t creditworthy.

Traditionally this role was fulfilled by an experienced credit manager — a judge of human character — who could distinguish between responsible borrowers and those who would be unlikely to meet their repayment schedules.

Are humans any good at judging risk?

When you look at the research, it doesn’t seem that humans are that great at judging financial risk.

Two psychologists conducted an experimental study to assess the kind of information that loan officers rely upon. They found that in addition to “hard” financial data, loan officers rely on “soft” gut instincts. The latter was even regarded as a more valid indicator of creditworthiness than financial data.

Additional studies of loan officers in controlled experiments showed that the longer the bank’s association with the customer, the larger the requested loan, and the more exciting its associated industry, the more likely are loan officers to underrate loan risks.

Other researchers have found that the more applications that loan officers have to process, the greater the likelihood that bank officers will use non-compensatory (irrational) decision strategies. For example, just because a customer has a high income that doesn’t mean they don’t have a bad credit history.

Loan officers have also been found to reach decisions early in the lending process, tending to ignore information that is inconsistent with their early impressions. Lastly, loan officers often fail to properly weigh the credibility of financial information when evaluating commercial loans.

Enter algorithmic lending

Compared with human bank managers, a computer algorithm is like a devoted apprentice who painstakingly observes each person’s credit history over many years.

Banks already have troves of data on historical loan applications paired with outcomes – whether the loan was repaid or defaulted. Armed with this information, an algorithm can screen each new credit application to determine its creditworthiness.

There are various methods, based on the specific data in each applicant’s profile, from which the algorithm identifies the most relevant and unique attributes.

For example, if the application is filled in by hand and scanned into the computer, the algorithm may consider whether the application was written in block capitals or in cursive handwriting.

The algorithm may have detected a pattern that applicants who write in all-caps without punctuation are usually less educated with a lower earning potential, and thereby inherently more risky. Who knew that how you write your name and address could result in denial of a credit application?

On the other hand, a degree from Harvard University could be viewed favorably by algorithms.

On balance, computers come out ahead

A large part of human decision making is based on the first few seconds and how much they like the applicant. A well-dressed, well-groomed young individual has more chance than an unshaven, dishevelled bloke of obtaining a loan from a human credit checker. But an algorithm is unlikely to make the same kind of judgement.

Some critics contend that algorithmic lending will shut disadvantaged people out of the financial system, because of the use of pattern-matching and financial histories. They argue that machines are by definition neutral and thus usual banking rules will not apply. This is a misconception.

The computer program is constrained by the same regulations as the human underwriter. For example, the computer program cannot deny applications from a particular postal code, as those are usually segregated by income levels and racial ethnicity.

Moreover, such overt or covert discrimination can be prevented by requiring lending agencies (and algorithms) to provide reasons why a particular application was denied, as Australia has done.

In conclusion, computers make lending decisions based on objective data and avoid the biases exhibited by people, while complying with regulations that govern fair lending practices.

Author: Saurav Dutta, Head of School at the School of Accounting, Curtin University

RBA Minutes Says Little This Time Around…But Wait…

… one line item was this morsel:

Members noted that housing loans as a share of banks’ domestic credit had increased markedly over the preceding two decades. APRA intended to publish a discussion paper later in 2017 addressing the concentration of banks’ exposures to housing.

Members also noted that APRA had intensified its focus on Australian banks strengthening their risk culture.

We can barely contain our excitement at the prospect! A discussion paper later in the year!

Too Little Too Late.

You can read the minutes here, but its hardly worth the effort.


ANZ Alerts Customers They Are Turning Off Paper Statements

ANZ customers are receiving emails advising that the bank will turned off paper statements, unless customers click on the link to retain paper distribution. And there is a short cut off date beyond which you need to log into your account to set preferences. Asking to click on a link from an email is in my view inept, in the era of spam or worse, this is not good practice.

This forced migration may save the bank costs, and for some will be convenient, but for those who need physical statements for audit purposes, this is a problem. In addition, people who are not regularly online (yes there are still many who do not use email regularly, even if they are social media), may miss the change and discover an absence of statements down the line.

We wonder if the ANZ will start to charge for paper production later, we hope not, as this would be a further degradation of service.

It seems to me, the bank should have worded its communication more positively, because this comes across as a high-handed action, without taking customer needs into account. One more example of poor culture.

It is probably true that some would be too lethargic to make the switch to digital statements, without a prod, but this approach from the ANZ will be seen by many as just another example of them not thinking about things from a customer’s point of view. It shows that bank has a long way to got to win back customer favour.

A better way would be to incentivise people to switch by sharing some of the cost savings with their customers who elect to go for online statements.


The Distribution of Multiple Investment Properties

We had a number of questions following the AFR report over the weekend about the distribution of investment properties across the population.

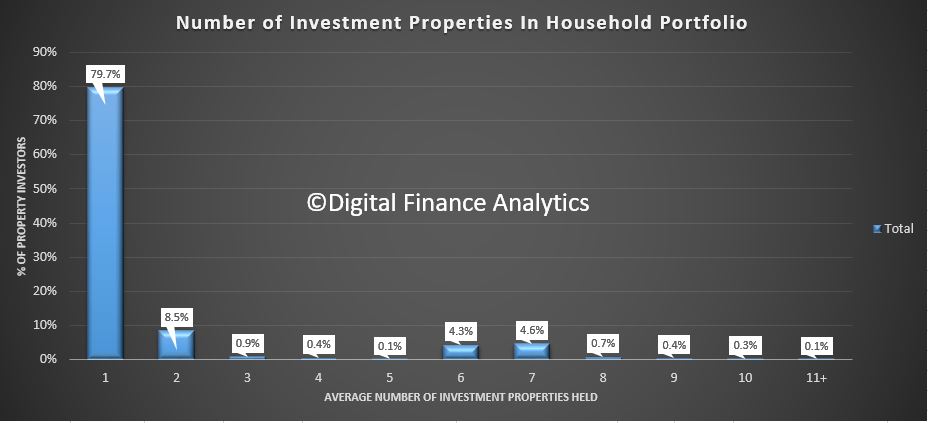
Using data from our latest surveys, we can estimate the relative distribution across households. The most interesting is the average number of properties held.  Around 80% of the investment population has a single investment property, a further 8% have two, and more than 4% have either 4 or 5. The highest count in our survey was 23!

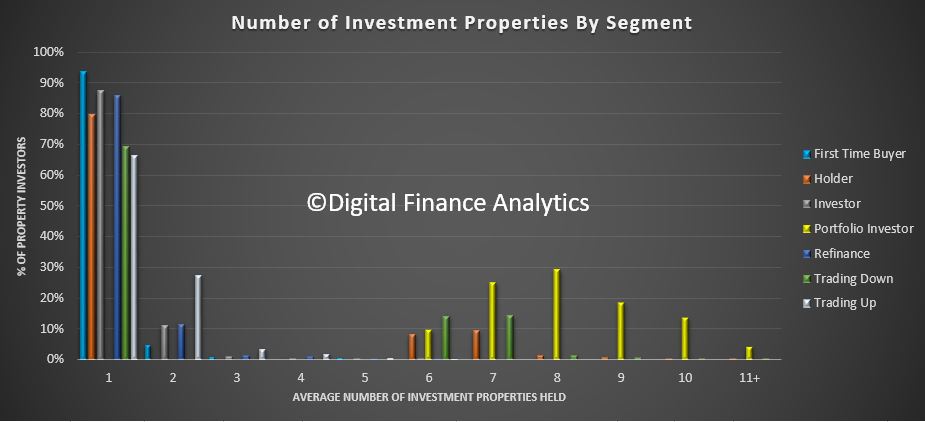
If we overlay our household segmentation on this data, we discover that portfolio property investors have the highest distribution, followed by down traders.  First time buyers are more likely to be at the lower end.

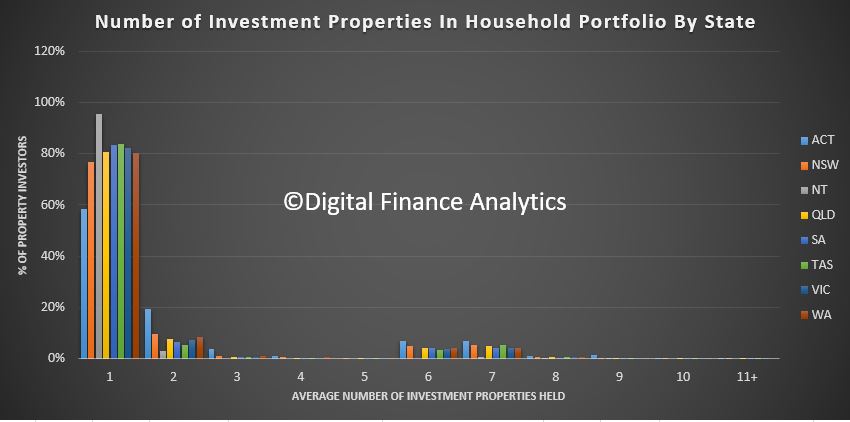
The highest count registered in the ACT, followed by NSW.

Note this is data based on the number of properties held, not the number of properties mortgaged!