Housing Lending Higher Again in July to $1.48 Trillion

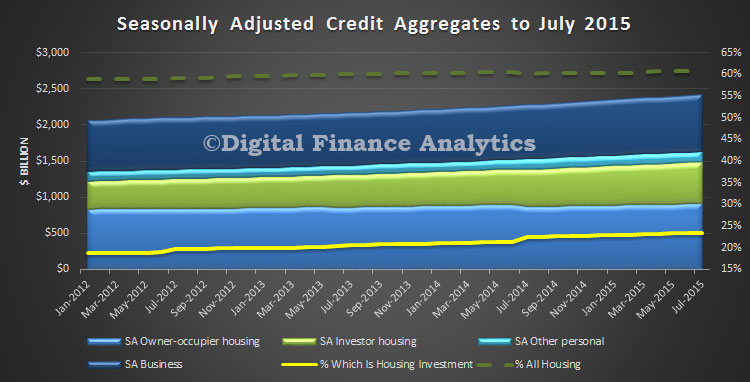
The latest RBA credit aggregates to end July 2015 show continued momentum in the home lending sector, up 7.4% in the year to July, compared with business lending up 4.8% and personal credit up 0.9%. Lending for housing comprised more than 60% of all lending on the books. 23.5% of all lending goes to investment housing. As APRA said recently, we hope it is as “safe as houses“. Total lending for housing is a seasonally adjusted $1,476.1 billion, up $8.5 billion, up 0.58% on the previous month.

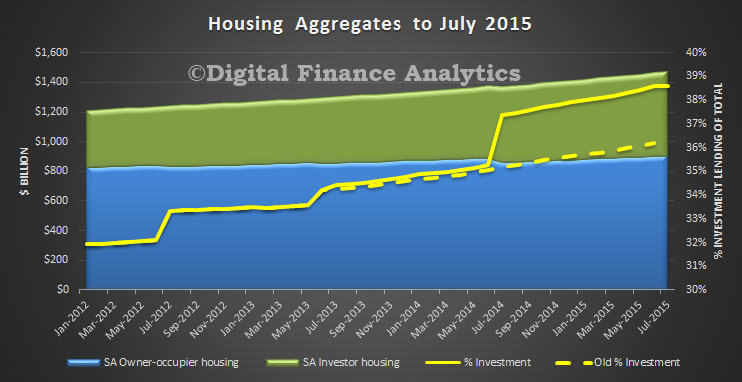
RBACreditAggregatesJuly2015We need to point out that the various restatements by the banks (including NAB and ANZ), especially between the owner occupied and investment categories has had quite an impact on the numbers.  In the month, lending for investment grew 3.6bn, up 0.64% to $569.8 billion in the month, whilst owner occupied lending grew 4.9 billion to $906.4 billion, up 0.54%. Overall growth for investment lending was an adjusted 10.2% on total balances. This includes both ADI’s and others lenders. However, there was a significant movement shown from July 2014, where the restatements kick in, and we see that on the old basis investment housing was 36.2% of all lending for housing, whereas on the new basis, it has now risen to 38.6%. A sizable change. A record, and given the intrinsically higher risks in investment loans, a concern.

RBAHousingAggregatesJuly2015Given all the noise in the numbers, it is hard to conclude other than home investment lending remains buoyant – in line with the DFA household surveys and expectations. We will report on the APRA monthly banking stats shortly, were individual bank movements can be analysed.

RBA Opening Statement to the Inquiry into Credit Card Interest Rates

RBA Assistant Governor (Financial System) Malcolm Edey’s Opening Statement to the Senate Economics References Committee Inquiry into Matters Relating to Credit Card Interest Rates touches on some important points. The RBA’s full submission is one of 23 made, and is worth reading.  The terms of reference for the inquiry are wide ranging.  Borrowings on cards are worth more than $41bn.

The economic effect of matters including the difference between cash rates and credit card interest rates, with particular reference to:

  1. the Reserve Bank of Australia‘s cash rate announcement and associated changes in credit card interest rates;
  2. the costs to banks, credit providers, and payments systems, including those related to:
    1. borrowings,
    2. credit risk and default rates, and credit risk pricing,
    3. various credit card loyalty programs, and
    4. consumer protection measures, including reforms introduced following the global financial crisis,
  3. transaction costs, including interchange fees, on the payments industry;
  4. the costs to consumers, including those related to:
    1. how and when interest is applied,
    2. minimum monthly payment levels,
    3. various credit card loyalty programs of other users, and
    4. card fees, including ATM and POS fees;
  5. what impact competition and price signals have on the credit card market;
  6. how the enforcement of responsible lending laws and the national consumer credit regime affect consumer costs;
  7. how consumer choice of credit card products can be improved, with reference to practices in other jurisdictions; and
  8. any other related matters.

The RBA has also made a number of comments on the cards industry in its recent paper. Now, here are today’s opening comments.

I know the Committee is interested in a number of different aspects of credit card pricing and regulation, and we’ve tried to address those aspects that come within our field of expertise and responsibility in our submission.

As we explain in the submission, credit cards have both a payment and a credit function. The regulatory powers and mandate of the Reserve Bank Payments System Board relate to the payment function. The Board has a mandate to use its powers to promote efficiency and competition in payment systems, consistent with overall stability of the financial system. To that end, the Board has for a number of years regulated card payment systems by setting standards in relation to such matters as interchange fees, surcharging and access.

As you know, the Board is currently undertaking a comprehensive review of those aspects of card payments regulation. I’ll be happy to answer any questions you might have today about how that review is proceeding.

I know the Committee is also very interested in the credit function, and particularly the interest rates on credit cards. That is not something that we regulate, but we have set out in our submission an overview of some of the key facts.

If I may, I’ll just make a few high-level observations about that before we go to questions.

Credit card products vary a lot in the interest rates that they charge. Some of those rates are very high. They’re higher than I think can be easily explained.

Interest rates of the order of 20 per cent on credit cards are not uncommon. The average rate for borrowers who incur interest on credit cards is currently about 17 per cent. After deducting banks’ cost of funds and the cost of credit losses, that would equate to an interest rate margin of more than 10 percentage points.

My advice if you’re in that situation is to shop around. Despite the prevalence of high-rate cards, this is a market where there is some significant competition. There are a lot of card products that offer lower rates and special deals for balance transfers. In many cases, card holders should be able to lower their interest rates by taking advantage of those offers, if they are willing to shop around.

That of course raises questions about why more cardholders don’t take advantage of the lower rates that are on offer, whether there are obstacles to competition and whether there might be some role for regulatory action.

Some cardholders might be unable to switch, for example if they have poor credit histories. That is something that can be looked into, along with the related question of whether there are unreasonable obstacles to switching. Other cardholders might not be aware of the options available, or might have other reasons for not pursuing them. We discuss some of those issues in our submission.

The answers to these questions are not necessarily straightforward, and I think these are areas where the financial regulators can usefully do further work. When I appeared at this Committee in June I indicated that the Bank would consult with other regulators in this area, and we have begun doing that. We will be continuing those discussions at a more senior level at the next meeting of the Council of Financial Regulators next month.

I don’t want to pre-empt what might come out of those discussions, but some of the questions that might be considered are: whether there is a case for improved disclosure in this area; whether there is a need for stronger risk assessment requirements for credit card lending; and to what extent any actions in these areas would fall within the regulators’ existing powers and mandates.

DFA last year highlighted the flows of value within the credit card system, and our analysis suggested that card interest rates ARE too high. Actually the credit card business relies on those who continue to revolve to maintain the value of business. We think that unbundling the payment mechanism from the credit mechanism, and the loyalty element is critical to get to grips with what is going on.  We also hope the inquiry considers alternative payment mechanisms as part of the review.

RBA Minutes Quite Bullish

The notes from the RBA meeting of 4th August were released today. They seem quite bullish on future economic prospects. Does this mean a rise in the cash rate sooner?

Global economic conditions were expected to continue to be supported by the lower level of oil prices and accommodative global financial conditions. Global industrial production growth had eased further this year, particularly in the Asian region, and this had contributed to lower commodity prices. Growth of Australia’s major trading partners was expected to be around its long-run average over the next two years. Members observed that the downside risks to the outlook for Chinese growth identified over the past year had receded somewhat, although the Government’s policy response to the recent volatility in Chinese equity markets had clouded the medium-term economic outlook. Uncertainties arising from the expected start of monetary policy tightening in the United States had moved into sharper focus.

Domestically, economic activity had generally been more positive over recent months. Very low interest rates were continuing to support strong growth in dwelling investment and consumption, and the further depreciation of the Australian dollar was expected to impart stimulus to the economy through stronger net exports. Although surveys of business investment intentions and non-residential building approvals suggested that non-mining business investment would remain subdued for some time, members noted that non-mining business profits had increased, business conditions were clearly above average and businesses had been hiring more labour, partly encouraged by very low wage growth. As a result, employment had risen as a share of the working age population and the unemployment rate had been relatively stable, in contrast to earlier expectations of a further increase. The recent data on inflation were largely as expected.

Members noted that output growth was expected to pick up gradually from its below-average pace over the past year to exceed 3 per cent in 2017. The forecast for the unemployment rate had been revised lower since the previous forecasts had been presented. The further depreciation of the Australian dollar had resulted in a slight upward revision to the forecast for inflation. Nonetheless, inflation was expected to remain consistent with the target over the forecast period given that domestic cost pressures were likely to remain well contained.

Credit was growing moderately overall, with growth in lending to the housing market broadly steady over recent months. House prices continued to rise strongly in Sydney and Melbourne, but trends had been more varied in a number of other cities. Members observed that recent responses by banks to the suite of measures implemented by APRA in respect of lending to investors in housing, including a tightening in lending conditions, would be expected to reduce the risks relating to the housing market, although it was too early to gauge their full effects.

Members noted that an accommodative monetary policy setting remained appropriate given the forecasts, while observing that the Australian economy had been adjusting to the shift in activity in the resources sector from the investment to the production phase. This shift had been accompanied by significant declines in key commodity prices and was being assisted by the depreciation of the exchange rate over recent months.

In light of these considerations, the Board judged that it was appropriate to leave the cash rate unchanged. New information about economic and financial conditions would continue to inform the Board’s assessment of the outlook and determine whether the current stance of policy remained appropriate to foster sustainable growth and inflation consistent with target.

Australian Population Growth Is Slowing

In an address by Christopher Kent, RBA Assistant Governor (Economic), he looks at changes in the labour market and concludes that as population growth is slower than expected, effective employment utilisation is higher. Significantly, also, more Australians are now employed in the service sector.

The change in population growth rates is significant, and relevant to future demand for housing, and GDP estimates.

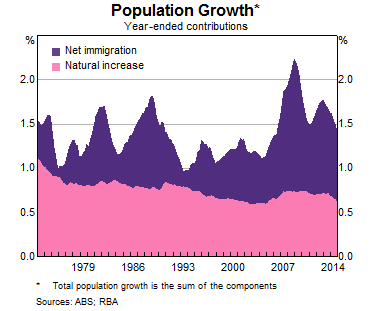
Official data suggested that the working-age population had been growing by about 1.7 per cent per annum, and it was expected to continue at about that rate in the foreseeable future. However, the most recent data from the ABS suggest that total population growth had dropped quite noticeably over the past year or so, from 1.8 per cent over 2012 to 1.4 per cent over 2014. Estimates of the working-age population are expected to be revised down accordingly in coming months.

Graph 2: Population Growth
The decline in population growth was mainly the result of a decline in net immigration. This appears to be related to the weakening in Australia’s labour market conditions relative to those of other countries. Of course, people on temporary skilled-work visas (so-called ‘457s’) leave for home when their jobs end. But there has also been a large decline in net immigration from New Zealand. Labour market conditions in New Zealand tightened at the same time that spare capacity in the Australian labour market increased. The reconstruction activity in Christchurch took off around the time that construction in Australia’s resource sector was winding down. Indeed, the key mining states of Queensland and Western Australia have seen the largest declines in net immigration. It also appears that Australia’s intake of international students has not picked up to the extent previously anticipated.

The unexpected slowdown in population growth implies somewhat less rapid growth of our labour force than otherwise. This means that the GDP growth that we have recorded may have been closer to the recent growth in the economy’s productive capacity than previously thought. If so, that would have left the economy with a little less spare capacity (a lower unemployment rate) than had been expected.

National Wealth, Land Values and Monetary Policy

Philip Lowe, Deputy Governor RBA gave an address to the 54th Shann Memorial Lecture. In it he discussed the growth in land and property values and some important implications. Here are a few salient points. Households borrowing is higher and more risky, lower income growth means households are less likely to spend more, and value is being shifted inter-generationally speaking.

According to the ABS’ latest estimates, the total value of Australia’s assets as at end June 2014 was around $12½ trillion, or around $500,000 for each person living in Australia. After an adjustment is made for net foreign liabilities, the net asset position, or net wealth, was around $10 trillion, which is the equivalent to around six times Australia’s annual GDP.

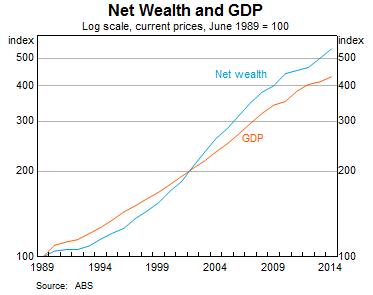
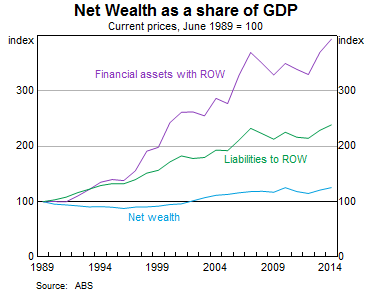
The second observation is that, over recent decades, net wealth has increased at a faster rate than has GDP. Between 1989 and 2014, the nominal value of net wealth increased at an average pace of around 7 per cent per year, compared with an average increase in nominal GDP of around 6 per cent. While net wealth grew more slowly than GDP in the first half of the 1990s, for most of the time since it has grown more quickly than GDP.

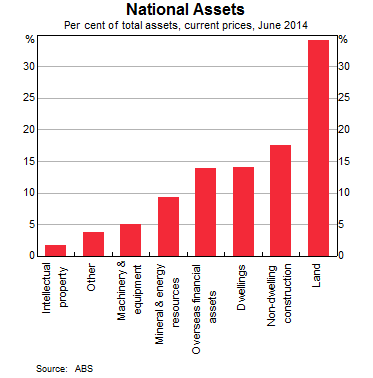
Graph 1: Net Wealth and GDP The third observation relates to the composition of our national assets. Land is the asset class with the highest value. As at June 2014, it accounted for 34 per cent of the value of our national assets. This is followed by non-dwelling construction – offices, factories, infrastructure, etc. – which accounts for a further 18 per cent of total assets. And then overseas financial assets and the value of our dwellings each account for a little under 15 per cent of the national balance sheet. Intellectual property assets account for only around 2 per cent of the total.

Graph 2: National Assets The final and perhaps most interesting set of observations relate to how the structure of the balance sheet has changed through time.

One very clear trend has been a substantial increase in the value of our foreign financial assets and liabilities; both have increased much faster than net wealth. In effect, as we have become more globally integrated as a nation, there has been a grossing-up of our balance sheet with the rest of the world. Australians now hold many more overseas assets than they once did. And, conversely, overseas residents now hold many more Australian assets than they once did.

Graph 3: Net Wealth as a share of GDPSo, how do we explain this increase in the value of our residential land over recent decades?

There are two main structural factors.

The first is the combination of financial liberalisation and low inflation. In the 1970s and 1980s, regulation of the financial system and high inflation served to hold down land prices artificially. They did this by limiting the amount that people could borrow. When the financial system was liberalised and low inflation became the norm, people’s borrowing capacity increased. Many Australians took advantage of this and borrowed more in an effort to buy a better property than they previously could have done. But, of course, collectively we can’t all move to better properties. And so the main effect of increased borrowing capacity was to push up housing prices, and that means land prices.

The second factor is the combination of strong population growth and the structural difficulties of increasing the effective supply of residential land. Since 1989, the Australian population has increased by more than 40 per cent, or around 7 million people, one of the fastest rates of increase among the advanced economies. The difficulties of responding to this on the supply side of the housing market have been well documented. They include the challenges of developing land on the urban fringe and of rezoning land close to city centres for urban infill. They also include, in some areas, underinvestment in transportation infrastructure. This underinvestment has effectively constrained the growth in the supply of ‘well-located’ land at a time when demand for this type of land has grown very strongly. The result has been a higher average price of land in our major cities.

Another possible structural explanation is that the higher land prices reflect an upward revision to people’s expectations of future income growth and thus the amount they are prepared to pay for housing services. One possible reason for this is that the growth of our cities generates a positive externality – by bringing more people together competition is improved and productivity is higher. While this might be part of the story, I think it is unlikely to be a central part. Real income growth per capita did pick up markedly from around the mid 1990s, but it has subsequently slowed substantially, with apparently little effect on the price of land relative to income.

So the story is really one of increased borrowing capacity, strong population growth and a slow supply response.

It is arguable that the main impact of higher land prices is not really to increase our national wealth, but to change the distribution of that wealth.

The distributional effects are in two dimensions. The first is cross-sectional, with the existing owners of dwellings receiving capital gains when land prices increase. The second is the distribution of wealth across generations, with the current owners of dwellings earning capital gains but future generations paying higher housing costs. Both of these aspects of changing wealth distribution have economic and social consequences, neither of which, I suspect, are yet fully understood.

How the intergenerational distribution ultimately plays out will depend critically upon the extent to which the gains that have accrued to the current generation are passed on to the next generation. In general, we know relatively little about intergenerational transfers, but what we do know suggests that things may be changing gradually. One illustration of this can be seen in the Household, Income and Labour Dynamics in Australia (HILDA) Survey, which suggests that, over time, there has been some increase in the share of first-home buyers that are receiving loans from family and friends. There is also some evidence of younger generations receiving increased assistance with household expenses from older generations, including by continuing to live in the family home.

Graph 8: First-home Buyers that Received Loan from Family or FriendsThree issues relevant to monetary policy that are closely related to the issues I have been talking about.

Higher land prices and spending

The first of these is the link between higher housing prices and household spending.

There is a well-established research literature empirically demonstrating that higher housing wealth boosts household consumption. For example, work done by my colleagues at the Reserve Bank of Australia (RBA) has estimated that a rise in wealth of $100 leads to a rise in non-housing spending of between $2 and $4 per year.

There are two commonly accepted channels that explain this relationship.

The first is a pure wealth channel. To the extent that higher dwelling prices are perceived to increase wealth, households should spend a little of that extra wealth each year over their lifetime.

The second is the collateral channel, as higher land prices increase the value of collateral that can be posted by potential borrowers. The increased collateral makes it easier for credit-constrained households to borrow to increase their spending. Similarly, businesses can find it easier to finance projects that previously might have struggled to get finance.

Over recent years, there has, however, been some reinterpretation of the role of the pure wealth channel.

In part, this reflects the issues that I was speaking about a few moments ago; that is, that higher housing prices not only deliver capital gains to the existing owners but also imply a higher price of future housing services. The reinterpretation of the evidence is that the link between housing wealth and spending arises not so much through the traditional pure wealth channel, but rather because higher housing prices are sometimes a proxy for faster expected income growth into the future. And it is this lift in expected income growth that spending is really responding to.

Interestingly, other colleagues at the RBA have recently been examining this idea, again using household level data from the HILDA Survey. They find clear evidence in favour of a collateral channel, especially for younger households who are more likely to be credit constrained. In contrast, they find no evidence in favour of the traditional pure wealth effect. Instead, their evidence is consistent with the alternative expected-income idea. Perhaps, the most intriguing aspect of their results is that when housing prices in a particular area increase, renters in that area increase their consumption. The increase is not as large as for owner occupiers, but it is an increase. The conclusion that my colleagues reach is that it is a common third factor such as higher expected future income, or less income uncertainty, that is, at least partly, responsible for the observed association between housing wealth and spending.

If this conclusion is correct, then I think it helps partly explain what is going on in the economy at the moment. In the early 2000s, when housing prices and real incomes were rising quickly, many households used the higher value of their housing assets to increase their spending. Nowadays, this is not happening on the same scale that it once was. With slower expected future income growth and increased concerns about future housing costs, the response to higher housing prices looks to be smaller than it was previously. And this smaller response is affecting overall spending in the economy.

Liabilities and risk

The second issue that I wanted to touch on is the increase in debt that has accompanied the increase in land prices.

Throughout this talk I have barely touched on the liability side of the balance sheet. This is largely for the reason that I spoke about at the start, namely that financing transactions that are internal to the country do not change Australia’s net wealth. However, these transactions can have a material impact on the profile and riskiness of the individual balance sheets within the economy.

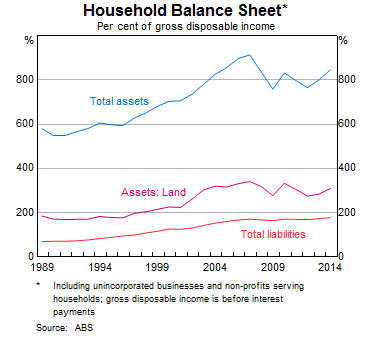
The rise in land prices that I have spoken about is inextricably linked to the rise in household borrowing. Together, these two developments have grossed up the household sector’s balance sheet. This means that, on the assets side of the balance sheet, a given percentage change in housing prices has a bigger effect than it once did. And on the liabilities side, movements in interest rates also have a bigger effect.

Graph 9: Household Balance Sheet We are still trying to understand fully the implications of all of this. However, I think it is difficult to escape the conclusion that household balance sheets are, on average, a little more risky than they once were. Many Australian households also seem to have reached a similar conclusion. This is reflected in the decision by many Australians to take a more prudent approach to their spending over recent years.

I suspect that it is unlikely to be in our national interest for this more prudent approach to give way to household consumption once again growing consistently much faster than our incomes. This is something we continue to be cognisant of in the setting of monetary policy. Some decline in the rate of household saving is probably appropriate as the economy rebalances after the terms of trade and mining investment booms. But, given the position of household balance sheets, it is unlikely to be in our long-term interest for a consumption boom to be financed by a pick-up in household borrowing.

Generating growth

That brings me to my final issue: that is the need to generate sustainable growth in the economy.

Monetary policy can play some role here, including by helping reduce uncertainty by maintaining low and stable inflation and overall stability in the economy. But monetary policy is, ultimately, not a driver of medium-term economic growth. Indeed, while low interest rates are currently helping the economy through a period of transition, an extended period of low interest rates implies ongoing low returns to savers and low underlying returns on assets. This is not a world to which we should aspire.

One of the challenges we face as a country is to lift the expected risk-adjusted return on investment in new assets, whether they be physical assets or human capital. If we can do this, then we will see the investment in new assets that is crucial to the sustainable expansion in the economy.

There is no single lever that can be pulled here. But neither is there a shortage of sensible ideas that, if implemented, could improve the environment for the creation of new assets in Australia.

These ideas include: a strengthening of the culture of innovation; the removal of unnecessary and overly complicated regulation; and making competition work effectively in markets across the country. Increased investment in infrastructure, including in transport, probably also has a role to play here. Done properly, it could help lift the return to other forms of investment in a wide range of industries across the economy. Better transportation can also increase the effective supply of well-located land, making housing more affordable for many Australians. None of this is easy, but neither is it impossible.

Is Housing Credit That High?

In the RBA’s latest Statement on Monetary Policy, they explore the impact of off-set accounts on the total household debt outstanding.

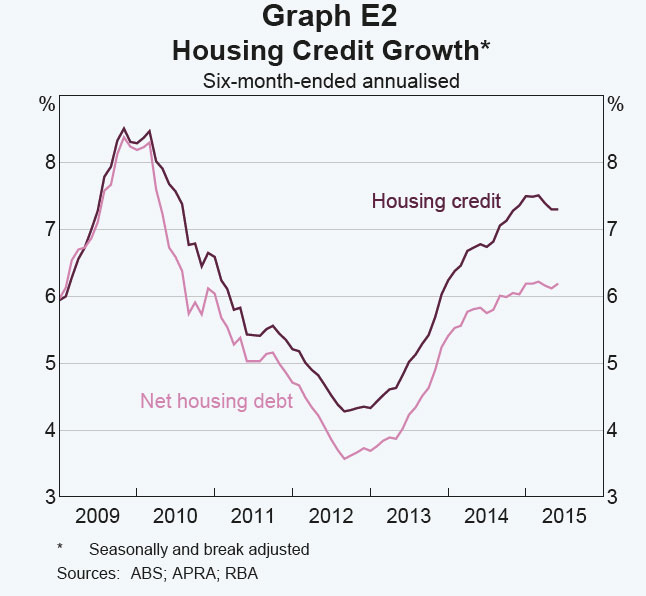
The increase in housing credit growth over recent years has been accompanied by rapid growth in loan products that provide borrowers with access to offset accounts. Offset accounts are a type of deposit account that are directly linked to a loan, such as a mortgage. Funds deposited into offset accounts effectively reduce the borrower’s net debt position and the interest payable on the loan. Offset account balances currently amount to around $90 billion, equivalent to over 6 per cent of housing loans outstanding. Since offset account balances have been growing by around 30 per cent annually over recent years, annual growth in net housing debt, which takes into account offset accounts, is about 6 per cent. This compares with annual growth in housing credit of around 7 per cent.

The RBA compiles monthly statistics that measure the stock of outstanding credit. Changes in the stock of credit reflect various flows during the month. In the case of housing credit, for example, borrowers are required to make scheduled repayments and often also have the option of making additional repayments, which are referred to here as mortgage prepayments. Mortgage prepayments include those for loans with redraw facilities, which give the borrower the option of withdrawing accumulated
prepaid funds in the future. All mortgage payments, whether scheduled or prepaid, reduce the stock of outstanding credit, thereby reducing the rate of growth of credit. When households choose to pay back their mortgage faster than scheduled by making prepayments, this lowers credit growth.

Offset accounts are an alternative form of mortgage prepayment that are not treated as such when measuring housing credit. An offset account typically acts like an at-call deposit account, with funds in the account netted against the borrower’s outstanding mortgage balance for the purposes of calculating interest on the loan. Because it acts like an at-call deposit account, any accumulated funds are easily available for withdrawal or for purchasing goods and services.  As mentioned above, balances in offset accounts have been increasing rapidly, with growth over recent years around 30 per cent. This growth has the potential to continue as older loans that are less likely to have offset accounts are replaced with new loans, where it is more common to have an offset account. Available redraw balances, at around $120 billion, are larger than offset account balances, but have grown at a pace closer to 10 per cent over recent years.

For a household with a mortgage, mortgage prepayments made using a redraw facility or a deposit into an offset account have a similar economic effect. In both cases, a household’s net housing debt and interest payable are reduced. Thus, while the effect on household balance sheets differs – loans and deposits are higher than they otherwise would be if offset accounts are used – net housing debt is the same. Since offset account balances have been growing much more rapidly than housing credit, net housing debt is growing more slowly than housing credit; over the six months to June, annualised net housing debt growth was around 6 per cent, compared to 7 per cent for housing credit growth (Graph E2). RABE2Aug2015The effect is slightly larger for credit extended to investors than to owner-occupiers, reflecting the fact that investor offset account balances have grown more quickly than balances for owner-occupiers. Offset account balances have also been making a significant contribution to household deposit growth; excluding offset account balances reduces growth in household deposits by around 1 percentage point to 71/2 per cent.

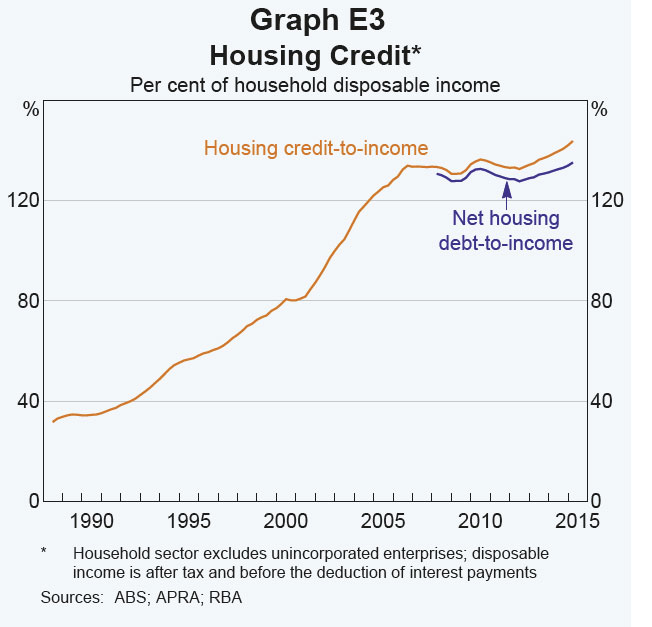
The treatment of offset account balances also has implications for measuring the household debt-to-income ratio. Housing credit is the major component of household debt. Without adjusting the stock of outstanding housing credit for offset account balances, housing debt as a share of household disposable income has been increasing since mid 2012 to be at a historical high of 144 per cent (Graph E3). Adjusting for offset account balances suggests that this ratio has been rising at a slower pace, and has only just surpassed its most recent peak in late 2010.

RBAE3Aug2015


RBA Says Financial Stability More Important Than More FTB Housing Entry

In her opening Statement to House of Representatives Standing Committee on Economics Inquiry into Home Ownership, Luci Ellis, Head of Financial Stability Department makes a telling point. From the RBA’s perspective, financial stability is more important than easing lending standards for first time buyers. They also recognise that the rise of investors is pushing prices higher, and excluding some FTB market aspirants. No reference though to the changed behaviour of FTB who are now going direct to the investment sector, a significant move in our view, as recently discussed. They also see property as a saving vehicle for old age which is further recognition property is regarded as just another asset class from a wealth accumulation perspective.

The Reserve Bank recognises the importance of housing to Australians: it provides us with shelter; housing costs are a large part of household spending; and a home is the biggest purchase that many of us will make. It is therefore no surprise that housing-related issues have been the subject of several inquiries over the past decade or so.

Within that broader realm of housing, the Bank recognises that home ownership is an aspiration of many Australians. Outright home ownership is widely regarded as key to avoiding poverty in old age. Before that life stage, home ownership is also regarded as a way to obtain the security of tenure that is so important to the wellbeing of many households, especially families with dependent children. Security of tenure can allow households to enjoy stable arrangements for education, child care and community engagement; it avoids the costs and disruptions involved in frequent moves, which many renters experience.

The interest of the Reserve Bank in housing-related matters goes to the heart of its mandated policy responsibilities. The housing sector is one of the most interest rate sensitive parts of the economy. So a significant part of the transmission of the Board’s monetary policy decisions to the real economy comes via housing markets.

Housing market developments are also highly relevant to the Reserve Bank’s mandate to promote financial stability. Housing is the most important asset class for the household sector; it provides security for the finance of many small businesses; and housing-related lending represents a large fraction of the business of the Australian banking system. History shows that housing loans have not generally been as risky as other loans, but such is the size of the sector, the risks involved are nonetheless important. Recent history from around the world also shows that although households’ mortgage borrowings typically do not instigate financial crises and distress, they can do so if the institutional arrangements and lending standards are configured to allow it. Australia is a long way from that situation and we want to ensure that remains true. More broadly, we want to promote financial stability by making sure that Australians are generally resilient to the financial shocks that might come their way. How much they pay for housing and how they finance that purchase strongly influence their resilience.

As the Reserve Bank’s submission to this Inquiry outlined, trends in the housing market and in patterns of home ownership have shifted over recent decades. Perhaps the most obvious shift was the significant increase in housing prices relative to incomes between the late 1990s and mid 2000s. As the Bank has explained on previous occasions, most of this increase was in response to financial liberalisation and to the decline in inflation in the early 1990s. These were one-off changes, so this transition will not be repeated. And because the rise in housing prices was largely driven by a decline in mortgage interest rates, it does not necessarily imply that purchasing a home and servicing a mortgage afterwards has become less achievable. Indeed during this period, Australia’s overall home ownership rate was broadly stable. At the same time, the amount and quality of housing that Australians actually consumed, in terms of size of home, number of bedrooms and so forth, has, if anything, increased.

Of course, beyond these broad aggregates, people’s individual circumstances differ, and therefore so do their housing experiences. Within that broadly stable overall rate of home ownership, the rate for younger households has declined somewhat over time. These are the core age groups of first-time buyers. At least some of that decline occurred before the marked rise in housing prices relative to income, so it cannot all be attributed to affordability issues.

Whether home ownership is affordable depends on one’s definition and is open to debate. But there is no disputing that housing is expensive. It is clear that part of the reason for this is that demand is strong. Over the longer term, this can be at least partly explained by the effects of disinflation and financial liberalisation that I referred to earlier. More recently, demand has been boosted by population growth and by declines in interest rates.

As also noted in the Reserve Bank’s submission, Australia faces a number of longstanding challenges in meeting that strong demand. The population is highly urbanised and concentrated in a few large cities, and housing prices are typically higher in large cities. Australia’s cities are unusually low density compared with those in other developed countries, so the urban fringe locations where first home buyers have typically located are therefore becoming further out and potentially inconvenient for access to jobs and some services. Some of our major cities also face geographic constraints on their expansion. All of these factors tend to increase the price of well-located housing. In addition, the cost of providing new supply can be quite high because of the costs and delays involved in obtaining all the necessary approvals and in providing the necessary infrastructure to service the land.

Another area where Australia seems quite unusual is that most rental housing is owned by private individuals who are not full-time professional landlords. Investor interest in property has been especially strong in recent years, no doubt partly encouraged by low interest rates and the prospect of (concessionally taxed) capital gains. Investors typically have more equity and borrowing capacity than first home buyers and perhaps also other owner-occupiers, and might therefore be more able and willing to pay higher prices than other types of buyers for particular properties. The result has been that the housing sales market has become unusually concentrated in investor activity, particularly in the larger cities. At the margin this has probably priced some aspiring first home buyers from properties they could otherwise acquire. Nonetheless, while there has been much debate on this issue, from a financial stability point of view it is helpful that there has been no push to improve the position of first home buyers by easing lending standards. As recent experiences in other countries have shown, such a step would probably be counterproductive in the longer run.

RBA Cash Rate Unchanged

At its meeting today, the Board decided to leave the cash rate unchanged at 2.0 per cent.

The global economy is expanding at a moderate pace, but some key commodity prices are much lower than a year ago. Much of this trend appears to reflect increased supply, including from Australia. Australia’s terms of trade are falling nonetheless.

The Federal Reserve is expected to start increasing its policy rate later this year, but some other major central banks are continuing to ease policy. Hence, global financial conditions remain very accommodative. Despite fluctuations in markets associated with the respective developments in China and Greece, long-term borrowing rates for most sovereigns and creditworthy private borrowers remain remarkably low.

In Australia, the available information suggests that the economy has continued to grow. While the rate of growth has been somewhat below longer-term averages, it has been associated with somewhat stronger growth of employment and a steady rate of unemployment over the past year. Overall, the economy is likely to be operating with a degree of spare capacity for some time yet. Recent information confirms that domestic inflationary pressures have been contained. That should remain the case for some time, given the very slow growth in labour costs. Inflation is thus forecast to remain consistent with the target over the next one to two years, even with a lower exchange rate.

In such circumstances, monetary policy needs to be accommodative. Low interest rates are acting to support borrowing and spending. Credit is recording moderate growth overall, with growth in lending to the housing market broadly steady over recent months. Dwelling prices continue to rise strongly in Sydney, though trends have been more varied in a number of other cities. The Bank is working with other regulators to assess and contain risks that may arise from the housing market. In other asset markets, prices for equities and commercial property have been supported by lower long-term interest rates. The Australian dollar is adjusting to the significant declines in key commodity prices.

The Board today judged that leaving the cash rate unchanged was appropriate at this meeting. Further information on economic and financial conditions to be received over the period ahead will inform the Board’s ongoing assessment of the outlook and hence whether the current stance of policy will most effectively foster sustainable growth and inflation consistent with the target.
Investment Property Lending Sucking Finance From Business

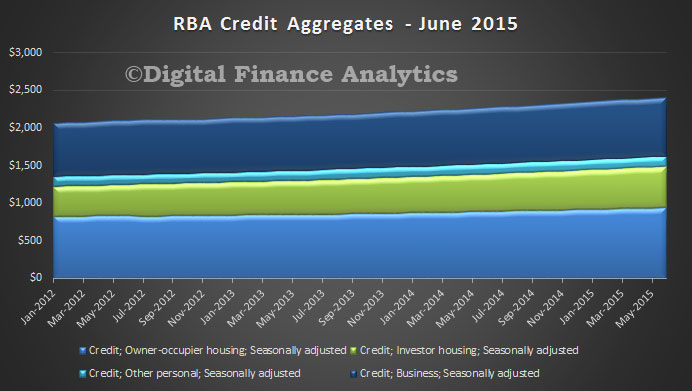
The latest data form the RBA on credit aggregates to June 2015, tells the continuing story of growing investment property lending, and a relative reduction in lending to business. The data on total loans outstanding (stock) shows there was a fall in lending to business in the month of 0.36%, which translates to a growth of 4.3% for the year to $789 bn. On the other hand, lending for housing rose 0.6% in the month, and 7.3% for the year, (higher than last year at 6.4%) to $1,481 bn. Owner occupied housing rose 0.47% to $945 bn, whilst investment lending grew 1.10% to $536 bn. Other personal lending rose 0.15% to $137 bn.

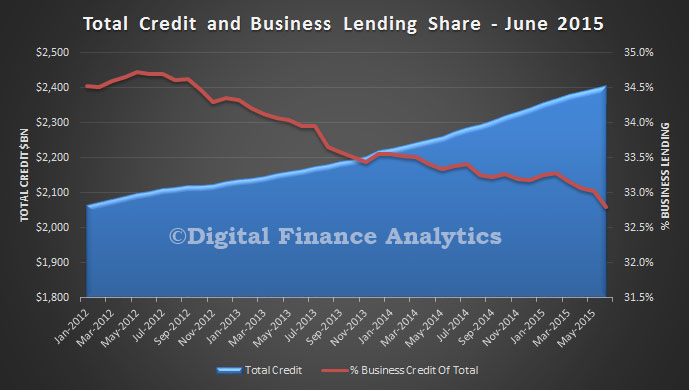
RBA-Credit-June-2015Total lending to business as a share of all lending fell again to 32.8%, this is not healthy as productive growth comes from business investing in their futures. This is not as strong as we need to sustain the economy.

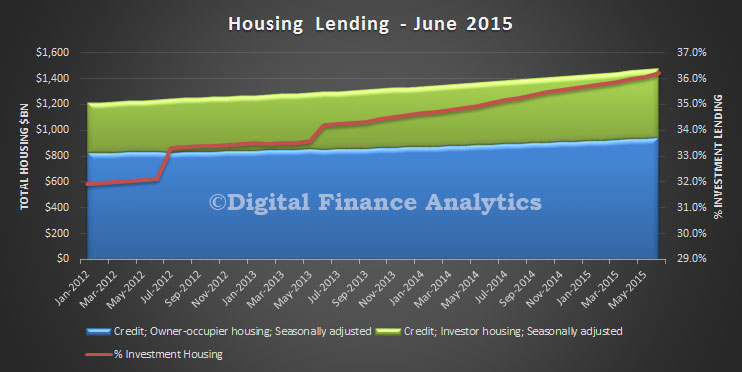
RBA-CreditBusiness-June-2015Looking at the mix of lending for housing, investment lending was up to 36.2%. It has never been higher. This inflates house prices, and banks balance sheets, but the wealth is artificial, and unproductive.

RBA-CreditHousing-June2015 Finally we think there are some funnies in these numbers, which when we have completed the analysis of the APRA monthly banking statistics, we will comment on further. Suffice it to say, it seems maybe some loans were reclassified last month from owner occupied to investor loans, so might be distorting the data.

RBA Minutes Says Impact Of Investment Lending Scrutiny Not Showing Yet

The RBA released their minutes today for July. Little new really, though they comment that housing credit growth had been steady and remained relatively strong for investors in housing, although it had not accelerated. Any effects of regulators’ greater scrutiny of investor lending were probably not yet evident in the data. We expect to see the impact of the brakes being applied by the banks in the next quarter but our surveys continue to show strong demand from the investment sector.

The Board’s discussion about economic conditions opened with the observation that economic growth in Australia’s major trading partners appeared to have been around average in the June quarter. Consumption growth had been little changed for most trading partners in recent months, although it was perhaps a bit stronger in the United States and somewhat weaker in China. The level of consumption in Japan remained well below that seen prior to the increase in the consumption tax in 2014. Core inflation rates had been stable in year-ended terms over recent months and remained below the targets of most central banks. Members also observed that trade volumes, particularly within the Asian region, appeared to have fallen recently. Consistent with this observation, growth in industrial production across a number of east Asian economies had slowed a little.

In China, there had been little change in the monthly indicators of economic activity, although conditions had been a bit more positive in some sectors than early in 2015. The Chinese property market had improved somewhat; residential property prices overall had risen for the first time in a year and floor space sold had increased in the past few months. Members reflected that the recent easing in monetary conditions would provide additional support to the property market and growth more broadly, although it could be some time before a significant pick-up in construction activity began. Recent efforts by central government authorities to increase infrastructure investment further and reform local government financing arrangements were also expected to support investment.

Commodity prices overall had fallen since the previous meeting, driven by iron ore and oil prices. Growth in crude steel production had been modest and steel prices had fallen noticeably over the past month. Iron ore production in China had continued to decline. Shipments of iron ore from Australia and Brazil appeared to have increased in June, which contributed to lower iron ore prices over the past month.

Following quite strong output growth in Japan in the March quarter, more timely indicators pointed to modest growth in the June quarter. Labour market conditions had continued to improve, resulting in the unemployment rate falling further and the ratio of jobs to applicants continuing to rise. Wage growth and financial market measures of inflation expectations were higher than a year earlier and were expected to feed into higher core inflation over time. Members considered the importance for Japan of policy reforms designed to address some longer-term structural challenges, such as the ageing of the population.

In the United States, recent data pointed to moderate growth in economic activity in the June quarter following weakness in the March quarter. The labour market had strengthened further, with growth in non-farm payrolls employment rebounding in April and May and the unemployment rate falling. While there had been some increase in measures of wage growth, core measures of inflation remained below the Federal Reserve’s inflation target.

In the euro area, the available indicators pointed to modest economic growth and above-average sentiment in the June quarter, continuing the recent trend of improved conditions in the euro area as a whole. Members noted that exports had made a significant contribution to the pick-up in growth in the region but investment was still well below the levels seen prior to the global financial crisis. The unemployment rate had continued to fall modestly since its peak two years earlier, but varied sharply across the euro area; the unemployment rate was highest in Greece, where output was more than 25 per cent below its level prior to the financial crisis.

Domestic Economic Conditions

Members noted that output had increased by 0.9 per cent in the March quarter and by 2.3 per cent over the year. Resource exports had made a significant contribution to growth, reflecting better-than-usual weather conditions in the quarter. Dwelling investment had remained strong and while consumption growth had picked up over the past year or so, it had remained below average. Business investment had contracted in the quarter and there had been little growth in public demand. More recent economic indicators suggested that domestic demand had continued to grow at a below-average pace over recent months, but that labour market conditions had continued to improve.

Members observed that consumption grew faster than household income over the year to the March quarter. As a result, the saving ratio had declined further, although it remained well above the level it had been over much of the past 25 years. Year-ended growth in retail sales had been little changed over recent months and liaison suggested that this was likely to have continued into June. Retail sales growth had been relatively strong in New South Wales and Victoria but weaker in Queensland and Western Australia, in line with observed differences in economic conditions across the country. At the same time, surveys indicated that consumers had viewed their financial situation as being above average over the past year, notwithstanding the relatively weak growth in labour incomes. Members observed that this was likely to reflect the very low level of interest rates and strong growth in net household wealth.

Dwelling investment increased by 9 per cent over the year to the March quarter. An increase in the construction of new dwellings accounted for most of this growth, but the alterations and additions component had also contributed more recently, recording the first increase in a year in the March quarter. Forward-looking indicators pointed to further strong growth in dwelling investment in the period ahead. Members noted that there had been ongoing divergence in conditions in established housing markets across the country, as well as between houses and apartments. Housing prices had continued to rise rapidly in Sydney and to a lesser extent in Melbourne. Elsewhere, there had been little change in housing prices over the past six months or so. Prices of apartments had been growing less rapidly than those of houses, which members considered to be consistent with the relatively strong growth in the supply of higher-density housing in many capital cities.

Growth in housing credit overall had been stable over recent months at around 7 per cent on an annualised basis, while growth in lending to investors had been steady at a bit above 10 per cent. Members observed that the household debt-to-income ratio, calculated by netting funds held in mortgage offset accounts from total household debt to the financial sector, had increased over the year to March but had not exceeded previous peaks. Members discussed the fact that high housing prices had different implications for existing home owners, who benefited from increased wealth, and potential new home owners, who were finding it more difficult to finance a home purchase.

Investment in both the mining and non-mining sectors appeared to have fallen in the March quarter, although the split between the two components remained subject to some uncertainty. Profits for non-mining firms had increased by 6 per cent over the past year. More recent survey measures of business conditions, confidence and capacity utilisation had picked up to be around, or even above, their long-run averages. In contrast, private non-residential building approvals had remained weak.

The monthly trade data suggested that resource exports, including iron ore and coal, had declined in the June quarter. Coal exports had been affected by the severe storms in the Hunter region of New South Wales in late April. Members noted that there had been further signs of growth in service exports, in part a response to the depreciation of the exchange rate. Over the past year, net service exports had made a similar contribution to output growth as exports of iron ore, even though total import volumes had increased in the March quarter.

Labour force data indicated further signs of improvement in May. Employment growth had picked up over the year to exceed the rate of population growth. As a result, the unemployment rate had been relatively stable since the latter part of 2014 and had fallen slightly in May to 6 per cent. Members observed that employment growth had been strongest in household services and that employment and vacancies had been growing for business services but had remained little changed in the goods sector. As with other state-based indicators, employment growth and job vacancies had been strongest in New South Wales and Victoria. Forward-looking labour market indicators had been somewhat mixed over recent months. The ABS measure of firms’ job vacancies overall suggested that demand for labour could be sufficient to maintain a stable or even falling unemployment rate in the near term, while other forward-looking indicators suggested only modest growth in employment in coming months.

Members noted that the latest estimates indicated that the population had increased by 1.4 per cent over the year to the December quarter, down from a peak rate of growth of 1.8 per cent over 2012. The slower growth was primarily accounted for by a decline in net immigration, which was particularly pronounced in Western Australia and Queensland, consistent with weaker economic conditions in those states. Members observed that the lower-than-expected growth in the population helped to reconcile the below-average growth in output over the past year with a broadly steady unemployment rate.

Despite recent improvements in labour market indicators, members reflected that there was still evidence of spare capacity in the labour market. Consistent with this, the latest national accounts data indicated that non-farm average earnings per hour had recorded the lowest year-ended outcomes since the early 1990s and that unit labour costs had been little changed for around four years.

Financial Markets

International financial markets were mainly focused on developments in Greece and the fall in Chinese equity markets over the past month.

Members were briefed on recent developments in Greece. The ‘no’ vote in the referendum on the creditors’ latest proposals raised several issues, first among which was how the Greek authorities could reopen the banks. A critical vulnerability in the near term was related to whether the European Central Bank would provide additional emergency liquidity assistance. A second issue was how Greece would be able to service its external debt and a third was the challenges faced by the Greek authorities in improving the competitive position of the economy. Although these issues were of great concern to the Greek populace, the direct economic implications for the global economy and Australia were assessed by members to be relatively limited. They noted that the reaction of financial markets to these developments had been fairly muted. This was consistent with the economic and financial exposures to Greece – apart from the official sector’s financial exposure – being quite low.

Members noted that spreads to 10-year German Bunds on comparable bonds issued by Italy, Spain and Portugal had not risen much, with the limited contagion from developments in Greece likely to have reflected a general view of markets that previous adjustment policies in those countries had been relatively successful.

Members then turned their discussion to developments in bond markets more generally. Yields on longer-maturity German Bunds and US Treasuries had risen sharply over the first half of June, with German 10-year yields reaching 1 per cent, compared with a historic low of 8 basis points in mid April. German yields declined somewhat following the announcement of the Greek referendum. Longer-term sovereign yields of most other developed countries, including Australia, tended to move in line with US Treasuries.

Expectations about the timing of the US Federal Reserve’s first increase in the federal funds rate were little changed over the past month. Market pricing continued to suggest that the first increase would occur around the end of 2015. Although commentary by Federal Reserve officials suggested that it could be a little sooner than that, they continued to emphasise that the exact timing of the first increase would be less important than the pace of subsequent increases, which were expected to be gradual.

The People’s Bank of China (PBC) eased monetary policy further in June by cutting benchmark deposit and lending rates by 25 basis points, citing low inflation and a consequent increase in real interest rates. In addition, the PBC announced cuts to the reserve requirement ratio for selected financial institutions. The Chinese authorities had also announced a proposal to allow banks more flexibility in their choice of funding mix and asset allocation, which could lead to an increase in the supply of credit over time.

The Reserve Bank of New Zealand lowered its policy rate by 25 basis points, to 3.25 per cent, citing the decline in New Zealand’s terms of trade and the disinflationary effect of stronger-than-expected labour force growth.

Global equity markets fell by 3 per cent over the course of June, with broad-based falls and price movements generally tending to reflect fluctuations in sentiment about Greece. The Chinese equity market also fell sharply in June, partly in response to what was only a modest tightening of restrictions on margin lending. Mainland share prices were still well above their levels of a year earlier but the sharpness of the recent fall prompted the Chinese authorities to announce a number of measures, including an indefinite suspension of initial public offerings, an equity stabilisation fund and a funding facility for brokers. The Australian equity market underperformed several other advanced economy markets in June, mainly reflecting falls in resources and consumer sector share prices.

Global foreign exchange markets were relatively subdued in June. The euro recorded only a modest and short-lived fall when markets opened after the announcement of the Greek referendum result. The Australian dollar was 3 per cent lower against the US dollar and on a trade-weighted basis.

Corporate bond issuance in Australia had been strong over the course of 2015 to date, particularly by resource companies, although much of the increase reflected refinancing.

Pricing of Australian money market instruments suggested that the cash rate target was expected to remain unchanged at the present meeting.

Considerations for Monetary Policy

Members noted that global economic conditions remained consistent with growth in Australia’s major trading partners being around average over the period ahead. Global financial conditions were very accommodative and would remain so even in the event that the Federal Reserve started to raise its policy interest rate later in the year. Recent data suggested that conditions in Chinese property markets had improved and the authorities had acted to support activity by easing a range of policies further. Members noted that the recent volatility in Chinese equity markets and potential spillovers from developments in Greece would require close monitoring.

Domestically, the key forces shaping the economy over the past year were much as they had been for some time. Very low interest rates were working to support strong growth in dwelling investment and, together with strong housing prices, had supported consumption growth. Resource exports had made a substantial contribution to growth and mining investment had declined significantly, while public demand had been flat over the past year. Although output growth in the March quarter had been stronger than expected, growth over the year remained below average and early indications were that the strength in the March quarter had not carried through to the June quarter. Non-mining business investment had been subdued and surveys of businesses’ investment intentions suggested that it would remain so over the coming year. Nevertheless, non-mining business profits had increased over the past year and surveys suggested that business conditions had generally improved over recent months to be a bit above average.

Conditions in the housing market had been little changed in the most recent months, with notable strength in Sydney. Housing credit growth had been steady and remained relatively strong for investors in housing, although it had not accelerated. Any effects of regulators’ greater scrutiny of investor lending were probably not yet evident in the data.

Recent data indicated that employment had grown more rapidly than the population and the unemployment rate had been relatively stable since the latter part of the previous year. The easing in population growth over the past year helped to reconcile below-average growth in output with the relatively steady unemployment rate. Nevertheless, spare capacity remained, as evidenced by the level of the unemployment rate, historically low wage growth and unit labour costs that had been stable for a number of years. On this basis, members assessed that inflationary pressures were well contained and likely to remain so in the period ahead.

Commodity prices had fallen further and the Australian dollar had depreciated over the past month. Although the exchange rate against the US dollar was close to levels last seen in 2009, the decline in the Australian dollar had been more modest in terms of a basket of currencies. Members noted that the exchange rate had thus far offered less assistance than would normally be expected in achieving balanced growth in the economy and that further depreciation seemed both likely and necessary.

In light of current and prospective economic circumstances and financial conditions, the Board judged that leaving the cash rate unchanged was appropriate. Information to be received over the period ahead on economic and financial conditions would continue to inform the Board’s assessment of the outlook and hence whether the current stance of policy remained appropriate to foster sustainable growth and inflation consistent with the target.