
Digital Finance Analytics maintains a series metrics and indices. These include cost and revenue benchmarks across products and channels underpinned by a common lexicon of definitions to ensure consistency. We also use data from our surveys to calculate postcode level information about mortgage stress, probability of mortgage default, household financial confidence and other elements.
These are regularly updated as a result of ongoing dialogues with clients and surveys. As a result we have a rich resource which enables us to compare business operations and profitability across businesses and customer groups. Click on the sections below to view more details, or contact us for more information.
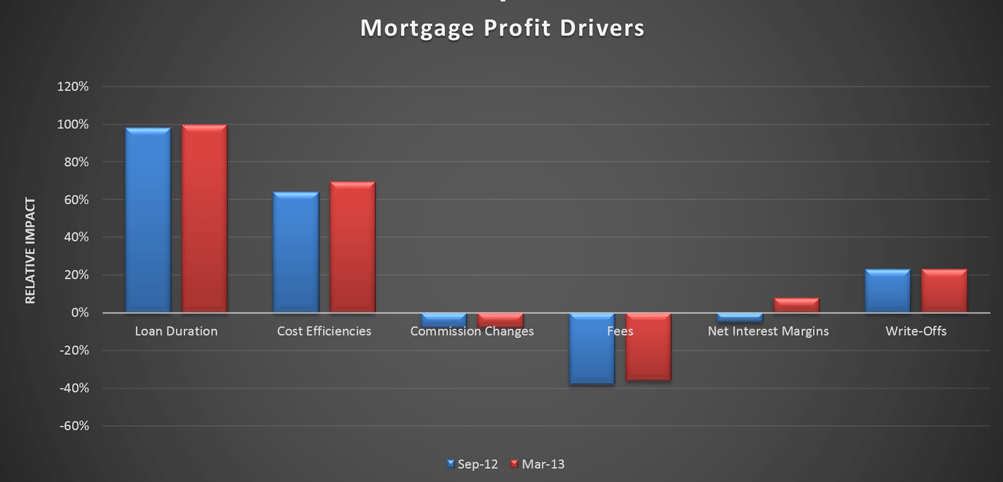
Mortgage Profit Drivers
Here we show the relative profit contribution of the various drivers in the mortgage business, and how these have changed in the last few months. Longer loan durations and cost efficiencies are having a positive impact, offset by a slight reduction in net fees. However, net interest margins have made the largest contribution to improved profitability.
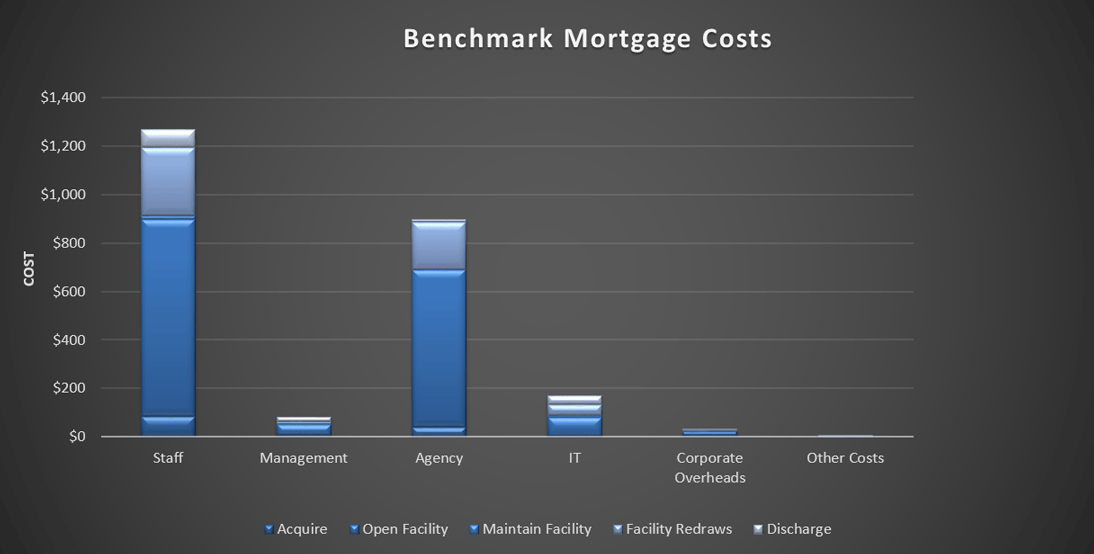
Mortgage Cost Benchmarks
We have extracted average summary costs across the mortgage value chain. The most significant costs related to staff, and third party (agency) services. Open Facility is the largest single cost related activity, because in Australia many of the processes are still not fully automated and error rates requiring rework are high by international standards.
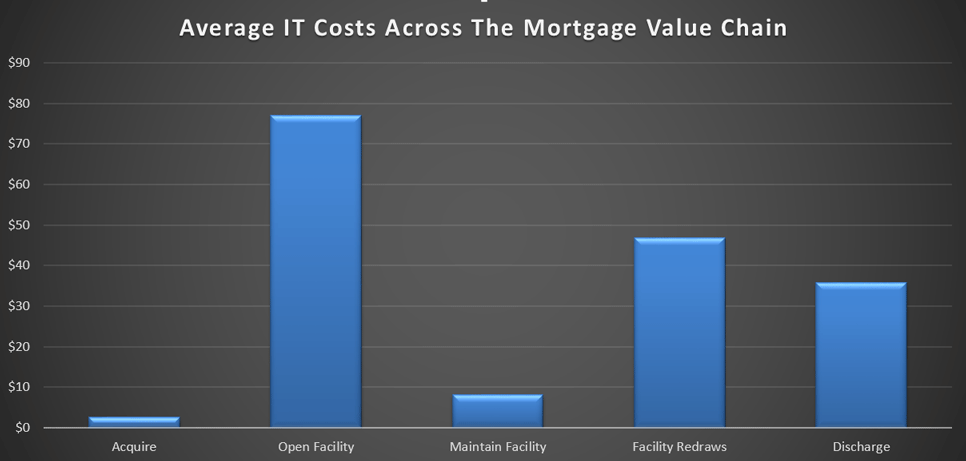
IT Related Costs in the Mortgage Value Chain
IT costs have a considerable impact on relative profitability of the business. Open Facility is the single largest element, whilst the costs of maintaining an existing loan on the banking system is relatively low. These are averages, and they vary across individual businesses, depending on IT platform, management models and use of outsourcing or cloud delivered services.
Mortgage Stress Postcode Index
Mortgage stress is a poorly defined term. The RBA tends to equate stress with defaults (which remain at low levels on an international basis). A wider definition is 30% of income going on mortgage repayments (not consistently pre-or post tax). This stems from the guidelines of affordability some banks used in 1980’s and 1990’s, when economic conditions were different from today. This is a blunt instrument. DFA does not think there is a good indicator of mortgage stress, so we use a series of questions to diagnose mortgage stress focusing on owner occupied households. Through these questions we identify two levels of stress – Mild and Severe.
Mild = households maintaining repayments, but by reprioritising expenditure, borrowing more on loans or cards, and refinancing
Severe = households who are behind with their repayments, are trying to sell, are trying to refinance, or who are being foreclosed
We maintain a rolling sample of 26,000 statistically representative households using a custom segment model nationally. Each month we execute omnibus surveys to 2,000 households. Our questions provide a current assessment of mortgage stress. We also model and project likely mortgage stress given the current and expected economic conditions.
The questions we include are:
Are you currently up to date with your mortgage repayments?
Are you concerned about being able to make your current or next mortgage repayment?
In the last six months have you had reason to delay payment of your mortgage installment?
In the last six months have you cut down on luxuries to make sure you can pay your mortgages?
In the last six months have you reprioritised your general spending patterns in order to ensure you make your mortgage repayments?
In the last six months have you found it necessary to borrow more on credit cards or loans for personal expenditure so as to enable you to pay your mortgage installment?
In the last six months have you sought to refinance your mortgage to make it easier to repay?
In the last six months have you spoken to a bank or a broker about alternative repayment options or capitalising interest?
Are you currently more than 3 months behind with your mortgage repayments?
In the last six months have you started to try and sell your property because you were unable to pay the mortgage?
Have you in the last six months received any notice of foreclosure from your mortgage provider?
In the last six months have you sold your property because of problems with making repayments?
In the last six months have you approach your lender under their customer hardship scheme?
Do you believe you are under mortgage stress?
We developed an algorithm to take answers to these questions and score the results. Here is a sample from recent work we did in Melbourne.
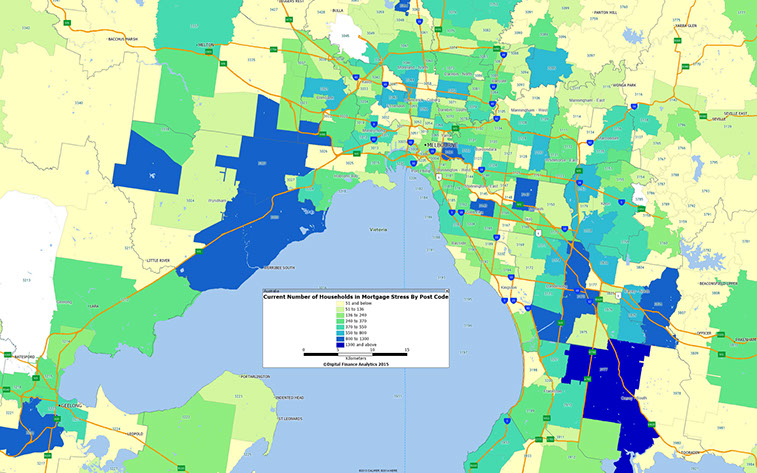
You can read about our mortgage stress research on our blog. Contact DFA for more information.
Probability of Mortgage Default Postcode Index
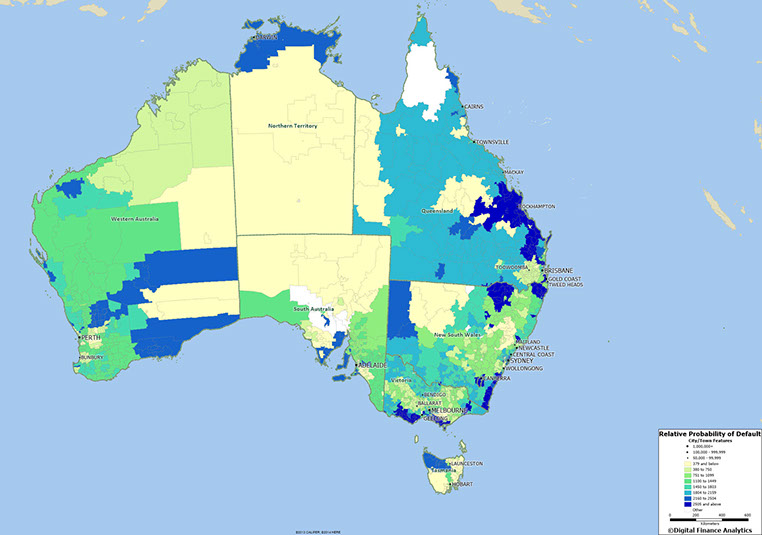
As part of our household surveys, we capture data on mortgage stress, and when we overlay industry employment data and loan portfolio default data, we can derive a relative risk of default score for each household segment, in each post code. This data covers mortgages only (not business credit or credit cards, which have their own modelling).
Given that income growth is static or falling, house prices and mortgage debt is high, and costs of living rising, (as highlighted in our Household Finance Confidence index released yesterday), pressure on mortgage holders is likely to increase, especially if interest rates were to rise, which we have argued will happen sometime (and perhaps sooner rather than later given the recent RBA commentary on jobs and capacity). In addition, the internal risk models the major banks use, will include a granular lens of risk of default.
So, some borrowers in the higher risk areas may find it more difficult to get a mortgage, without having to jump through some extra screening hoops, and may be required to stump up a larger deposit, or cop a higher rate.
Here is the national map of relative default probability. It shows the relative ranking, with the higher probability ranked 1, and clustered into meaningful groups.
We provide this data to a number of clients on a subscription basis. Contact DFA for more information about this service. You can read about our latest results on our blog.
Household Finance Confidence Index
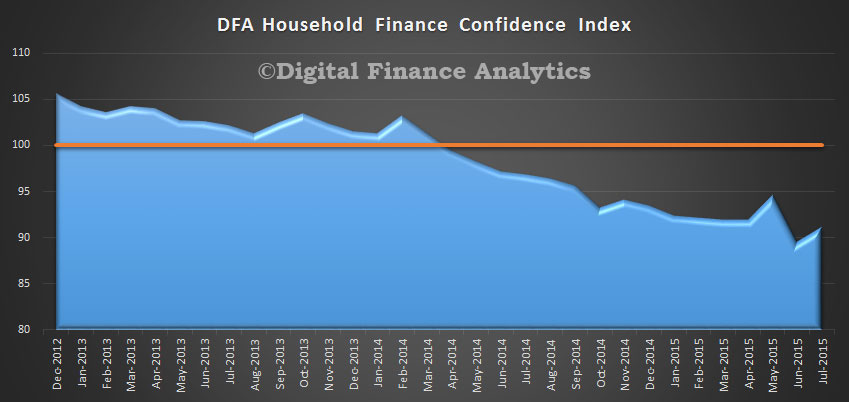
We have been surveying households on aspects of their finances for many years. We have 26,000 households in our sample at any one time. We include detailed questions covering various aspects of a household’s financial footprint. We are using this data to create a monthly index – THE HOUSEHOLD FINANCE CONFIDENCE INDEX. The index measures how households are feeling about their financial health.
To calculate the index we ask questions which cover a number of different dimensions. We start by asking households how confident they are feeling about their job security, whether their real income has risen or fallen in the past year, their view on their costs of living over the same period, whether they have increased their loans and other outstanding debts including credit cards and whether they are saving more than last year. Finally we ask about their overall change in net worth over the past 12 months – by net worth we mean net assets less outstanding debts.
The overall result for Australian households shows a gradual but significant fall in confidence over the past few months. Whilst a score of 100 would be a neutral result, the latest data to June 2015 came in at only 91. So on average, Household Finance Confidence Is Falling.
We are able on extract postcode, region or state level data on request, on commercial terms. Contact DFA for more information.
You can read the monthly data on our blog.
All information contained in this site remains the intellectual property of Digital Finance Analytics and it may not be reproduced or mirrored without specific agreement. We do not accept any liabilities for errors or omissions and will not accept any claims for consequential loss whatsoever; The site is "as is" and no guarantee is given as to its ongoing availability. Site visits are subject to these terms.

