ANZ today announced a Statutory Profit after tax for the Full Year ended 30 September 2017 of $6.41 billion up 12% and a Cash Profit of $6.94 billion up 18% on the prior comparable period. Half the uplift was related to one-off items. More of the business going forwards will be based on its Australian and New Zealand Retail businesses (a.k.a. mortgage lending!).
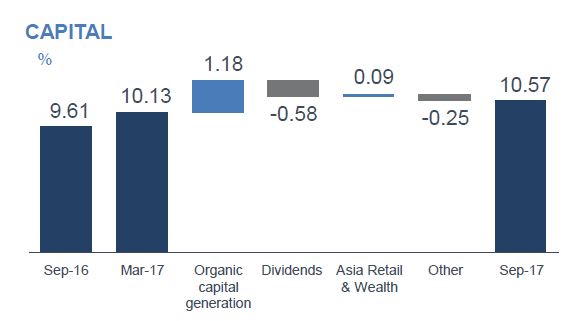
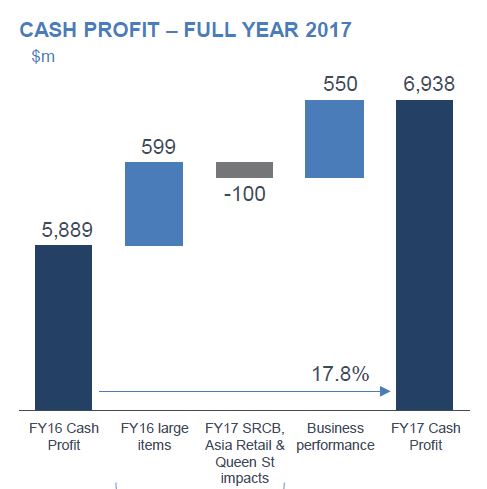 ANZ’s Common Equity Tier 1 Capital Ratio was 10.6% up 96 basis points (bps).
 Return on Equity increased 159 bps to 11.9% with Cash Earnings per Share up 17% to 237.1 cents.
 The Final Dividend is 80 cents per share, fully franked, reflecting a payout ratio of 68% of Cash Profit, moving closer to ANZ’s target fully franked full year payout ratio of 60‐65%.
At one level this is a strong result, as the contribution from asset sales flows into the business, such that Australia and New Zealand which now accounts for 53% of capital, up from 44% two years ago. As a result, they generated strong organic capital growth and the APRA CET1 capital ratio now stands at 10.6%, up from 9.6%, so they already meet APRA’s ‘unquestionably strong’ 2020 capital target. Organic capital generation of 229 bps over the year was over 50% greater than the average (140 bps)
of the past five years.
The Group has a strong funding and liquidity position with the Liquidity Coverage Ratio at 135% and Net Stable Funding Ratio at 114%.
The total provision charge of $1.2 billion equates to a loss rate of 21 bps, a decline of 13 bps over the year. Gross impaired assets over the same period decreased 25% to $2.38 billion with new impaired assets down 11%.
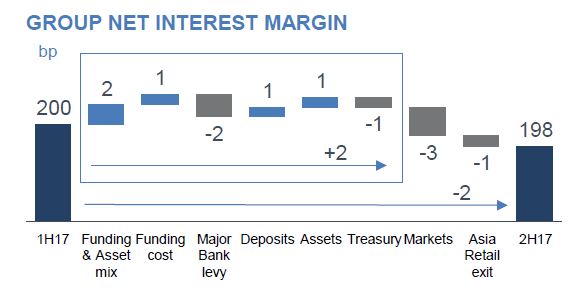
But at another level, the net interest margin is down 8 basis points on last year to 1.99%, with a fall of 2 basis points in 2H, despite the mortgage book repricing and loan switching. The Australian margin fell from 275 basis points in FY16 to 268 basis points in FY17. There was a 4 basis point impact in 2H17 as a result of the bank levy.
 Credit impairments as a percentage of average GLAs down from 0.34% to 0.21% as they de-risk the business (institutional and Asia), but grow the Retail business in Australia and New Zealand, with an emphasis on owner occupied home lending.
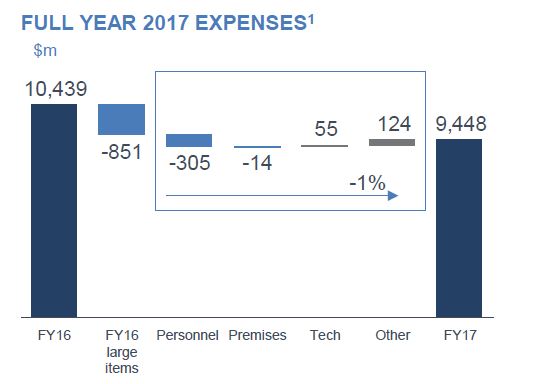
Full time staff fell from 46,554 to 44,896, so the cost base has reduced and is down year on year in absolute terms for the first time in 18 years. Costs rose in Australia by 2.7%.
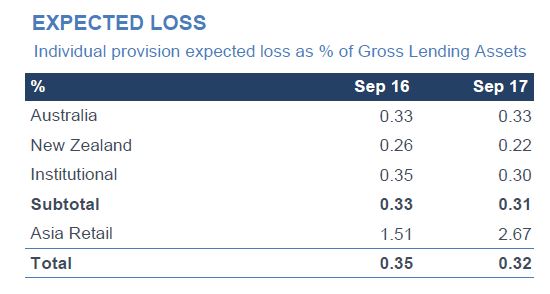
 Australian individual provisions remained at 0.33% of Gross Lending Assets, higher than the 0.22% in New Zealand but significantly lower than Asia retail.
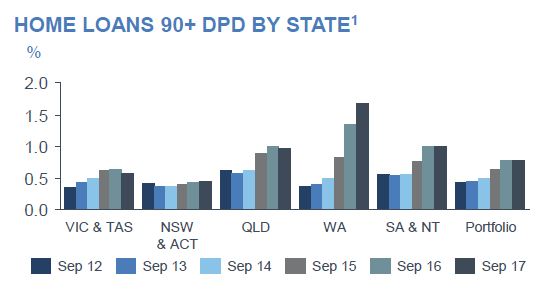
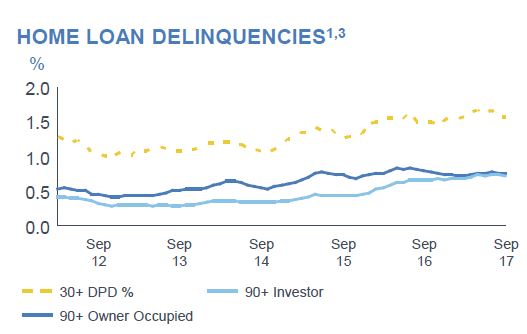
 This also exposes them to the risks of a property downturn and higher mortgage defaults. 90-Day defaults overall remained similar to last year, but with a spike in WA and a fall in VIC/TAS. (Excludes non-performing loans).
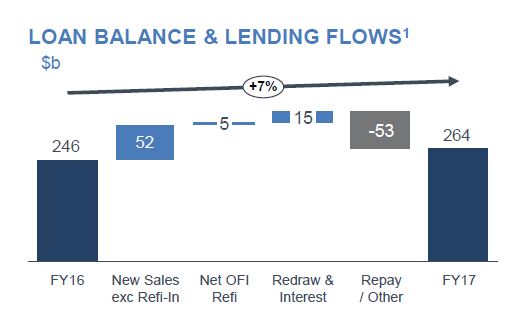
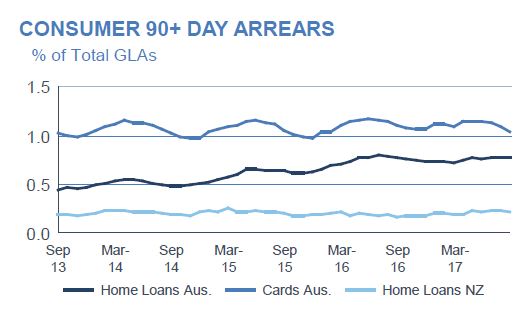 The Australian home loan portfolio grew by 7% to $265 billion. Investor loans were 32% of flow. 56% of loan flows were originated via brokers, and 51% of the portfolio were broker sourced, up from 49% in FY16. There was a rise in fixed rate lending. The portfolio is now 45% of total group lending and 64% of the Australian lending. 31% of the portfolio are interest only loans, and 27% of flow in September half to date. They say they will meet the APRA target. There was a small rise in loans with an LVR of higher than 95% in the Sept 17 period.
 Investment loan delinquencies are rising, whereas they have traditionally be lower than OO loans.
 They have tightened underwriting standards, including:
- The maximum interest only period reduced from 10 years to 5 years for investment lending to align to owner occupier lending
- Reduced LVR cap of 80% for Interest Only lending
- Interest only lending no longer available on new Simplicity PLUS loans (owner occupier and investment lending)
- Minimum default housing expense (rent/board) applied to all borrowers not living in their own home and seeking Residential Investment Loans or Equity Management Accounts.
- Restrict Owner Occupier and Investment Lending (New Security to ANZ) to Maximum 80% LVR for all apartments within 7 inner city Brisbane postcodes.
- Restrict Investment Lending (New Security to ANZ) to Maximum 80% LVR for all apartments within 4 inner city Perth postcodes
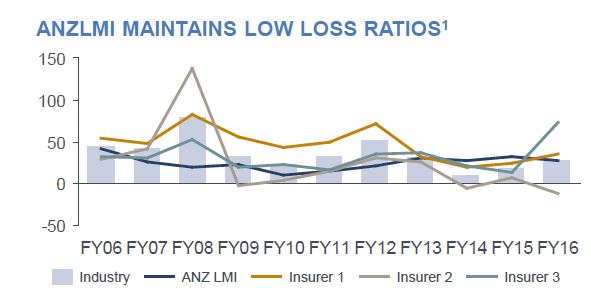
ANZ’s captive Lenders Mortgage Insurer reported stable loss ratios of 2.4 basis points.
 They warn “household debt and savings have both increased, however the ability for households to withstand economic shocks has diminished a little”. “In 2018 we expect the revenue growth environment for banking will continue to be constrained as a result of intense competition and the effect of regulation including a full year of impact of the Australian bank tax.”

2 thoughts on “ANZ FY17 Results – Look Under The Hood!”