The BIS published their 84th annual report 2013-14 recently. As well as discussing the merits of central banks relying on low interest rates to try and drive recovery from 2007, and the risks in this strategy with regards to laying the foundations for GFC mark II thanks to expanding credit; there is some interesting data on relative bank performance across several countries. We will focus attention on this data, recognising of course that making cross country comparisons is fraught with dangers because of differences in reporting. That said there are some interesting points to consider. We look at Profitability, Net Interest Margins, Losses and Costs. In each case, I have sorted the countries by the relevant 2013 data, to highlight where Australia appears relative to its peers. The data shows the number of major banks in each country, and they have averaged the results, giving three cuts of data, 200-2007, 2008-2012 and 2013. All the BIS metrics are calculated relative to total bank assets.
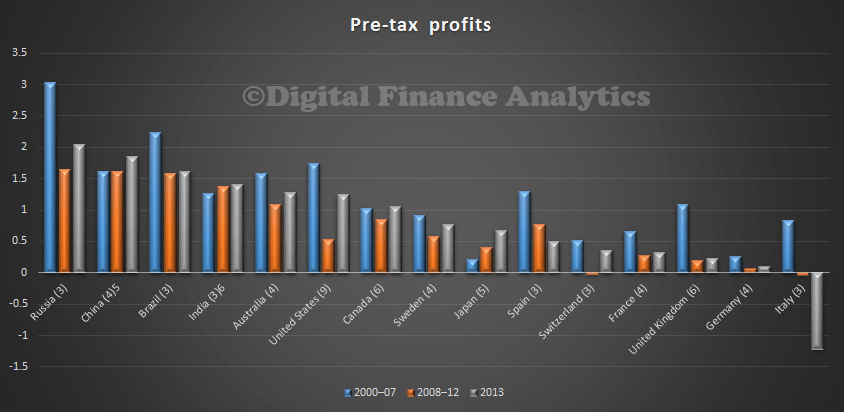
Lets first look at relative profitability. We see that Russia, China, Brazil and India all reported profitability higher than the Australian banks. However, Australia has the most profitable banks amongst advanced western countries, and is significantly more profitable than banks in Canada, Germany and UK. It is also worth noting that in Australia, banks are still not as profitable, relative to assets as they were before the GFC. But then, that is pretty consistent across the sample countries.
 So, what is driving relative profitability? Could it be net interest margins? Well, comparing margins relative to assets, Australia is somewhere in the middle, the highest margins are returned from Russia and Brazil, the lowest margins from Switzerland and Japan. Margins in Australia are however higher than Canada, Italy, UK and France. Higher margins, in my view reflect limited real competition, and we know that Australian banks have been repairing their margins by not passing on recent lower funding costs to borrowers, or savers. Small business customers are being hit quite hard. So, banks in Australia are more profitable thanks to higher margins, in a relatively benign environment competitively speaking.
 Lets look at losses. Here Australian banks have some of the lowest loss rates in the sample. The UK and USA have higher rates of loss, as do the developing economies. Only Japan. Switzerland, Sweden and Canada have lower loss rates. Actually banks in Australia have reduced their provisioning and returned some of these earlier provisions to enhance profitably recently.
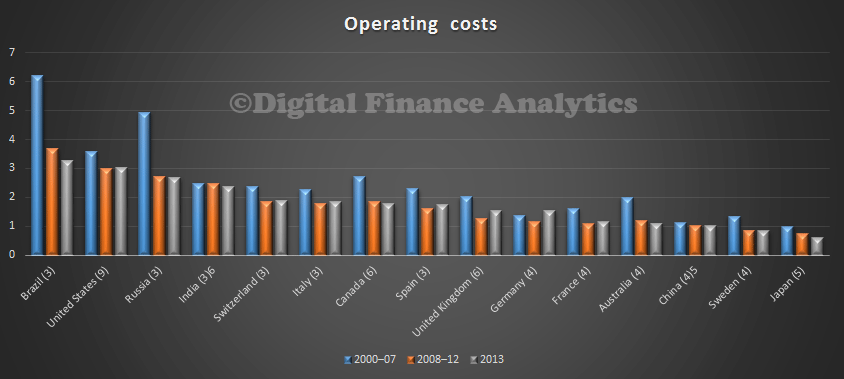
 Finally, we look are operational costs. Here again Australian banks rank well, with some of the lowest costs as a proportion of assets of all countries. Many countries including the UK. Canada and USA have higher operating costs.
 So, putting that all together, what can we conclude. Australian banks are some of the most profitable, thanks to efficient operations, low loss levels and relatively high margins. That strength should serve us well if the BIS scenario of rising interest rates comes true. However, we should not loose sight of the fact that the big four march together when in comes to pricing, products and fees. There is ample room for banks to become more competitive, and drive margins lower. Its unlikely though they will because they all enjoy the fruits of the current environment, at the expense of Australia Inc. The argument that shareholders benefit many be true, but it misses the point because that excess profitability dampens broader economic activity, thanks to higher ongoing costs.

One thought on “BIS Banking Benchmarks – Where Australian Banks Stand”