As we continue our look at the results from our household surveys, we turn to first time buyers. They are still active in the market, though struggling with high home prices and tighter lending criteria. Last month the number of owner occupied first time buyers fell.
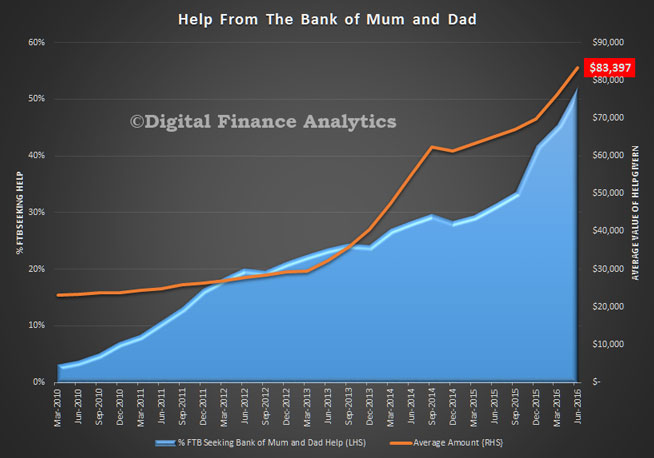
One significant factor in the mix is the extent of help to purchase from parents or other family members – the proverbial “Bank of Mum and Dad”. More than half of first time buyers are now seeking such help, and the average value has lifted to more than $83,000. The trend since 2010 is pretty stark. Those without access to family money are at a significant disadvantage.
 Looking in more detail at the type of help, direct assistance with a deposit now accounts for more than 40%, whilst around 20% of first time buyers receive some help to meet ongoing mortgage repayments. In contrast, the proportion of families offering a bank guarantee is falling, along with making general gifts. Others get help with general expenses, especially child care costs, or purchase transaction costs.
 This inter generational shift of wealth is enabled by the accumulated value gained by older households as they ride the property price boom. Some will refinance to draw capital out for their kids. Sometimes this is used to help these first time buyers to purchase an investment property.
From our surveys we also find that as many first time buyers are being driven by the expectation of future capital growth as finding a place to live. They are also aware of the tax advantages, and the relative costs of renting.
 No surprise then the biggest barriers to purchase are high home prices (more than 50%) and finding a place to buy (24%).
 More than 23% say they are not sure where they will buy, though nationally a suburban house is still the first choice.
 However, in the eastern states, high prices lead to more households going for a unit, or to purchase an investment property.
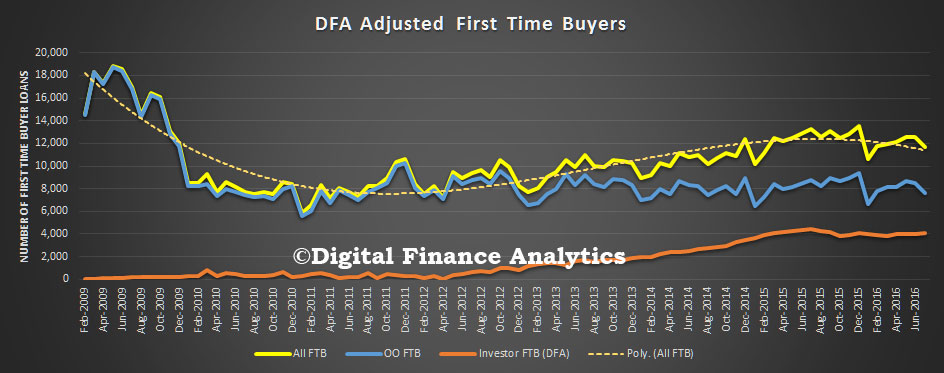
 Our first time buyer tracker shows that a significant proportion of first time buyers are going direct to the investment sector. The ABS reported the number of OO first time buyers fell last month. In original terms, the number of first home buyer commitments as a percentage of total owner occupied housing finance commitments fell to 14.1% in July 2016 from 14.3% in June 2016. The number fell from 8,486 to 7,586, down more than 10%. The average loan size was $335,600, 0.2% higher than last month.


Am I reading the first chart correctly?
It seems to be suggesting that the amount of money being advanced by ‘mum & dad’ to FTBs is at least 43 times higher now than it was 6 years ago. That’s a staggering increase, perhaps too staggering to be credible?
In 2010 4% of FTB got help, now its 50%. The average was $30k in 2010, $83k now. Not sure where you get 43x. I expected a rise (we identified it a couple of years ago). Reflect on home price growth versus income growth, the appetite of FTB to get into the market at any cost, and the capital gain than many Mum and Dads are sitting on. Put it all together, and it seems quite likely.
Thanks for the reply.
As far as where I got my 43x, the start of your orange line reads across to around $24k to $25k (certainly noticably below the $30k you suggest) and the peak of the blue area appears to cross the 50% line by enough of a margin to suggest around 52%.
(52 x 83)/(4 x 25) = 43 (ish)
If your figures are correct and your chart is just poorly drawn, we’re looking at growth of 35x – still an incredible figure.