In the final post relating to our latest household surveys this month, we turning to our household financial confidence index.
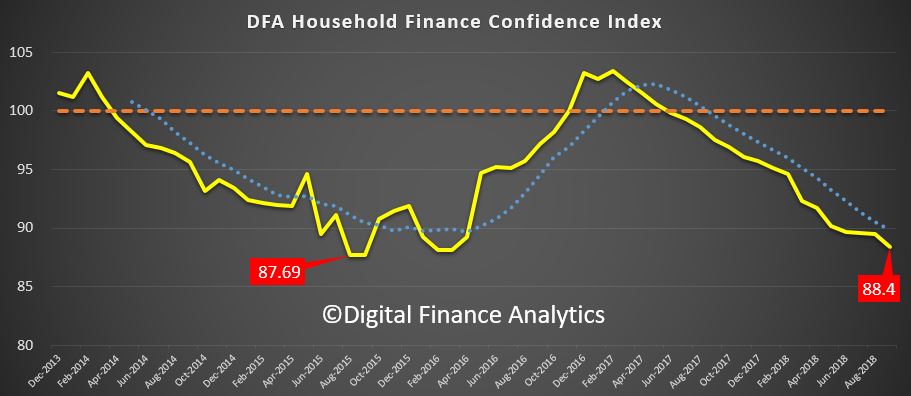
The latest read, to end September shows a further fall, and continues the trend which started to bite in 2017. The current score is 88.4, just a bit above the all-time low point of 87.69 which was back in 2015. Last month – August – it stood at 89.5.
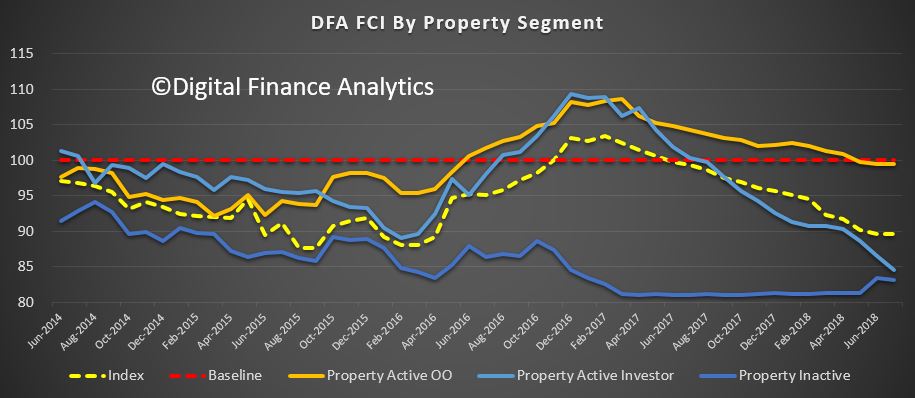
 Looking across our property segments, both property investors and owner occupiers were lower, reacting to the falls in home prices, and the difficulty of refinancing many are experiencing. Mortgage rate increases are also putting more pressure on many budgets. Despite this, those renting remain less confident, though investors have really turned sour now.
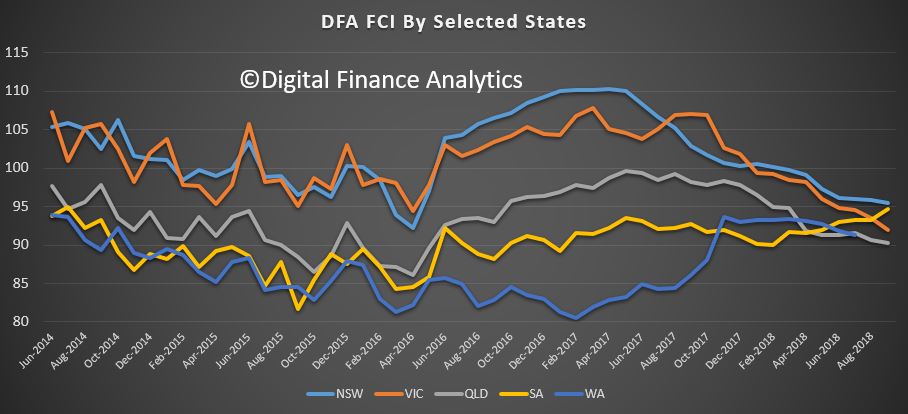
 Across the states, we see a bunching of results, though Victoria appears to be heading south, while South Australian households are a little more positive than last month.
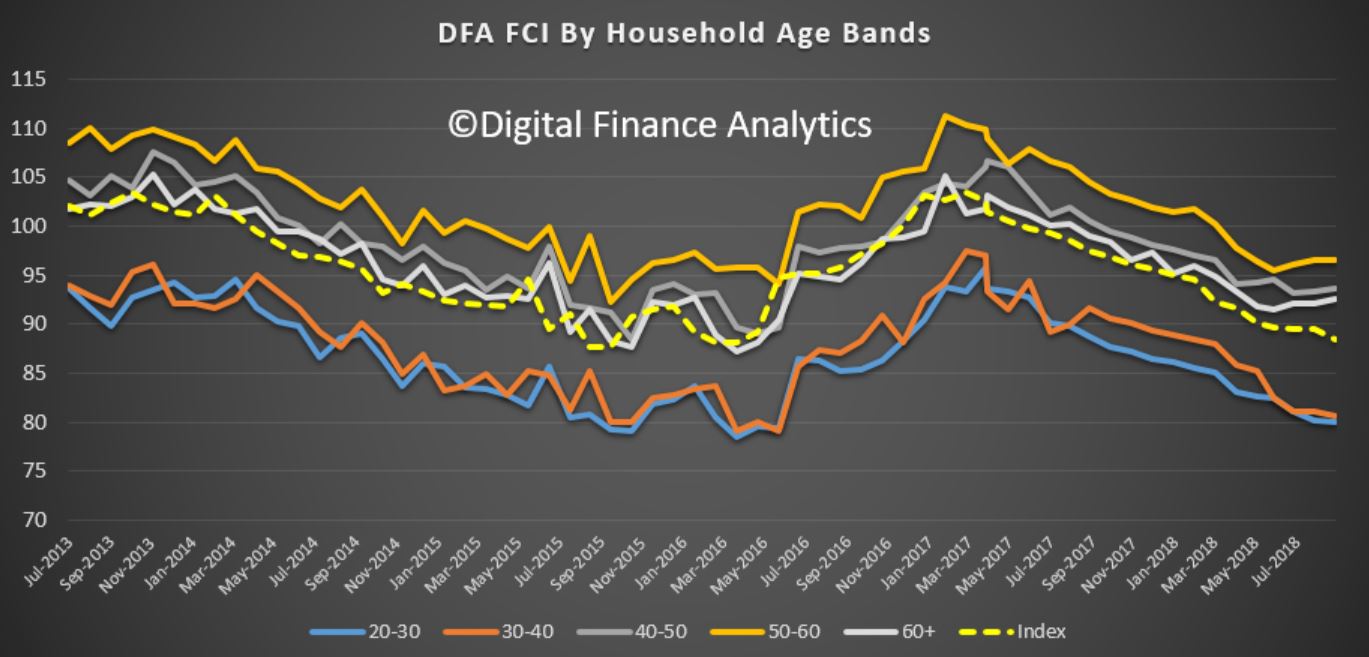
 The falling levels of confidence are evident across many of the age bands, older households are still relatively more positively, largely thanks to historic capital growth in their property, and strong stock market performance in recent times. Younger households are more concerned and many are now seeing their property values fall, at least on paper.
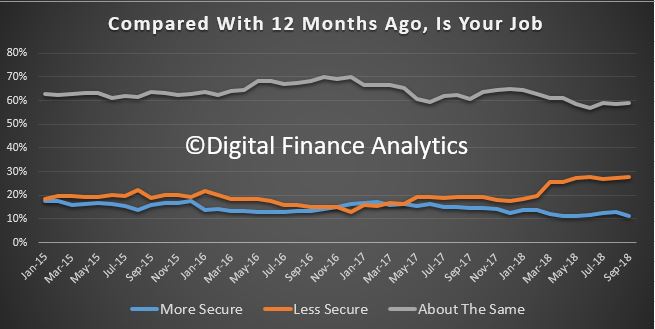
 Looking at the moving parts which drive our index, those who felt more confident about their job security than 12 months ago fell 1.8% to 11%. 59% saw no change.
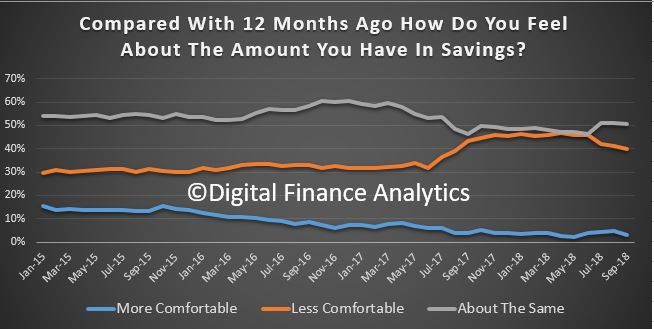
 There was a fall in those confident with regards to their savings, with a fall of 1.7% in those feeling more comfortable than a year ago, and 50% feeling about the same. The falling savings rates that many have experienced is part of the story, but so is the fact that more are raiding savings to make ends meet. This of course is not a sustainable position.
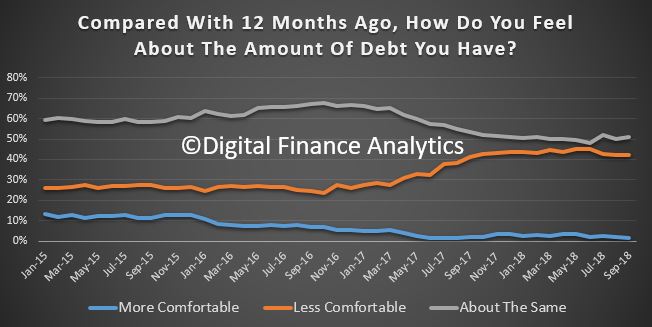
 There was a fall of 1.3% in those who are comfortable with the amount of debt they hold, and 42% are less comfortable than a year ago, reflecting recent mortgage rate increases, and problems with getting an appropriate refinance deal.
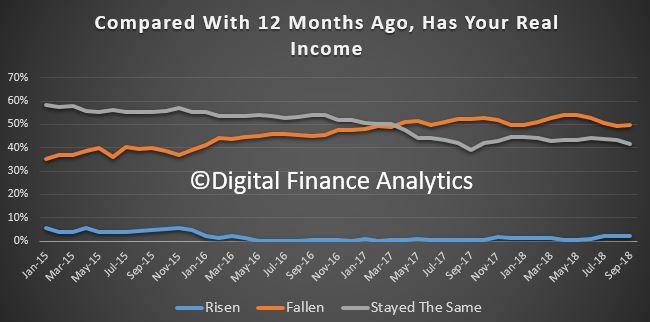
 Overall income remains an issue for many, with 42% saying there had been no increase in the past year, and 50% saying there had been a decrease in real income. Many households are relying on multiple jobs to pay the bills, and some of these are zero hours and uncertain in terms of income. We still see high levels of under employment, suggesting that many households want more work than they can get.
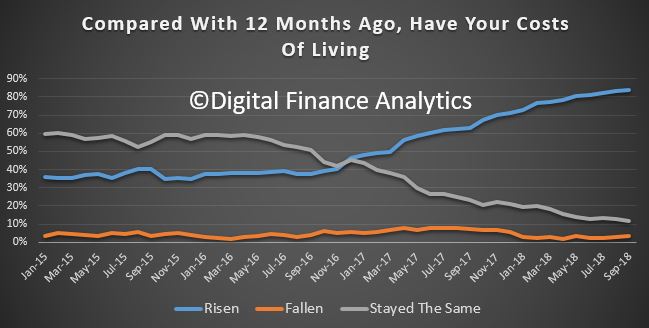
 The costs of living remain a significant issue with 84% saying their costs have risen in the past year. It is the normal story, higher electricity and fuel bills, rising medical costs and child care as well as school fees. The standard reported CPI measure does not appear to align with many households current experience.
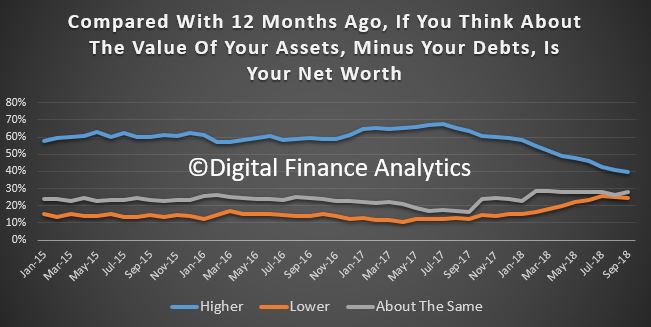
 Putting all this together, 39% say their net worth is higher now than a year ago, mainly thanks to the strong stock market, 28% say they see no change and 25% say their net worth has dropped. The most significant factor here is the fall in property values over the past 12 months.
 We expect to see the index continuing to track lower ahead, because the elements which drive the outcomes are unlikely to change. Home prices will continue to move lower, the stock markets are off their highs, wages are hardly growing and costs of living are rising. Household financial confidence is set to remain in the doldrums.
Finally, despite the attractor mortgage rates on offer from the banks continues, (in an attempt to keep mortgage volumes up), our research shows that many households cannot access them in the new tighter lending environment. 40% of applications are being rejected.
By way of background, these results are derived from our household surveys, averaged across Australia. We have 52,000 households in our sample at any one time. We include detailed questions covering various aspects of a household’s financial footprint. The index measures how households are feeling about their financial health. To calculate the index we ask questions which cover a number of different dimensions. We start by asking households how confident they are feeling about their job security, whether their real income has risen or fallen in the past year, their view on their costs of living over the same period, whether they have increased their loans and other outstanding debts including credit cards and whether they are saving more than last year. Finally we ask about their overall change in net worth over the past 12 months – by net worth we mean net assets less outstanding debts.
We will update the index next month.

