In this post we combine the latest data from the RBA and ABS, and our own analysis to look at the relationship, at a state level, between income growth, home price growth and credit growth. These three elements should logically be closely meshed, yet in the current environment, they are not. We think this is an important leading indicator of trouble ahead as these three factors will come back eventually to a more normal relationship, signalling potential falls in home values and credit volumes in a low income growth environment.
The latest data from the ABS shows that home prices fell slightly in the past quarter. The Residential Property Price Index (RPPI) fell 0.2 per cent in the March quarter 2016, the first fall since the September quarter 2012. Attached dwellings, such as apartments, largely drove price falls in the RPPI. The attached dwellings price index fell 0.8 per cent in the March quarter 2016. Falls were recorded in Melbourne (-1.3 per cent), Sydney (-0.6 per cent), Perth (-1.1 per cent), Canberra (-1.1 per cent) and Adelaide (-0.4 per cent). Brisbane (+0.7 per cent), Hobart (+2.3 per cent) and Darwin (+0.1 per cent) recorded rises. Established house prices for the eight capital cities was flat (0.0 per cent). The total value of Australia’s 9.7 million residential dwellings increased $15.4 billion to $5.9 trillion. The mean price of dwellings in Australia is now $613,900.
The RBA minutes also out today had a couple of interesting comments.
Dwelling investment had continued to grow strongly over the year, consistent with the substantial amount of work in the pipeline noted in previous meetings. Members observed that private residential building approvals had increased strongly in April, to be close to peaks seen earlier in 2015. Although these data are quite volatile from month to month, the trend for building approvals had been stronger than expected of late and the pipeline of residential work yet to be done had remained at high levels. This implied that growth in new dwelling investment would continue to add to the supply of housing over the next year or so, particularly in the eastern capitals.
In established housing markets, prices increased significantly in Sydney and Melbourne over April and May and, to a lesser extent, in a number of other capital cities. Auction clearance rates and the number of auctions increased in May, but remained lower than a year earlier. At the same time, the monthly data available for April showed that there had been a further easing in housing credit growth and the total value of housing loan approvals, excluding refinancing, had fallen in the month. Members noted that the divergence in the trends in housing price and credit growth was not expected to persist over a long period of time.
We already know that income growth is static.
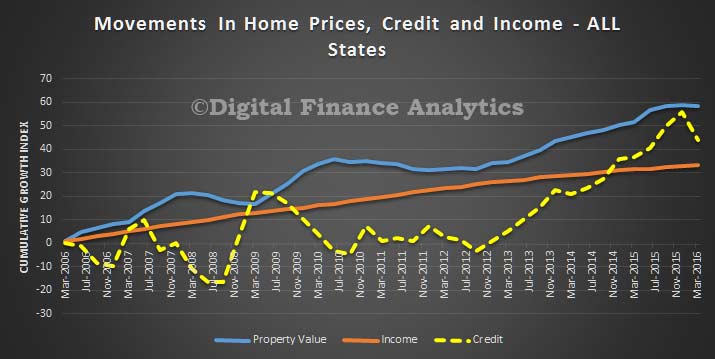
So this got us thinking about the relationship between income, home price growth and credit growth. To look at this, we drew data from our surveys, and also the ABS and RBA data-sets, to map the relative cumulative growth of average household income, home price growth and credit growth. The results are interesting. We used 2006 as a baseline and measured the relative cumulative growth since then, by state.
First, here is the average across Australia. The growth of credit since 2006 (the yellow line) is significantly stronger than home prices and income. Income is notably the slowest. This is course confirms what we know, households are more leveraged (highest in the western world), and home prices are higher relative to income, supported by credit availability and more recently low interest rates. Note also the recent slowing in credit growth.
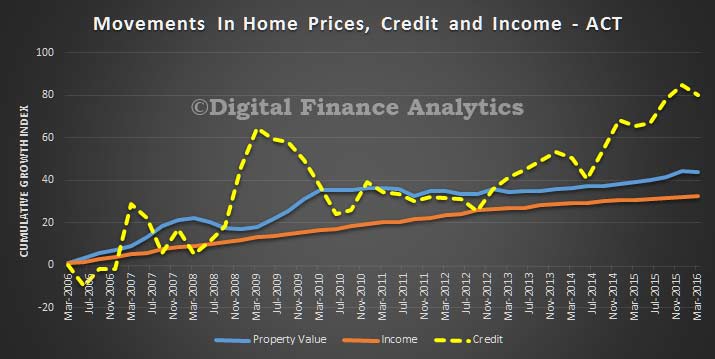
 Looking at the state variations is really insightful. In the ACT credit growth is very strong, but home prices and incomes are moving at a similar trajectory. This is partly because of the micro-economic climate supported by well paid public servants.
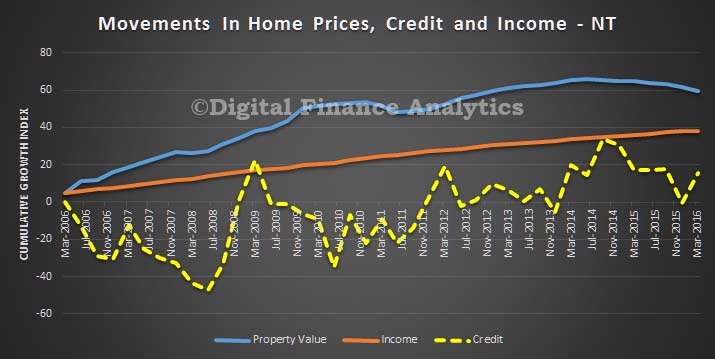
 In NT, home price growth is higher than credit and income growth, but the growth is beginning to slow, in response to the mining slow down. Home prices are significantly extended relative to incomes.
 In TAS, home prices are tracking incomes, whilst credit has been growing more slowly, thanks to lower price growth and local demographics.
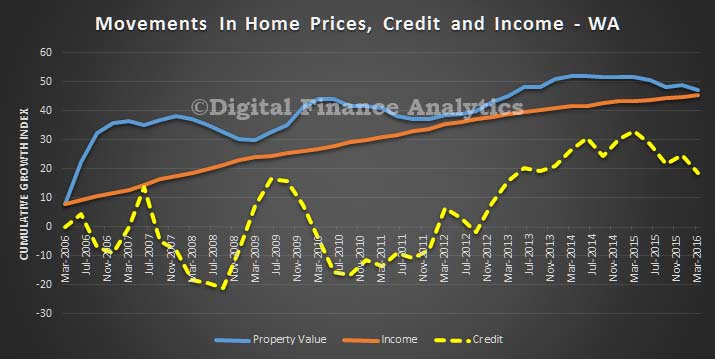
 In WA, we see significant home price momentum through the mining boom years, but it is now adjusting, and credit which has been strong has been easing in the past 12 months. Home price growth is now tracking income growth.
 In SA, credit is quite strong now, and we are seeing home prices moving ahead of incomes, as they did in 2010, but only slightly.
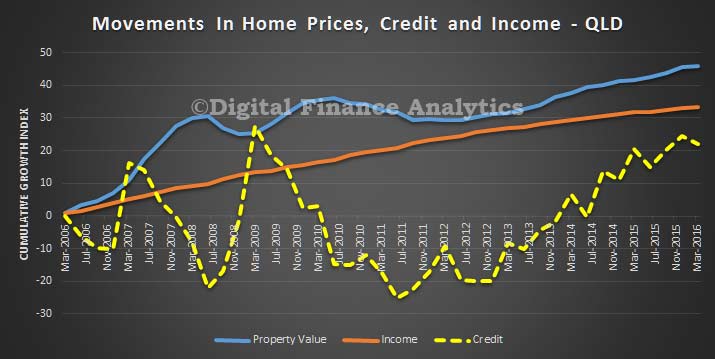
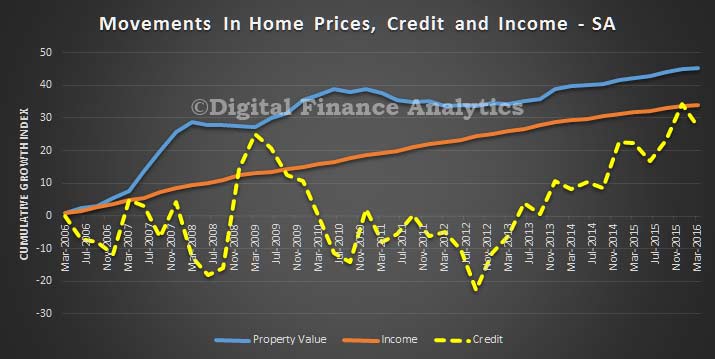 In QLD, credit is growing faster now, and home prices are moving faster than incomes, there is an interesting dip in 2011-12, thanks to some “local political difficulties!”
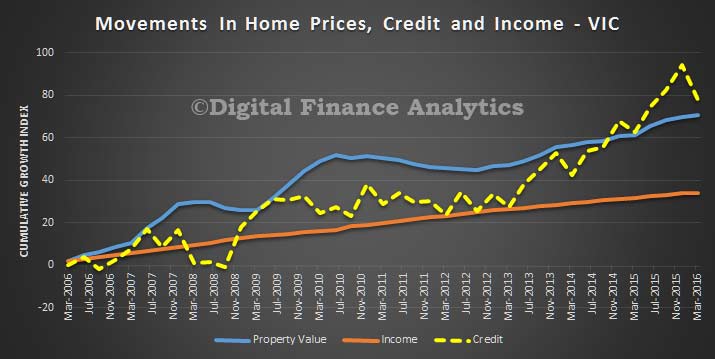
 VIC holds the award for the strongest credit growth in recent time, and as a result we see home prices moving ahead of income growth, a trend which can be traced back to before the GFC.
 Finally, in NSW, we see a dramatic run up in credit and home prices, especially since 2013. Both are growing faster than incomes. Prior to this, income growth and home prices were more aligned.
 So a few observations. Incomes and home prices, and credit are disconnected, significantly. This is a problem because credit has to be repaid from income, in some way, at some time. Next, there are strong correlations in some states between credit growth and home prices, in other states it is less clear. NSW and VIC have the largest gaps between income and prices. So it reconfirms the property markets are not uniform. Finally, and importantly, we think that home price and credit growth will have to come back to income growth – and as incomes will be static for some time, downward pressure on home prices and credit will build, especially if the costs of borrowing were to rise.
