We can spot the best and worst investment property returns across the nation, using updated data from our household surveys. The average GROSS rental return in Australia is 3.9%, the NET rental return (after interest costs, management and repair costs etc, but before tax) is 0.4%. The average net equity held in a investment property is $161,798. This is the marked to market value of the property, minus the loans outstanding.
The data takes account of lower interest rates, and changes in rents as well as the latest property values. Things get interesting when we start to look at the segmented data. Not all investment properties are equal. Here is the average by each state.
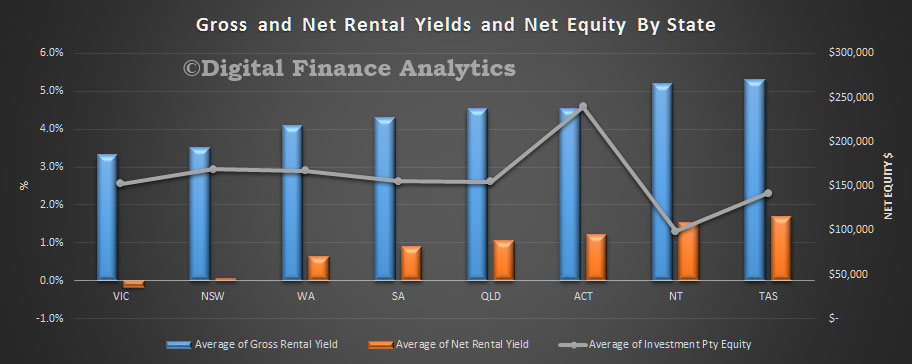 The left hand scale shows both gross rental yield (blue) and net rental yield (orange), while the line shows the average net equity in the property. We have sorted from lowest net rental return.
In VIC whilst the average gross return is still at 3.3%, the average net return is a 0.2% LOSS, while the average equity is $152,412. Compare this with QLD, with a gross return of 4.5% and a net return of 1.1%, with equity of $154,665. The best net return is to be found in TAS, where gross yield is 5.3%, net yield 1.7% and average equity $141,595.
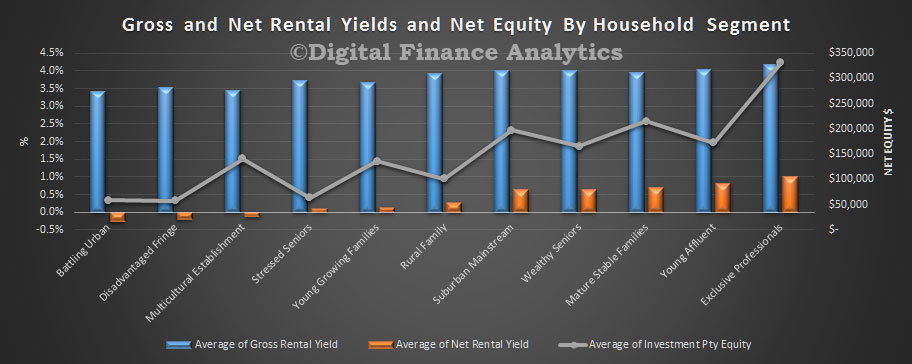
Another way to look at the data is by our household segments. Here we find more affluent households are getting significantly better net returns (before tax) compared with those with lower incomes, including battlers, those living on the city fringes, and multicultural families.
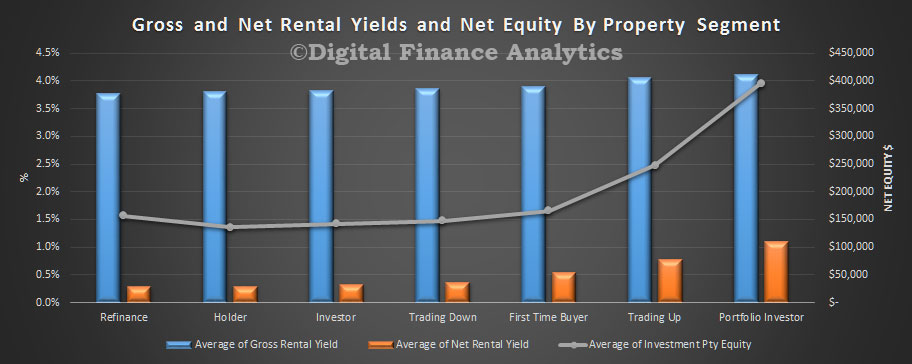
 Cutting the data by our property segmentation, we find that portfolio investors are doing the best, with net returns well above 1%.
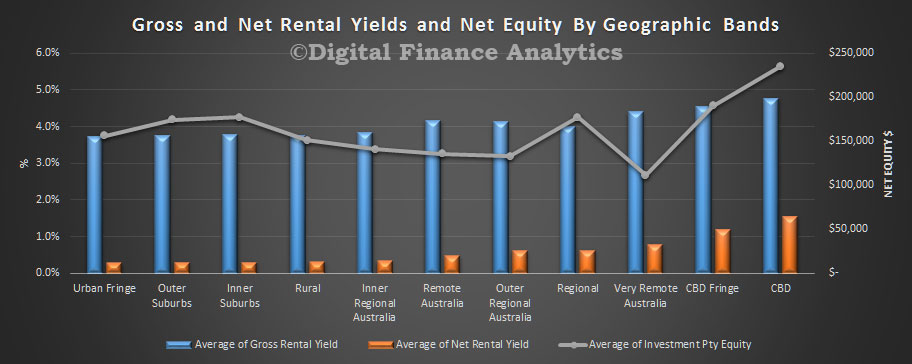
 Looking at our geographic bands, we find those on the urban fringe, or suburbs doing the least well. The best returns at a net yield level can be found in the CBD or CBD fringe.
 Finally, we can drill down to individual postcodes and suburbs. To illustrate this, here is a chart of the 20 worst performers in VIC. Households in Glenlyon (3461), a suburb of Bendigo about 86 kms from Melbourne are at the bottom.
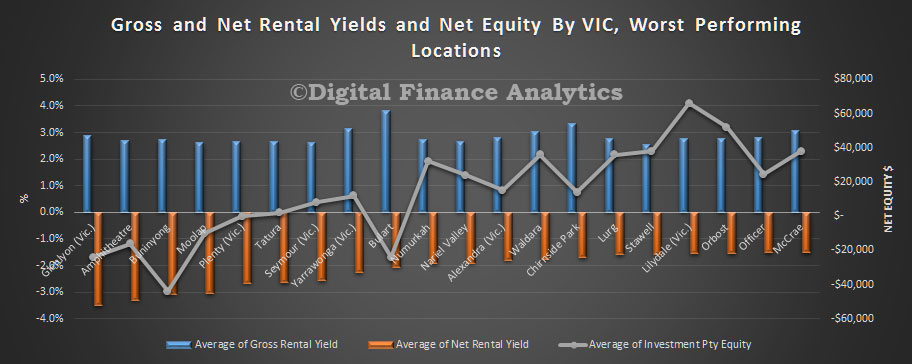 The average net yield is a LOSS of 3.5%, and a net equity of just $24,000.
Remember that we are looking at the data before tax. Many investors will be willing to wear low net returns on property, to offset other income because of anticipated future capital gains. Negative investment gearing has a big impact on household investment behaviour.

2 thoughts on “Latest Gross and Net Rental Yields Vary; Wildly”