Having looked at changes in investment loan supply, and the motivations of the rising number portfolio property investors, today we use updated data from our rolling household surveys to look at how property investors are positioned should mortgage rates rise. In fact, for many, rates have already been raised, thanks to lender repricing independent of any RBA cash rate move, some as much as 65 basis points. We think there is more to come, as loan supply gets tighter, international financial markets tighten and competitive dynamics allows for hikes to cover capital costs and to bolster margins.
To assess the sensitivity we model households ability to service mortgage debt, taking into account their other outgoings, and rental income. We are not here looking at default risk, but net cash flow. How high would rates rise before they were under pressure? Where they also have owner occupied loans, or other debts, we take this into account in our assessment.
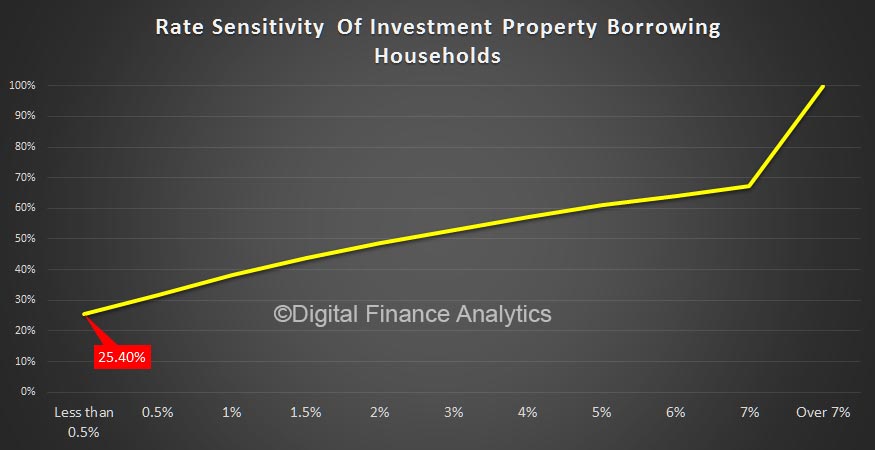 The first chart is a summary of all borrowing investor households. The horizontal scale is the amount by rates may rise, and for each scenario we make an assessment of the proportion of households impacted, on a cumulative basis. So as rates rise, more households would feel pain.
The summary shows that nationally around a quarter of households would struggle with a rate hike of up to 0.5%, and as rate rose higher, this rises to 50% with a 3% rate rise, though 40% could cope with even a rise of 7%.
So a varied picture. But it gets really interesting if you segment the analysis. Those who follow DFA will know we are a great believer in segmentation to gain insight!
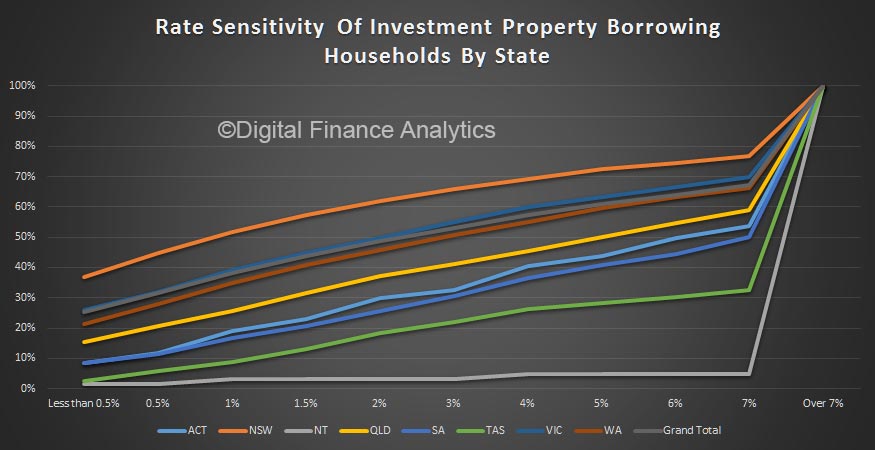
A state by state analysis shows that households in NSW are most exposed to a small rate rise, with 36% estimated to be under pressure from a 0.5% rise (explained by large mortgages and static rental yields), compared with 2% in TAS.
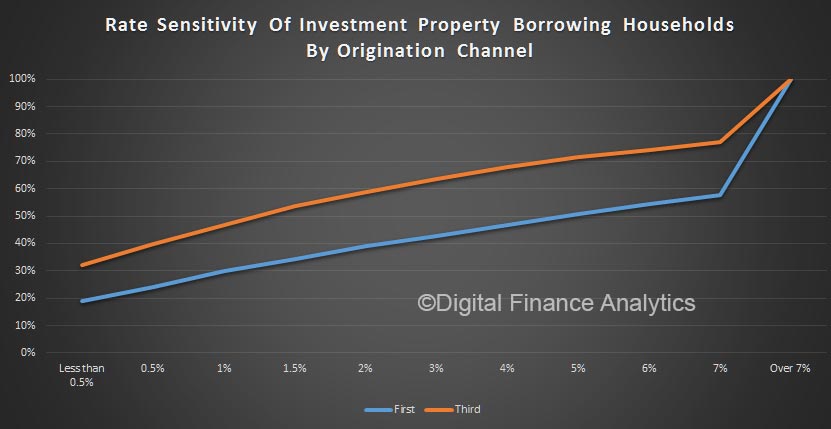
 Origination channel makes a difference, with those who used a mortgage broker or advisor (third party) more exposed compared with those who when direct to a lender. The pattern is consistent across the rate rise bands. This could be explained by brokers knowing where to go to get the bigger loans, or the type of households going to brokers.
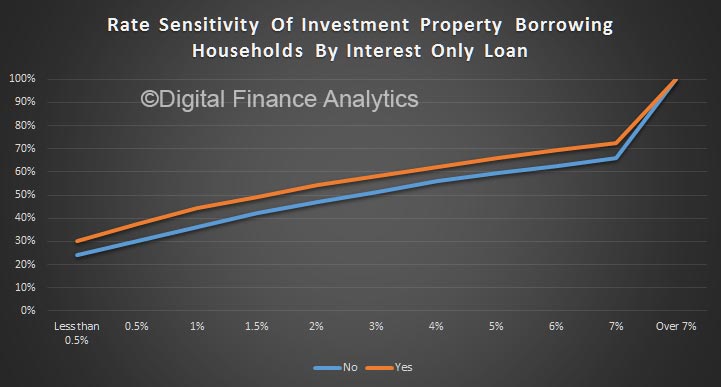
 Households with interest only loans are 6% more exposed to a small rise, and this gap remains across our scenarios. No surprise, as interest only loans are more sensitive to rate movements. We have not here considered the tighter lending criteria now in play for interest only lending.
 Our master segmentation reveals that it is Young Affluent and Young Growing Families who are most exposed, followed by Exclusive Professionals. Some of the more affluent are portfolio investors, so are more leveraged, despite larger incomes.
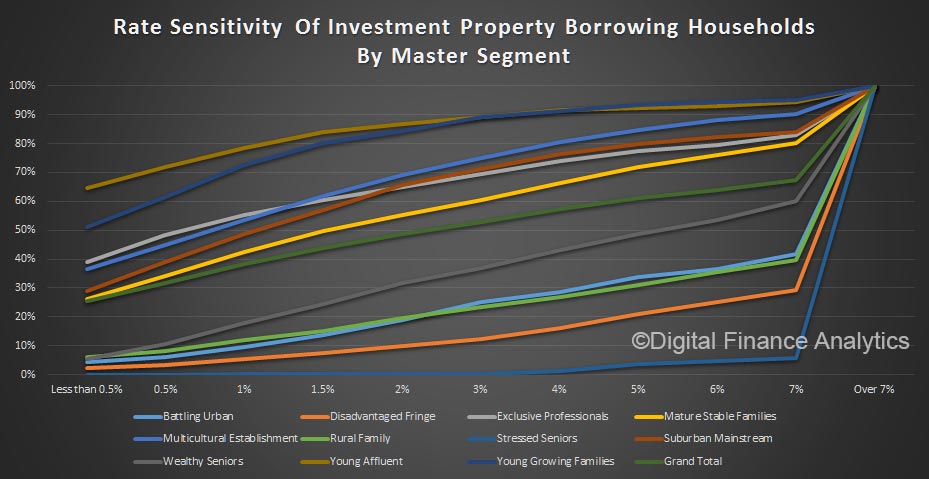 Finally, we can present the age band data, which shows that those aged 40-49 have the greatest exposure as rates rise, though young households are most sensitive to a small rise. Note this does not reveal the relative number of investor across the age groups, just their relative sensitivity.
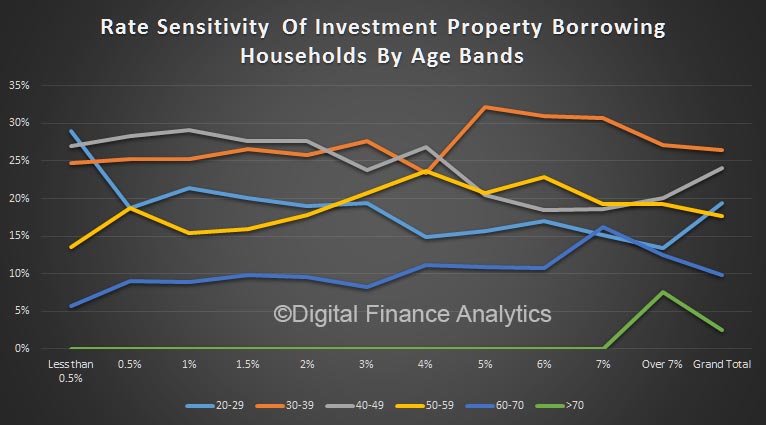 This all suggests that lenders need to get granular to understand the risks in the portfolio. Households need to have a strategy to prepare for rate rises and should not be fixated on the capital appreciation, at the expense of cash flow management, especially in a rising rate environment.

Very interesting, thanks. How are you defining ‘under pressure’ though? Does that mean using all of that household’s available disposable income or some other definition?
Hi, we look at disposable income and expenditure flows, and the point at which outgoings are more than income. A cash-flow basis (does not take account of tax breaks or refunds, or asset values).