Fitch Affirms Australia at ‘AAA’; Outlook Stable

Fitch says Australia’s ‘AAA’ rating is underpinned by an effective and flexible policy framework that has, in combination with strong net migration, supported 28 consecutive years of positive GDP growth in the face of substantial external, financial, and commodity-price shocks. A credible commitment to fiscal consolidation from a debt level that is already broadly in line with the ‘AAA’ median also supports the rating.

The federal government’s fiscal position continued to strengthen over the past year, bolstered by a cyclical upswing in revenue, largely from higher iron ore prices, and sustained spending restraint as part of the government’s consolidation efforts. On a Government Finance Statistics basis, Fitch estimates a federal government surplus in the fiscal year ending-June 2019 (FY19) of 0.1% of GDP; the first surplus since FY08. We forecast the federal surplus to trend slightly upward, reaching 0.3% by FY21. Fitch forecasts the general government deficit to decline to 0.5% of GDP by FY21, from 1.0% in FY19.

The government appears committed to continued fiscal consolidation, focusing on reaching an underlying cash surplus in FY20 (from a balance in FY19) and over the medium-term. Strong revenue growth allowed the government to pass additional personal income tax cuts in July, while remaining on track to achieve its fiscal targets. However, the fiscal trajectory remains sensitive to commodity-price developments. Iron ore prices have receded sharply from their mid-2019 highs, but remain above the assumptions incorporated into Fitch’s April 2019 budget outlook.

We estimate that general government gross debt remained stable at 41.0% of GDP in FY19, just below the ‘AAA’ median of 44%, and expect the debt ratio to fall gradually on improved fiscal performance.

Fitch forecasts GDP growth to slow sharply to 1.7% in 2019, from 2.7% in 2018, due to domestic factors triggered by a protracted housing-market downturn. We expect economic growth to rise to 2.3% in 2020, as the housing market stabilises and consumption is supported by recent monetary policy-rate cuts, tax cuts, and public-infrastructure spending. Risks are tilted to the downside given US-China trade frictions and slowing growth in China, as China is the destination of roughly 30% of goods exports.

The Reserve Bank of Australia (RBA) has cut its policy rate by a cumulative 75bp since June to a historic low of 0.75%, a considerable change in the interest-rate environment. Fitch now expects the RBA to remain on hold through 2021 to support economic growth and employment, and does not anticipate the use of quantitative easing. Inflation fell in 1H19 to 1.4% and Fitch forecasts it to remain below the RBA’s 2%-3% target band until 2021. The unemployment rate has edged up to 5.2% since April, but employment growth remains resilient and the participation rate has increased to historic highs.

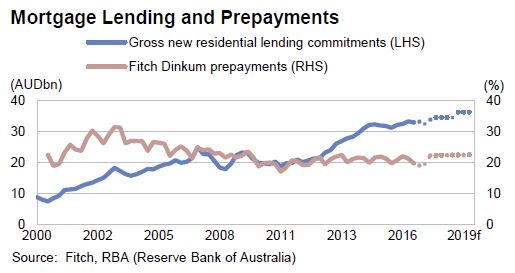
Policy rate cuts and a relaxation of macroprudential policies have helped stabilise house prices after an 8.4% fall in the national house price index between the October 2017 peak and June 2019. Fitch expects an acceleration in house price growth in 2020, although housing turnover is still subdued and mortgage credit growth remains low, in part due to the tightening of underwriting standards. However, housing-loan approvals have increased in recent months and sustained low interest rates, along with continued strong net migration, will put upward pressure on house prices and household debt over the medium-term.

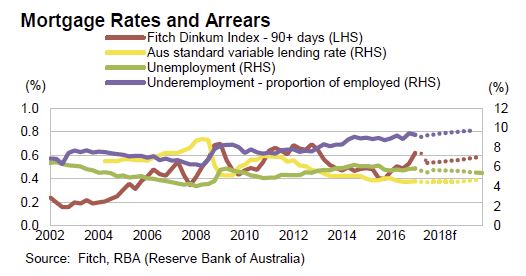
Household debt, at 191.1% of disposable income in 2Q19, is among the highest of ‘AAA’ rated sovereigns and poses an economic and financial stability risk in the event of a shock. Under current conditions, households appear well positioned to service their debts, with non-performing loans at just under 1% of total loans. However, a labour market or interest rate shock could impair households’ ability to service their debts. Mitigating these risks is that some households have prepaid their mortgages or maintain mortgage offset accounts that can be used to service debt in the event of a shock, though newer borrowers and financially weaker households could be vulnerable.

Australia’s banking system, which scores ‘aa’ on Fitch’s Banking System Indicator, is well positioned to manage potential shocks. Sound prudential regulation and ongoing strengthening of underwriting standards have improved the resilience of bank balance sheets and limited their exposure to riskier mortgage products.

Improved terms of trade caused by high commodity prices led to Australia’s first current-account surplus since 1975 in 2Q19. We forecast the surplus to be short-lived, as iron ore prices have declined from their mid-year highs, and expect the current account for the full year to be roughly in balance, against a deficit of 2.1% of GDP last year. Fitch forecasts the current-account deficit to widen to 1.5% of GDP by 2021, below its 4.1% average since 1990.

Net external debt remains among the highest within the ‘AAA’ category and we project it to reach 56.4% of GDP in 2019. Heavy reliance on external funding leaves Australia exposed to shifts in capital flows. Most external liabilities are denominated in local currency or are hedged to reduce currency and maturity mismatches. This helps to mitigate risks.

Volcker 2.0 Eases Bank Compliance

The approval by the Office of the Comptroller of the Currency (OCC) and the Federal Deposit Insurance Corporation (FDIC) of the newly updated Volcker rule will ease compliance with the requirements that prevent banks from engaging in proprietary trading, and, in doing so, would enhance their role as market makers and aid market liquidity, according to Fitch Ratings.

The revamped Volcker rule — or Volcker 2.0 — reduces the onus on banks to prove that their trading activities are not proprietary in nature. In addition, and consistent with the aim to tailor regulatory rules, banks with between $1.0 billion and $20.0 billion in trading assets would be subject to a simplified compliance program, while community banks, defined as banks under $10.0 billion in assets with minimal trading assets and liabilities (under 5% of total assets) were already exempted from the Volker rule as part of the Economic Growth, Regulatory Relief, and Consumer Protection Act.

While most recent regulatory easing initiatives have been aimed at the smaller banks, Fitch views this change as more impactful for the larger banks. Relaxing the Volcker rule does not help smaller banks as they generally do not engage in the type of trading activities the regulations restrict.

The final rule changed in one important aspect from the original proposal. Under the initial proposal, the rule would have encompassed all of a bank’s fair-valued trading assets and liabilities — the so-called “accounting prong”. However, the final rule did not retain this test, which would have been more restrictive for banks and would have scoped-into over $400 billion of available-for-sale assets. Instead, the rule continues to define a trading account based on a modified version of the existing rule — as to whether there is a short-term trading intent — which is more subjective than the accounting-based test. The new rule also eliminates the presumption that trading positions held for 60 days or less constitutes prop trading, thereby freeing up some of the compliance burden associated with short-tenor trades.

Volcker 2.0 also provides more leeway for banks to effectively self-police their compliance with the rule as they will not be required to automatically notify supervisors when internal risk limits are exceeded. Previously, the rule required banks to promptly report limit breaches or increases to the regulators.

“Under the prior rule, banks were presumed guilty unless proven innocent. With Volcker 2.0, banks are more generally presumed to be innocent unless proven guilty” said Christopher Wolfe, Managing Director at Fitch Ratings.

The new rule also modifies the liquidity management exclusion from the proprietary trading restrictions, permitting banks to use a broader range of financial instruments to manage liquidity. It adds new exclusions for error trades, offsetting swap transactions, certain customer-driven swaps, hedges of mortgage servicing rights, and purchases or sales of instruments that do not meet the definition of trading assets/liabilities. It also eliminates the extra-territoriality reach of the rule for foreign banking entities covered fund activities, where the risk occurs and remains outside of the U.S.

The relaxation of the compliance burden potentially opens up some avenues for banks to engage in what can be viewed as proprietary trading, under the guise of legitimate market making or liquidity management. The original rule barred the execution of bank algorithmic trading strategies that only trade when market factors are favorable to the strategy’s objectives, or otherwise not qualify for the market-making exception. In Fitch’s view, the new rule could allow banks to re-engage in some algorithmic trading that previously did not comply and to some degree, more effectively compete in market-making activities against high frequency trading firms (HFTs).

Fitch views the general prohibition against proprietary trading as a positive from a ratings perspective. Thus, while there are no immediate rating impacts from these changes to the Volcker rule, we would negatively view any bank that increases directional trading activities that can be construed as proprietary trading or fails to self-police their trading activities appropriately. Moreover, given still heightened capital and liquidity standards, potentially including the finalised Basel Market Risk (FRTB) standard and compressed margins in trading businesses, any increase in perceived proprietary trading may not generate adequate returns on capital nor be reflected in better stock valuation.

“The regulators have opened the door for the larger U.S. banks to engage in selective risk taking, potentially with an eye toward enhancing market liquidity and levelling the playing field against HFTs” said Monsur Hussain, Senior Director at Fitch Ratings.

Fitch Ratings downgrades Westpac, ANZ outlook

Credit rating agency Fitch Ratings has changed its outlook on Westpac and ANZ from “stable” to “negative”, following APRA’s update of its capital requirements for the major banks. Via InvestorDaily.

While the additional operational capital requirements should remain manageable for the banks, Fitch said the main driver for the changes were driven by a concern for governance and culture in the institutions. 

Westpac recently released its self-assessment on governance, accountability and culture, admitting significant shortcomings. 

The big four evaluated themselves last year when APRA chair Wayne Byres wrote to the country’s banks, insurers and super licensees after the CBA prudential inquiry. He asked them to determine whether weaknesses uncovered at CBA existed in their companies. 

The result of the self-assessments led APRA last week to increase the minimum capital requirements by $500 million and prompted Westpac to release publicly its self-assessment. 

ANZ is the only bank of the big four which has yet to publish its self-assessment.

“The additional capital requirements should remain manageable and not impair the bank’s ability to meet APRA’s ‘unquestionably strong’ targets starting in 2020, but it indicates material shortcomings in operational risk management, which were not aligned to what Fitch had previously incorporated into its ratings,” Fitch said in its update on Westpac. 

“This has resulted in a downward revision to our score for management and strategy and weaker outlook on earnings and profitability.” 

The rating agency made a similar note on ANZ, saying APRA’s findings indicated deficiencies within both companies’ management of operational and compliance risks, culture and governance.

However, Westpac said Fitch’s affirmation of its rating at AA- meant despite the challenges the bank faces, the credit agency expects it to “maintain its strong company profile in the short term, which in turn supports its strong financial profile.”

Likewise, ANZ was reaffirmed at AA- for both its banking group and New Zealand company. Fitch stated the group “continues to have robust risk and reporting controls around other risks, including credit, market and liquidity risk, as reflected by its conservative underwriting standards and very high degree of asset quality stability.”

Separately, on 9 July S&P Global Ratings affirmed the AA- long-term and A-1+ short-term issuer credit ratings and revised its outlook on the major Australian banks to “stable” from “negative.”

Westpac commented: “This outlook change reflects S&P’s view that the Australian government remains highly supportive of Australia’s systemically important banks based on APRA’s release on loss absorbing capacity.”

Loan Growth is Uncertain for U.S. Banks

Many U.S. banks reported relative strength in consumer lending in fourth quarter earnings, while corporate lending growth was below expectations, according to Fitch Ratings‘ latest “U.S. Banking Quarterly Comment: 4Q17.”

The industry reported around 3% loan growth for the full-year, well below historical averages. With the passage of the Tax Cuts and Jobs Act (TCJA), it’s unclear if there will be an uptick in lending with fewer incentives for U.S. corporates to borrow.

“Loan growth is expected to remain muted next year as many banks publicly disclosed they are targeting between low- and mid-single digit loan growth for the year,” said Julie Solar, Senior Director, Fitch Ratings.

Tax reform had a significant impact on fourth quarter earnings, but outside of one-time tax charges and gains, most banks reported improving spread income from interest rate increases, still benign credit costs, strong investment banking results and well-controlled core expenses. During earnings calls, many banks disclosed new earnings targets with improved returns. The large regional banks continue to report relatively stronger earnings than the universal banks, though not all banks included in the comment publicly disclosed new targets.

“The TCJA created a lot of noise in the quarter, but going forward most banks will likely report a boost to earnings,” added Solar.

Costs of credit continue to fall well below long-term average with net charge-offs at historically low levels across many asset classes, averaging 44bps during the quarter. This is well below the industry historical average since 1984 of nearly 80bps (which excludes financial crisis era losses between 2008-2010).

The five U.S. Global Trading and Universal Banks (GTUBs) reported strong investment banking and weak trading results during the fourth quarter of 2017 (4Q17), a trend that is unlikely to reverse anytime soon, according to Fitch Ratings’ “U.S. Capital Markets Quarterly: 4Q17“. Growth in debt underwriting from a strong leveraged finance market, an increase in equity underwriting, and growth in advisory drove investment banking (IB) results higher. However, total capital markets revenues in 4Q17 were $22.12 billion; a decline of 10.97% year over year due to weakness in fixed income, currencies and commodities (FICC) net revenue as client engagement levels fell across multiple products.

“Low volatility is problematic for trading, but it does allow corporates to plan for M&A activity which boosts investment banking results,” said Justin Fuller, Senior Director, Fitch Ratings. “Though, the correlation between guidance during earnings calls and future revenue is weak as economic and political variables can often delay deal execution.”

Overall 4Q17 IB revenues were the best fourth- quarter performance in the past five years, with total IB revenues of $8.1 billion, up 19.2% year over year. Overall 4Q17 FICC revenues for all of the U.S. GTUBS declined 30.7% from the prior year to $8.2 billion as continued low volatility drove low levels of client activity.

JPMorgan Chase & Co. (JPM) retained its leading market share position with 23.2% of overall capital markets revenues in 4Q17; however, its overall share declined by 150 basis points year over year, while Bank of America (BAC) achieved year over year share gains of 190 basis points. As a result, the shares of Morgan Stanley (MS), BAC and Citigroup (C) converged at just less than 19% of total capital market fees in 4Q17.

In 4Q17, capital markets revenue as a percentage of total revenue decreased for each firm on a year over year basis. The average contribution to overall revenues of the five U.S. GTUBs was 22.1% in 4Q17, down from 24.9% in the prior year quarter. However, the contribution from capital markets revenue in 4Q17 is only slightly below the five-year average of fourth-quarter capital markets revenue of 22.5%. The five U.S. GTUBs all had significantly higher net interest income this quarter due to higher year over year short-term interest rates as well as incrementally higher wealth/asset management revenues amid higher global equity markets. Fitch believes the strength of these other sources of revenue helps to demonstrate the diversity of the business models of some of the larger banks.

Global House Prices Will Rise, but Ideal Conditions to End – Fitch

Globally, national house prices are forecast to rise this year in 19 of 22 markets highlighted by Fitch Ratings in a new report, but growth is expected to slow in most markets and risks are growing as the prospect of gradually rising mortgage rates comes into view this year. Their data on Australia makes interesting reading.

Home Prices: Growth Decelerates

Combined capital city home prices showed yoy growth of 6.6% in the year to November 2017, down from 10.9% over the year to December 2016. The increase was driven by Hobart (+12.7%), Melbourne (+11.0%) and Sydney (+7.7%). Melbourne and Sydney experienced slower growth while Hobart experienced faster growth than a year earlier. Continued record low interest rates have supported price growth while gross rental yields slipped to a record low of 3.6% as of October 2017. Tighter lending standards and foreign ownership restrictions have dampened price growth however.

Fitch expects Sydney and Melbourne HPI to stabilise in 2018, due to low interest rates, falling rental yields, increasing supply, limited investment alternatives and growing dwelling completions, partially offset by high population growth.

Affordability: First-Home Buyers Back in the Market FTBs increased to 17.4% of owner-occupied lending in September 2017 from 13.1% in September 2016, after FTB grants were introduced in New South Wales and Victoria in July 2017. The state governments of Australia’s two most populous states have introduced new FTB support, such as abolished stamp duty for properties up to AUD650,000, reduced stamp duty for properties up to AUD800,000, and grants of up to AUD20,000 for the building of new homes.

Although FTB activity has increased since the announcement of the FTB changes, affordability is still a key issue for FTB. This is particularly true in major cities, as wage growth falls behind HPI.

Fitch expects the increase in FTB to be temporary; low income growth, tighter underwriting and rising living costs will maintain pressure on affordability for FTB. As mortgage rates are currently low, any material rate rise will weigh further on mortgage affordability and serviceability.

Mortgage Performance: Low Arrears to Continue

Mortgage arrears remained broadly stable in 1H17. This is despite lenders increasing mortgage rates, particularly for investment and interest-only loans, while the RBA has made no change to the cash rate. As at 3Q17, 30+ days arrears for prime RMBS were 1.02% according to our Dinkum RMBS index, compared with 1.09% at end-2016. The level of under-employment in Australia stabilised at 9.1% of employed persons in 3Q17 (9.2% in 3Q16), and this may be affecting the disposable income and servicing capacity for some borrowers.

Fitch expects mortgage performance to remain stable in 2018, as interest rates stay low. Fitch believes the adoption of APRA-prescribed serviceability practices by lenders in 2016 has improved borrower ability to service mortgage loans originated since then. However, the rising cost of living and sluggish wage growth are likely to increase pressure on recent borrowers who have little disposable income.

Mortgage Lending: Slower Growth. New mortgage lending growth has slowed in 2017 compared to end-2016, against a background of modest economic growth and reduced investment lending. Home sale transactions decreased in the year to October 2017 by 4.7% nationally (as per CoreLogic); combined capital city sales were 6.0% lower and combined regional market sales were down 2.2%. Lower investor demand, increasing transaction costs, higher capital requirements for banks, further prudential measures restricting lending to investors and stricter serviceability parameters, have restricted access to mortgages for some borrowers.

Fitch expects mortgage lending growth to slow to around 4% in 2018, based on continued record low interest rates and stable unemployment. This will once again be offset by continued underemployment, reduced investor demand and tougher lending practices.

Regulatory Environment: New Measures Introduced

In March 2017, the Australian Prudential Regulation Authority (APRA) announced additional supervisory measures to moderate investment lending in Australia. The APRA expects authorised deposit-taking institutions (ADI) to limit new interest-only lending to 30% of originations; limit growth in investment lending to 10% per year; ensure that serviceability metrics are set at “appropriate levels for current conditions”; and to continue to restrain lending growth in high-risk segments such as high loan-to-income loans, high LVR loans, and long tenure loans. The recently introduced measures relating to interest only lending have already been adopted by lenders and, along with the other restrictions brought in over the past two years, are reflected in the increased pricing of interest only and investment loans.

In July 2017, ownership restrictions were applied in New South Wales and Victoria; a 50% cap on foreign, non-resident ownership in new developments; a levy on foreign, non-resident investors whose properties are vacant for at least six months in a calendar year; increasing the capital gains tax (CGT) withholding rate to 12.5% from 10.0% and increasing the threshold for CGT to AUD2 million from AUD750,000. On 17 July 2017, the Treasury released draft legislation proposing that APRA extend its remit to regulate lending activities of non-ADIs.

Fitch expects the additional regulatory supervision measures to reduce the supply of lending to investors and moderate the house price growth in Sydney and Melbourne in 2018.


They say tighter mortgage regulation, record low rental yields, and increasing supply will slow Australian price growth. FTBs in Sydney and Melbourne received government support in 2017, but the impact is expected to be temporary, considering affordability pressure. Australia and New Zealand will post small rises in arrears as home prices in big cities stabilise.

Australia and the US have had nominal home price growth rates since 2010 of 41% and 32%, respectively, that have been substantially higher than rental growth rates. This has occurred despite a high rental growth of 19% in both countries over this period. Australia’s rental growth rate has flattened since 2016, while the rental growth for the US has been accelerating since then.

Australian housing completions have again been the highest of the countries covered. This has put downward pressure on prices in several cities and regions outside of Sydney and Melbourne, although immigration has kept the ratio per 1000 citizens more stable. In Sydney and Melbourne, much of the excess supply had been taken by non-residents, which will be dampened by limitations put in place in 2017.

Australia’s household debt as a proportion of GDP is now the highest across all tracked countries. It overtook the Danish household debt ratio, which has been deleveraging gradually since the peak of the housing market in 2009, helped last year by stable debt and an increase in GDP. Fitch’s mortgage market and macro outlooks are stable for Australia in 2018, but the high ratio increases reliance on a strong economy.

Here is their global summary.

“Arrears are at very low levels in most markets. They will only move in one direction as mortgage rates rise slowly due to higher policy rates and more expensive bank funding from the gradual unwinding of quantitative easing. Floating-rate loans and borrowers refinancing to new rates will be first affected,” said Suzanne Albers, Senior Director, Structured Finance, Fitch Ratings.

Long-term fixed-rate loans are less exposed to increasing rates, but fewer re-financings mean lower lending volumes, so lenders may face pressure to relax their origination standards, subject to regulatory limits.

Norway, Greece and the UK are the only countries not expected to see price rises this year, but Fitch notes that national trends can mask large performance variations within countries with some regions continuing to see unsustainable price rises while others stagnate or even fall.

“We expect home prices to stabilise in Sydney and Melbourne and show modest declines in Oslo, Toronto and London. However, if corrections are only limited after several years of very high growth, the risk of large price declines in future downturns remains,” added Ms. Albers.

Despite these challenges, six of the 22 housing markets covered by the report have seen upward revisions to their outlooks over the past 12 months compared with three being revised down, leaving just three, the UK, Canada and Norway, in Stable/Negative territory.

Fitch has a positive or stable/positive market outlook for seven of the nine eurozone countries in this report due to expectations for strong economic growth and continued quantitative easing (QE) in 2018. As the unwinding of QE and normalisation of interest rates is only expected in the medium-term, so the highlighted challenges are likely to materialise later than in other regions.

Fitch believes that in 2018 a combination of factors will be needed to constrain house price rises that have gone beyond market fundamentals and are primarily due to buyers’ expectations for further growth. Overheated markets slowed in 2017 when a combination of factors pressured prices, including lending limitations along with more local factors such as heightened supply and falling immigration in Oslo, multi-layered regulatory controls on home purchases and mortgage lending in China and for London, Brexit uncertainty plus the impact of buy-to-let (BTL) changes including lower tax deductibility of rental income.

Non-bank lenders (NBL) in the US, which tend to have more flexible credit standards, are six of the top 10 lenders by volume. In the UK, NBL have focussed on BTL lending where they have not yet been bound by stricter Prudential Regulation Authority guidelines that apply to deposit-taking institutions. NBL (especially government agencies) could also increase competition in Mexico as they move from index-linked lending to peso loans, the traditional market for banks.

Weaker UK Growth Forecasts Highlight Debt Challenge

Ensuring the medium- to long-term sustainability of the UK’s public finances appears more challenging following the November Budget and the Office for Budget Responsibility’s (OBR) reduction to its economic growth forecasts, Fitch Ratings says.

The OBR now expects real GDP growth to average 1.4% over the four years to 2020, down from 1.8% in its March forecasts, before picking up slightly to 1.5% in 2021. This would leave the level of real GDP in 2021 around 2% lower than forecast in March. The revision is largely due to a weaker productivity assumption, which also means the OBR’s assumptions for potential growth have come down significantly (now averaging 1.4% to 2021). Weaker growth makes reducing public sector indebtedness more challenging.

We expect the UK economy to expand by 1.3% next year, but are more optimistic than the OBR for 2019. Nevertheless, as we said when we affirmed the UK’s ‘AA’/Negative sovereign rating last month, our projections for 2019 are unusually uncertain, as macroeconomic developments will be related to the outcome of the Brexit negotiations.

The outcome of the June general election suggested that ‘austerity fatigue’ is a meaningful factor in British politics and the Budget included discretionary fiscal measures that will translate to a fiscal policy loosening of GBP16 billion in the next two financial years (around 0.3% of GDP in FY18/19 and 0.5% the following year).

The main changes on the tax side are the abolition of stamp duty for first-time home buyers for the first GBP300,000 on a purchase up to GBP500,000, and the freezing of fuel and alcohol duties. The main spending change is extra current and capital spending on the National Health Service of around GBP5 billion over the next three financial years.

The OBR still expects the public sector deficit to fall, but probably not fast enough to meet the government’s target of a balanced budget by the middle of the next decade. The structural deficit would still fall below the government’s 2% of GDP target of in FY20/21, but with a smaller safety margin than forecast six months ago.

The OBR now expects the public debt ratio to decline only slightly over the next three financial years. This underlines the scale of the challenge of putting the UK public debt ratio on a firm downward path.

Our deficit projections from our October rating review, which do not incorporate the latest policy announcements, imply general government debt declining gradually as a share of GDP from a peak of 88.3% of GDP in 2016 to 85.7% of GDP by 2019. This would still leave the UK with one of the highest public debt ratios among highly rated sovereigns. If we mechanically feed the discretionary policy changes in the Budget into our October public finance projections, this also suggests slightly worse public debt dynamics over the next few years.

LIBOR Transition Creates Uncertainty for SF Market

Replacing LIBOR presents challenges for the structured finance (SF) market that are likely to be addressed in the context of industry-wide initiatives, Fitch Ratings says.

The long lead time and a desire to avoid disruption to floating-rate bond markets such as SF should support the transition to standard benchmarks as successor reference rates. The impact on SF will depend on which rates are adopted, how consensual the process is across all market participants, and how they deal with technical and administrative challenges.

LIBOR is the reference rate for SF bonds and related derivatives contracts in several large SF markets. Almost all of the USD450 billion of US CLO notes outstanding reference LIBOR, as do USD186 billion of US sub-prime/Alt-A RMBS and USD24 billion of US prime RMBS. US student loan ABS commonly reference LIBOR. Elsewhere, nearly all UK RMBS reference Libor. Some underlying loans, such as leveraged loans, US hybrid adjustable-rate mortgages, US student loans, and auto loans, reference LIBOR.

Panel banks will maintain LIBOR until end-2021. This gives capital markets four-and-a-half years to agree a successor regime for the bulk of bonds currently linked to LIBOR, enabling a coordinated transition to as few benchmarks as needed. This would avoid costly ad hoc negotiations and potentially complicated bespoke transaction amendments. Loan markets may follow suit, although the risk of fragmentation geographically and by asset class could create SF basis risk in respect of existing loans, or alter the level of credit-enhancing excess spread.

There are practical challenges in co-ordinating transition. Voting rights in SF transactions, in some cases requiring majority consent of all classes of notes, may complicate any amendment process and even increase the scope for inter-creditor disputes. Trustees will also have an important role in determining what conditions are placed on transaction parties. These challenges will require effective use of the long lead time available.

To preserve liquidity, we think bond markets will generally follow initiatives in the derivatives market, where funding is hedged and discount rates determined. The International Swaps and Derivatives Association is examining fall-back provisions in LIBOR swap contracts, and working groups in some jurisdictions have recommended alternative near-risk free reference rates for the derivatives market, including the Sterling Overnight Index Average (SONIA) in the UK and the Broad Treasuries Repo Financing Rate in the US.

But it remains unclear whether the eventual successors to LIBOR will be overnight rate benchmarks or forward rate benchmarks, how far this will vary from country to country, and whether loan markets will adopt the same reference rates at the same time (reducing basis risk). At the heart of these questions is the effect on the value of currently contracted interest payments.

Any move to replace LIBOR with a benchmark that increased interest costs, particularly for retail borrowers, would face political objections. But a reduction in interest earned could also face opposition. Balancing these interests may prompt efforts to adjust margins to leave loan and bond coupons unchanged. Challenges coordinating the transition for assets and liabilities could leave SF transactions with basis risk, or change the level of excess spread. Possible consequences for ratings would also depend on the weighted average life remaining after 2021.

Commercial borrower behaviour may contribute to these risks. For example, some commercial real estate and leveraged loans include fall-back provisions aimed at managing temporary disruptions in LIBOR determination (such as polling a small panel of banks). These could make it harder to co-ordinate the transition for underlying loans and SF bonds, particularly in the leveraged loan market.

Unlike floating-rate commercial mortgages, leveraged loans are typically not hedged against interest rate risk, and may have more latitude in diverging from standardised successor benchmarks emerging from the derivatives market. If leveraged loan borrowers felt it was in their commercial interests to argue that fall-back provisions apply, basis risk would arise if CLOs moved to more liquid successor benchmarks.

China’s Cooling Housing Market Set to Weigh on Economy

China’s housing market is likely to continue to cool in response to stronger restrictions on home purchases across many cities and tighter credit conditions, say Fitch Ratings. Housing is the key cyclical sector in the Chinese economy, and will weigh on growth in the second half of the year and into 2018.

There is already evidence that the housing market is slowing. Growth in new residential property sales decelerated to 24.0% yoy (on a trailing 12-month basis) in May 2017, down for the fifth straight month from the 36.2% peak in December 2016. Price gains have also moderated. Secondary home prices in Tier 1 cities rose by 28.7% in 2016, but increased by just 3.6% in the first five months of 2017, and fell for the first time since September 2014 in May.

The downturn has been policy driven, with the authorities stepping in to prevent excessive froth in the market. Tightened rules on home purchases and mortgages are curbing buying by speculators and upgraders. Some first-time buyers might also be postponing purchases in the expectation that prices may fall. Meanwhile, the increased focus of the authorities on controlling leverage and limiting financial risks has led to a significant rise in money-market interest rates since last December, and some banks have recently increased mortgage rates.

The near-term outlook for China’s housing market is closely linked to the domestic credit cycle. As the chart below shows, housing sales move broadly in line with the “credit impulse” – or the change in the flow of new credit (including local government bonds) as a share of GDP. A weaker credit impulse, along with the tightening of home purchase restrictions, is likely to drag down home sales growth further in 2H17.

That said, the government will want to avoid causing significant volatility in the market. Home sales dropped by 9% yoy in early 2015, following the last tightening of restrictions, which contributed to a strong release of pent-up demand when policies were subsequently relaxed. We expect a more cautious approach this time, which is likely to result in home sales stalling, but not falling, in 2H17.

House prices are likely to decline slightly in 2H17, as demand weakens. We expect prices in Tier 1 cities to hold up better than in lower-tier cities. Prices in Tier 1 cities have risen by almost 90% in the last four years, compared with increases of 10%-25% in lower-tier cities. However, demand in Tier 1 cities remains strong and land supply is tight, which gives the authorities more scope to support the market if the downturn is sharper than expected. In lower-tier cites, demand is weaker and developers’ housing inventories are higher.

A likely weakening in the housing market is one of the main reasons behind our forecast that GDP growth will slow in 2H17. Investment in housing alone accounts for around 10% of GDP, and most estimates place its contribution to GDP much higher once supporting industries are included. There tends to be a six- to eight-month lag from sales to housing investment growth, which means that the economic impact of the housing market slowdown will continue well into 2018, when we expect GDP growth to slip slightly below 6%.

Medium Term Growth Potential Still Below 2% in Advanced Economies

Recent improvements in the near-term growth outlook for the advanced economies are not expected to be sustained over the medium-term, says Fitch Ratings in a new report.

“While we have become more optimistic about advanced country growth prospects in 2017 and 2018, our latest assessment of medium-term growth potential suggests that this year and next could be more or less as good as it gets,” said Brian Coulton, Chief Economist at Fitch.

New projections of supply-side potential GDP growth for the advanced economies covered in Fitch’s Global Economic Outlook (GEO) suggest underlying growth performance over the next five years will lie in the 1.25% to 1.75% range for most of the 10 advanced GEO countries. The demographic outlook is set to deteriorate further and we do not see a major turnaround in productivity performance after the slowdown witnessed over the last decade or so.

Nevertheless rising labour force participation rates – as more women enter the labour force and more “over 65s” stay in jobs or return to work – give some grounds for encouragement from recent supply-side performance. Furthermore, Germany’s success in reducing structural unemployment since the mid-2000’s shows the benefits to potential GDP that can accrue from labour market reforms.

US potential growth is projected at 1.8% p.a. This compares with long-run historical average growth of just below 3%, with the deterioration primarily reflecting demographics. UK potential growth is estimated at 1.7% relative to long-term average GDP growth of 2.2%. A structural slowdown in UK productivity over the last decade is only expected to be partially reversed. Potential growth for Germany and France is similar at around 1.2% but the mix differs markedly with a better outlook for productivity in Germany offsetting significantly worse demographics. Spain’s potential growth is in a similar range even though it has recently seen significantly faster actual growth.

Australia is expected to see the best supply-side performance over the next five years with potential growth of 2.4%, reflecting strong population growth and healthy labour productivity. At the other end of the scale, potential growth in Japan and Italy is projected at just 0.7% and 0.4%, respectively. Demographics weigh very heavily in Japan although this is partially offset by surprisingly robust productivity. Italy has, however, seen persistently falling productivity levels over the last 10 years.

The scope for growth to exceed supply-side potential rates over the medium-term as economic slack is absorbed is also limited. Output gaps – ie the shortfall in the level of actual GDP from potential GDP – are estimated to have been modest in 2016 for most advanced countries and with 2017 growth generally forecast to be faster than potential, they are narrowing. Only in Spain and Italy is the current negative output gap judged to be large enough to expect actual growth over the next five years to materially exceed its estimated supply-side potential rate.

Fed Heading for Faster-than-Expected Normalisation

The Federal Reserve hiked its benchmark rate hike this week. Judging by their associated comments, Fitch Ratings says this reinforces the view that U.S. interest rates will normalise faster than financial markets expect.

The Fed on Wednesday raised the fed funds target rate for the third time in seven months, to 1.00%-1.25%. The Fed also announced that it expects to start phasing out full balance sheet reinvestment in 2017 and provided details on the modalities of doing so.

The rate increase and accompanying comments bolster our view that the fed funds rate is likely to normalise at 3.5% by 2020, and U.S. 10-year bond yields will rise back above 4%. These developments would mark a significant shift in the global interest rate environment.

Fitch believes the Fed is increasingly comfortable with its normalisation process and less data-dependent following recent inflation readings that have been slightly lower than consensus expectations (although they remain close to target). The interest rate hike showed the Fed was prepared to look through weak first quarter consumption and GDP and underlines Fed concerns about unemployment falling too far below its equilibrium rate. .

Our fed funds rate forecasts also reflect scepticism regarding the idea that the equilibrium (or “natural”) U.S. real interest rate has fallen close to zero. We think the fall in actual real rates is explained by the slowdown in potential GDP growth driven by demographics and weaker productivity growth, and by an elongated credit and monetary policy cycle. As this extended credit cycle comes to an end, Fitch believes the Fed will set rates according to its view of the U.S.’s long-term potential growth rate and its inflation target. This suggests the equilibrium nominal fed funds rate would be 3.5%-4% if real rates normalise in line with our estimate of U.S. potential growth at slightly below 2%.

The impact on bond yields will also be determined by how far the term premium rises from the current historically low level partly caused by the Fed’s Quantitative Easing (QE) programme. The Fed’s approach to balance sheet normalisation sees reinvestment only to the extent that maturities exceed pre-set caps. The caps will initially be set at low levels but will rise to maximum levels of USD30bn per month for Treasuries and USD20bn per month for agency debt and mortgage-backed securities. A return to a positive term premium of 50bp-100bp as the QE programme is unwound would see long-term U.S. bond yields normalise at 4%-5% given our estimates of the equilibrium Fed Funds rate.