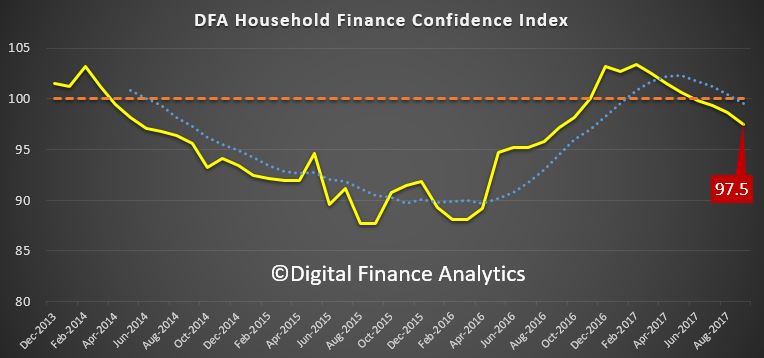
The September update of the Digital Finance Analytics Household Finance Security Index, released today, underscores the growing gap between employment, which remains relatively strong, and the Financial Security of households. We discussed this recently on ABC The Business. The Index fell from 98.6 in August to 97.5 in September.
 This is below the 100 neutral setting, and continues the decline since December 2016. Watch the video, or read the transcript.
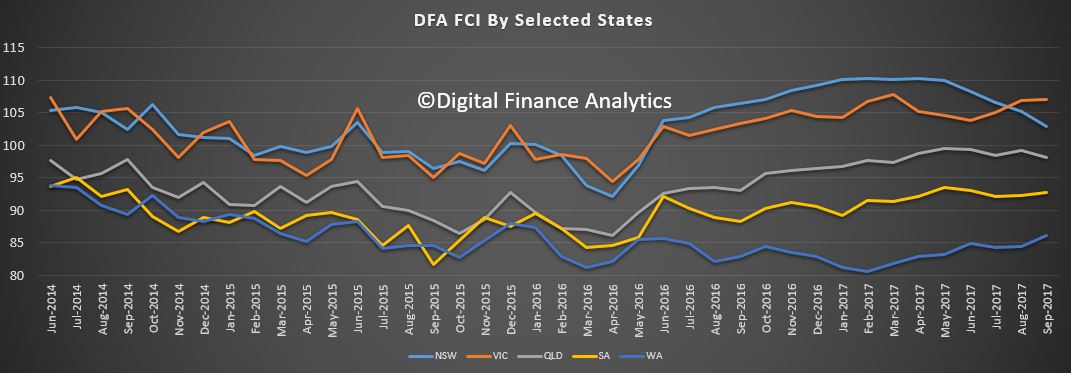
The state by state view highlights a fall in NSW, while VIC holds higher, and there was a rise in WA from February 2017 lows. This highlights the fact the households across the national are under different levels of pressure.
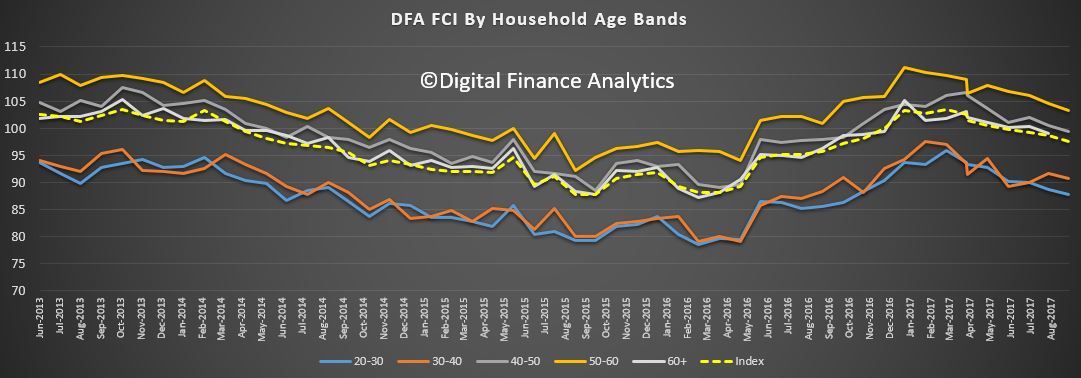
 Tracking by age bands we find younger households are significantly less confident, compared with those aged 50-60 years. But across the board, the general trend is lower.
 Property ownership remains a large factor, with those renting still below those owning property. We also see an ongoing decline in property investor confidence, thanks to tighter underwriting standards, higher mortgage rates, and the reduction in interest only loans availability.
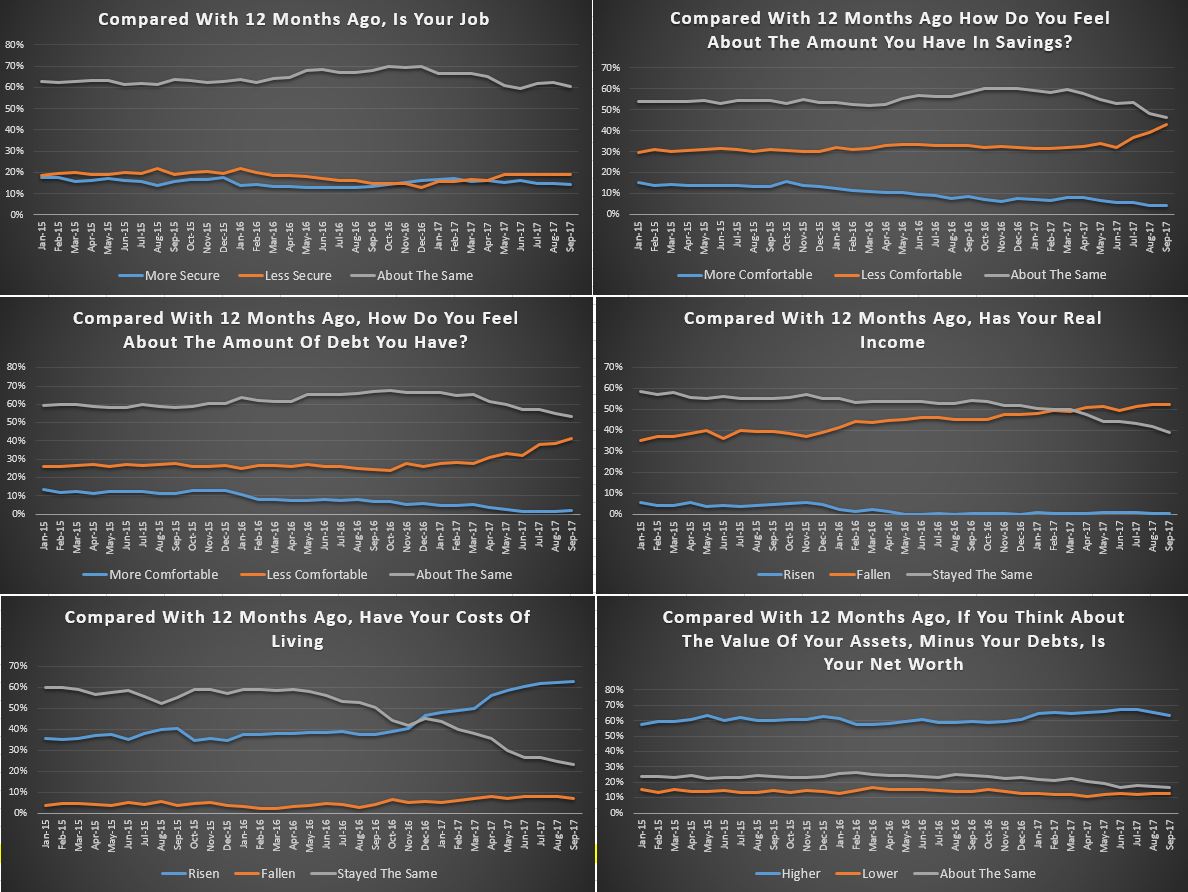
 Looking at the scorecard, there was a 4% fall in households comfortable with their savings, as they are forced to raid them to cover ongoing expenses (and the low returns on deposit balances as the banks seek to build margin). There was a rise of nearly 3% of households who were uncomfortable with the amount of debt they hold, reflecting higher mortgage rates, especially on investment loans and interest only loans, and concerns about future rate movements. Finally, more households reported their overall net worth has deteriorated as home prices came under pressure.
 The disconnect is that while people can, in the main, get some work, their earned income is not rising as fast as costs. We also find more households relying of a larger mix of fragmented part-time jobs, which tend to be less predictable. As a result, we expect the current trends to continue, as momentum in the housing sector ebbs. There is no obvious circuit breaker available in the current low interest rate, low growth environment.
By way of background, these results are derived from our household surveys, averaged across Australia. We have 52,000 households in our sample at any one time. We include detailed questions covering various aspects of a household’s financial footprint. The index measures how households are feeling about their financial health. To calculate the index we ask questions which cover a number of different dimensions. We start by asking households how confident they are feeling about their job security, whether their real income has risen or fallen in the past year, their view on their costs of living over the same period, whether they have increased their loans and other outstanding debts including credit cards and whether they are saving more than last year. Finally we ask about their overall change in net worth over the past 12 months – by net worth we mean net assets less outstanding debts.
We will update the results again next month.


One thought on “The Growing Gap Between Employment And Financial Security”