Today we commence the first in a new series of posts which examines household wealth, income, property and mortgage footprints. We will look at the latest trends in LVR and LTI; highly relevant given the tightening standards being applied in other countries, including Norway and New Zealand. We will be using data from our rolling household surveys, up to 9th September 2016.
Today we paint some initial pictures to contextualize our subsequent more detailed analysis, which will flow eventually into the next edition of the Property Imperative, due out in October 2016.
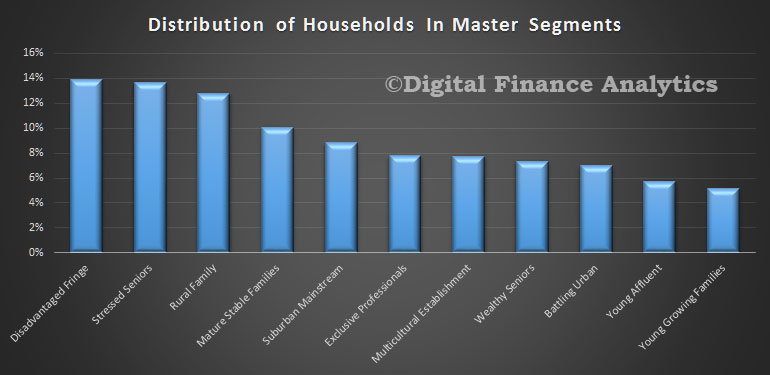
To start the analysis we look at the relative distribution of our master household segments. You can read about our segmentation approach here.
 Next we show the relative household income and net worth by our master segments. The average household across Australia has an estimated annual income of $103,500 and an average net worth (assets less debts) of $600,600; the bulk of which is property related.
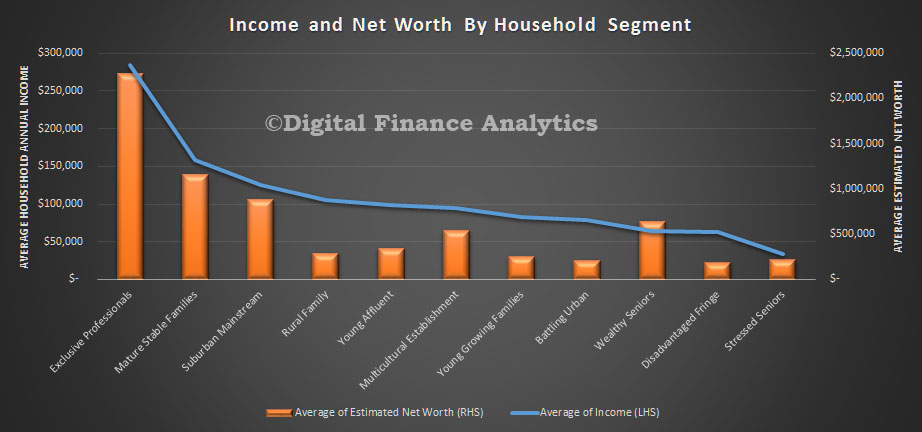 There are wide variations across the segments. The most wealthy segment has an average annual income of more than eight times the least wealthy, and more than ten times the relative net worth.
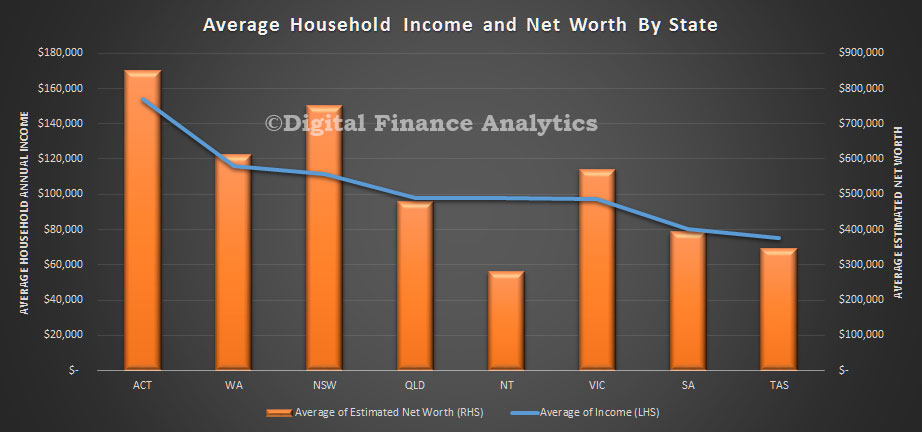
Across the states, the ACT has the highest average income and net worth, whilst TAS has the lowest income (half the income), and NT the lowest net worth (third the net worth).
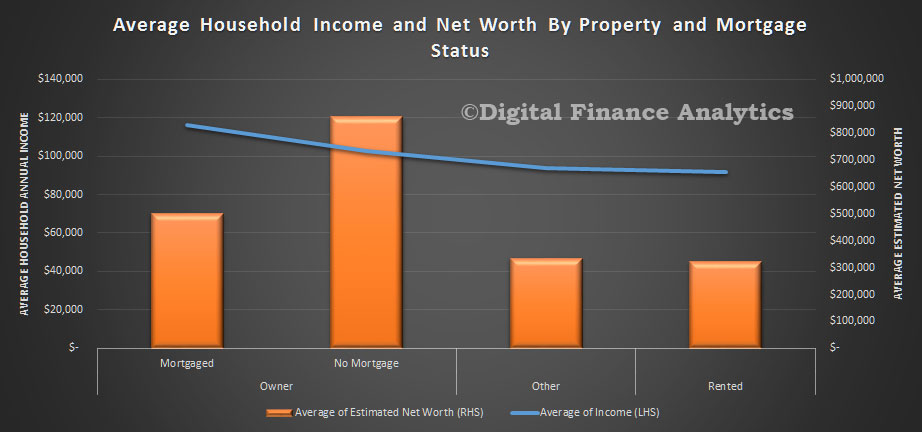
 Property owners are better placed, with significantly higher incomes and net worth, compared with those renting or in other living arrangements. Those with a mortgage have higher incomes, but lower net worth relative to those who own their property outright.
 The loan to value (LVR) and loan to income (LTI) ratios vary by segment.
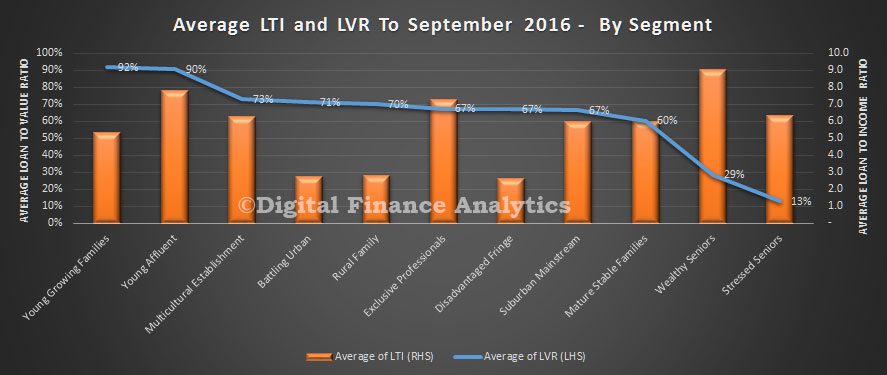 Young growing families, many of whom are first time buyers, have the higher LVR’s whilst young affluent have the higher LTI’s (along with some older borrowers). Bearing in mind incomes are relatively static, those with higher LTI’s are more leveraged, and would be exposed if rates were to rise.
Finally, we see that many loans have been turned over, or refinanced relatively recently, so the average duration of a mortgage is under 4 years.
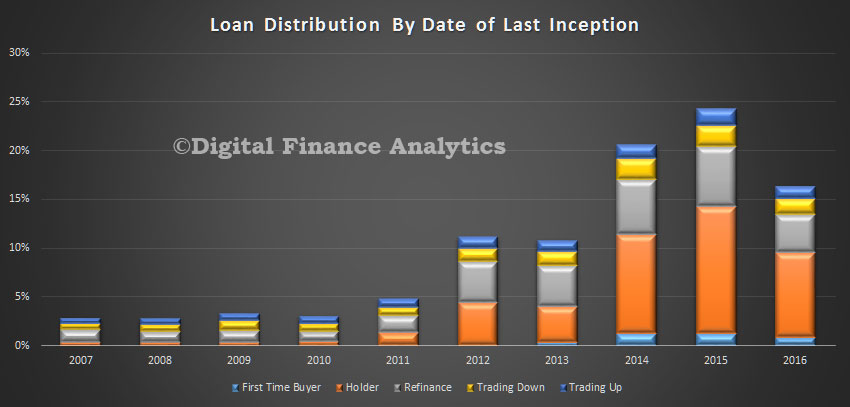 There is a relatively small proportion of much older dated loans which we have excluded from the chart above. Nearly a quarter of all loans churned in 2015, and 2016 shows the year to date count.
Next time we will look at LTI and LVR data in more detail.

2 thoughts on “Understanding Household Income, Wealth and Property Footprints”