No Housing Bubble In Australia – RBA

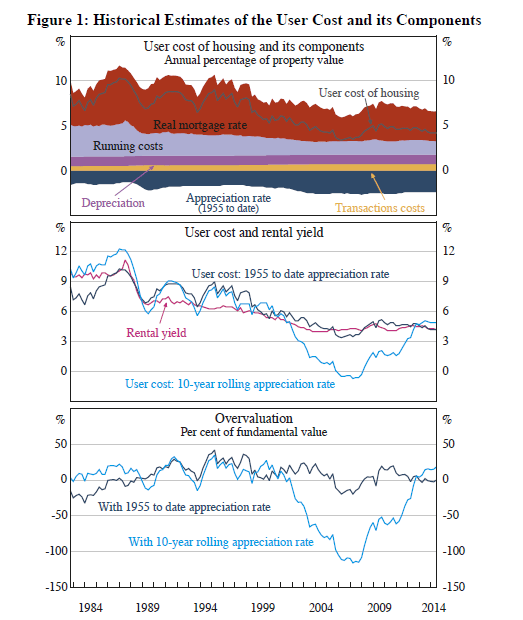
The RBA today published a discussion paper entitled Is Housing Overvalued?

This is an important question, given The Economist (2013) and the OECD (2013) report that Australian house prices are 24 per cent and 21 per cent ‘overvalued’, respectively. The report makes the point cost to income ratios are meaningless unless you know the cost of the alternative!

Their approach is to examine whether it is more expensive to own a house or to rent. They assess houses as ‘overvalued’ if home buyers pay too much, in the sense that they would be better off renting than buying. This involves comparing the financial cost of renting a home with the cost of owning a similar dwelling, where the latter depends on the purchase price, interest rates, repairs, council rates and so on.

They conclude that real house prices have increased at an average annual rate of slightly less than 2½ per cent since 1955. If this rate of appreciation is expected to continue then houses are fairly valued. Many observers have suggested that future house price growth is likely to be somewhat less than this historic average. In that case, at current prices, rents, interest rates and so on, the average household is probably financially better off renting than buying.

RBAPricesInterestingly, there is no direct discussion in the paper on housing bubbles, though there is a throw away line in the abstract “Recent data do not show signs of a bubble”.

Now, we agree that there is not a housing bubble in Australia, rather thanks to macroeconomic policies over a long period, poor land release, and freely available credit, house prices are out of kilter, based on loan to income, loan to value, and on other metrics. In fact, the best approach is to use a range of measures to baseline the position of house prices, across countries. The weakness in the RBA analysis is that house prices and rental costs are connected, so they will tend to move together. Therefore, relatively speaking the fact that rents are tracking prices are not a good indicator of whether house prices are over valued. It is a closed system, and self fulfilling.

Lending Finance Slips In May – ABS

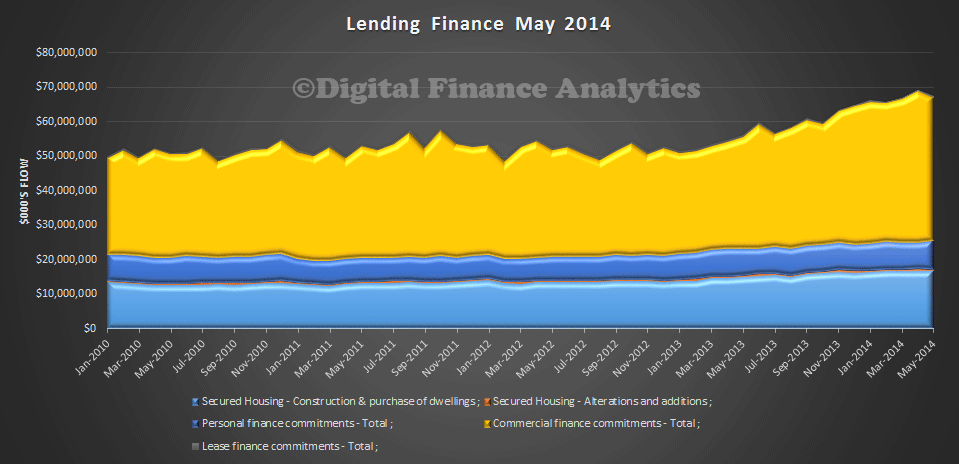
The ABS today published their data series on Lending Finance in Australia to May 2014. The seasonably adjusted value for owner occupation fell 0.7% compared with April, whilst overall commercial lending fell 6.0% month on month. There were increases in personal finance and leasing, but overall lending fell. We start with a chart showing the trend growth in seasonally adjusted terms from January 2010. Remember that commercial lending includes investment housing.

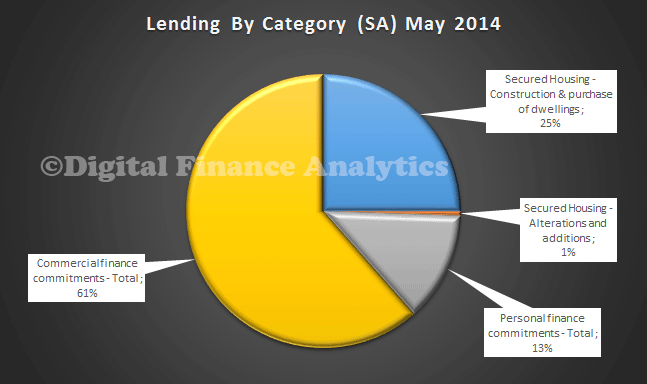
AllLendingAllCateMay201425% of loans were for housing owner occupation, 13% were for personal finance (both revolving and fixed term loans), and 61% were commercial loans.

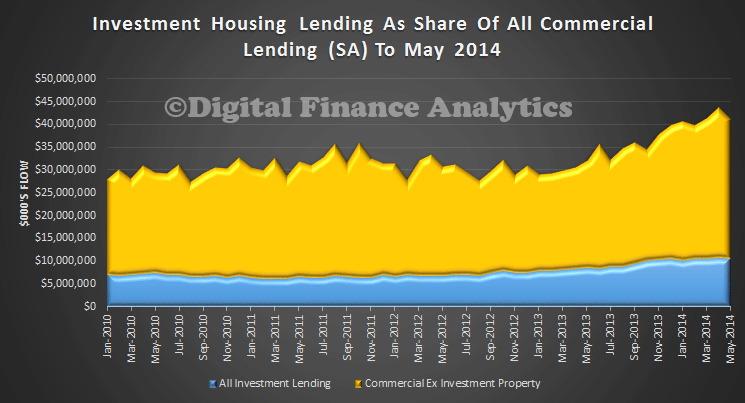
AllLendingAllCatePCMay2014So now we separate out the share of investment loans from commercial lending, and we see the growth has stalled.

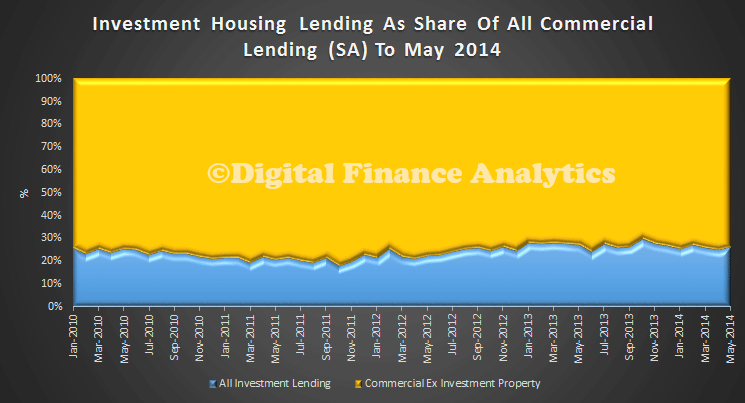
InvestmentShareofCommercial-May2104 This is more striking when we look at the percentage splits. About 25% of all commercial lending is for investment housing purposes.

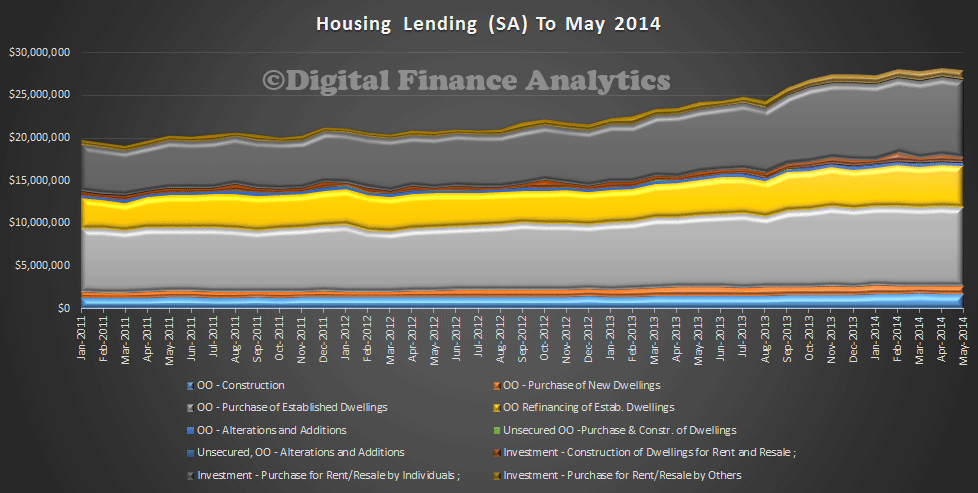
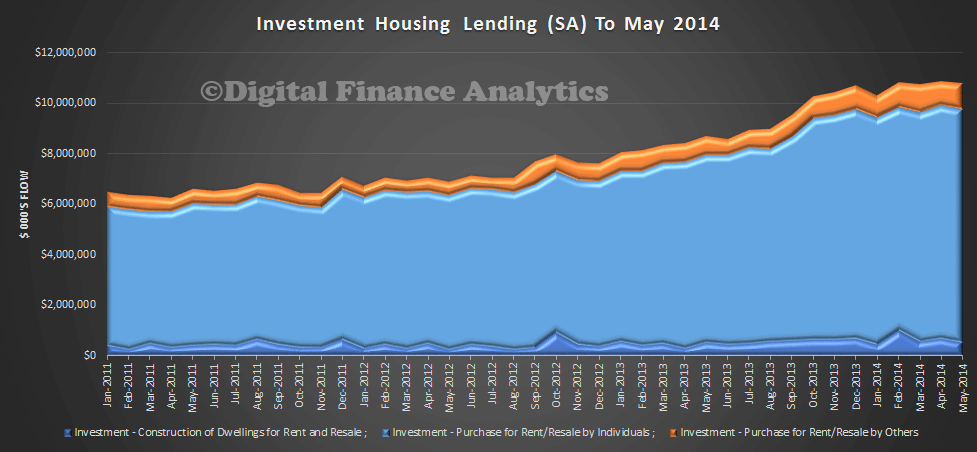
InvestmentShareofCommercial-PCMay2104Turning to housing lending, we see that this has also stalled in May. The growth in the “others” category, includes self-managed superannuation investors, though it is still a relatively small proportion of all lending.

HousingLendingMay-2014InvestmentMay2014

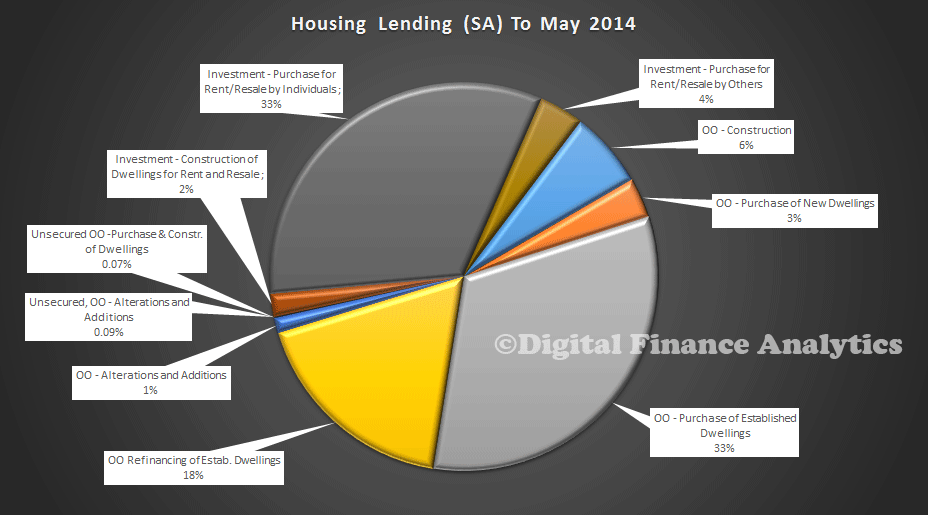
Looking at the splits, investment housing accounted for 39% of loans, 4% of which are for other entities, including SMSF’s. Refinancing accounted for 18% of lending, and 33% was for the purchase of established dwellings.

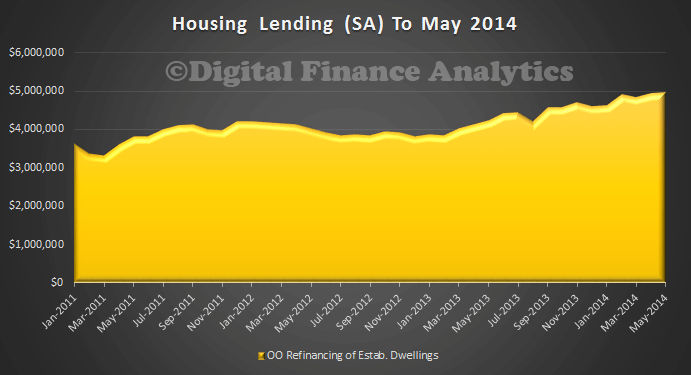
LendingPieMay2014  Finally, it is worth noting the trend growth in refinancing, households are still looking to lock in the current low rates, and to reduce their monthly repayments where possible.

RefinanceMay2014We hold to our view that momentum is shifting, as we reported recently.


Housing Sector Likely To Stall

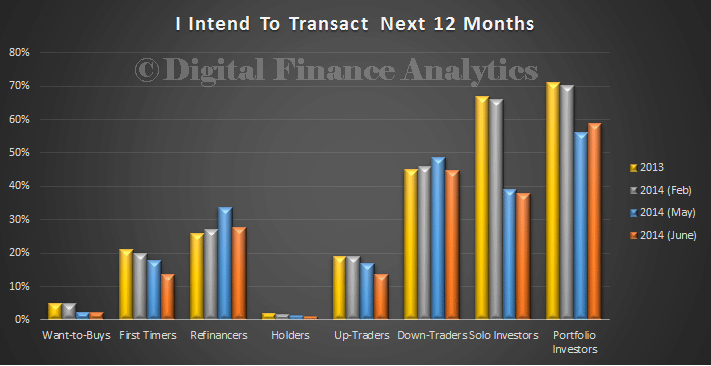
Reflecting on the ABS data released today, and already covered here, and putting that into context of our household surveys, we think momentum is changing and the housing sector could stall in coming months. Demand for new finance fell 0.8% in May. Whilst refinancing remains quite buoyant, thanks to low rates, investors appear to be slowing, as already foreshadowed in our surveys.

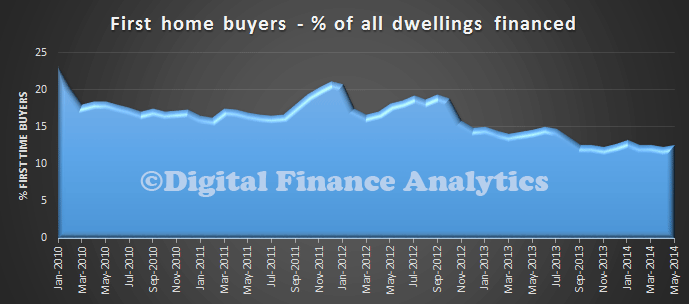
Transact12MonthsDFAJun14First time buyers are still at low levels,

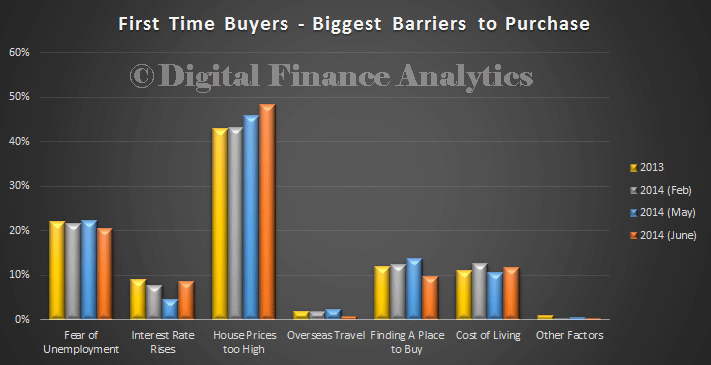
OOFTBMay2014and they are still priced out of the market.

FTBDFAJun14The current low interest rates and rising prices have together encouraged households to transact sooner than they might otherwise would, pulling transactions forwards, but this won’t last.

So, if future demand is not coming from first time buyers and investors, where will demand come from? Well, we know there are many households who would like to enter the market, but cannot because prices are too high, these property inactives won’t change their tune anytime soon. Will foreign investors keep the property ship afloat? The problem here is there is little good data on overseas investors, and in any case, is this sensible policy?  The contribution which SMSF investors might make will hardly move the dial.

We also know that unemployment is up, and likely to continue to trend this way, which directly impacts households and mortgage stress. In addition consumer confidence is not that flash.

We think interest rates may be taken down by the RBA later in the year, but lower rates wont bring more households out of the woodwork because the banks won’t relax their serviceability buffers any further.

Putting all this together, it is likely we are at the top, and both house prices and lending will probably reverse later in the year. This creates a massive problem for the RBA who were banking on housing being the economic bridge between the end of the mining boom and the return to growth from other commercial sectors.

We should have implemented policies to stimulate the commercial sector earlier, rather than inflating house prices and the banks balance sheets with unproductive lending. Lending to business returns growth to the economy,  flowing funds to inflated housing does not.

Housing Finance Up To $1.3 Trillion In May – ABS

The ABS released their latest housing statistics today. Total ADI lending now tops $1.3 trillion. Investment lending has reached a new high at 33.8% of all loans. The trend estimate for the total value of dwelling finance commitments excluding alterations and additions rose 0.2%. Investment housing commitments rose 0.3% and owner occupied housing commitments rose 0.2%. However, In seasonally adjusted terms, the total value of dwelling finance commitments excluding alterations and additions fell 0.8%.
OOMay2014There were some state variations in owner occupation loans, but in percentage terms there is more noise in the data from the smaller states. NSW, QLD and SA were up from the previous month, whilst VIC and TAS fell month on month.

OOStatePCMay2014

The proportion of fixed rate loans remain elevated, but off its 20% high in 2013.

OOFixedMay2014First time buyers were slightly higher in May, but still lower than average and close to all time lows.

OOFTBMay2014Investment lending is still a significant factor, with close of 33.8% of lending for investment purposes. This is an all time record for investment lending.

InvestmentPCMay2014The banks have a greater proportion of investment lending …

InvestmentPCBanksMay2014compared with credit unions or building societies.

InvestmentPCCUMay2014 InvestmentPCBSMay2014The stock of total ADI housing lending is now above $1.3 trillion in original terms.

StockHousingLoansMay2014Finally, note there is an investigation into the first time buyer data. The ABS advise that in collecting this information, lenders are asked to report all loans to first home buyers. Concerns have been raised that under-reporting could occur if some lenders were only able to accurately report on those buyers receiving a first home buyer grant. Most data on first home buyers are collected by the Australian Prudential Regulation Authority (APRA) under the Financial Sector (Collection of Data) Act 2001. APRA is contacting lenders on behalf of the ABS to investigate whether lenders experience any difficulties reporting on loans to first home buyers. The outcomes from the investigation will be published on the ABS website.

UK Rates Kept at 0.5%; QE Continues

Today the Bank of England announced that it would maintain Bank Rate at 0.5% and the size of the Asset Purchase Programme at £375 billion.

The previous change in Bank Rate was a reduction of 0.5 percentage points to 0.5% on 5 March 2009. A programme of asset purchases financed by the issuance of central bank reserves was initiated on 5 March 2009. The previous change in the size of that programme was an increase of £50 billion to a total of £375 billion on 5 July 2012.

In March 2009, the Monetary Policy Committee (MPC) announced that it would reduce Bank Rate to 0.5%. The Committee also judged that Bank Rate could not practically be reduced below that level, and in order to give a further monetary stimulus to the economy, it decided to undertake a series of asset purchases.

Quantitative Easing Explained

Between March and November 2009, the MPC authorised the purchase of £200 billion worth of assets, mostly UK Government debt or “gilts”. The MPC voted to begin further purchases of £75 billion in October 2011 and, subsequently, at its meeting in February 2012 the Committee decided to buy an additional £50 bn. In July the MPC announced the purchase of a further £50bn to bring total assets purchases to £375 bn. The purpose of the purchases was and is to inject money directly into the economy in order to boost nominal demand. Despite this different means of implementing monetary policy, the objective remained unchanged – to meet the inflation target of 2 per cent on the CPI measure of consumer prices. Without that extra spending in the economy, the MPC thought that inflation would be more likely in the medium term to undershoot the target.

This policy of asset purchases is often known as ‘Quantitative Easing’. It does not involve printing more banknotes. Furthermore, the asset purchase programme is not about giving money to banks. Rather, the policy is designed to circumvent the banking system. The Bank of England electronically creates new money and uses it to purchase gilts from private investors such as pension funds and insurance companies. These investors typically do not want to hold on to this money, because it yields a low return. So they tend to use it to purchase other assets, such as corporate bonds and shares. That lowers longer-term borrowing costs and encourages the issuance of new equities and bonds to stimulate spending and keep inflation on track to meet the government’s target.

The Bank will continue to offer to purchase high-quality private sector assets on behalf of the Treasury, financed by the issue of Treasury bills.

A video on Quantitative Easing is available.

Unemployment Up In June, Slightly.

The ABS released their Labour Force statistics for June 2014 today. Australia’s seasonally adjusted unemployment rate increased by 0.1 percentage points to 6.0 per cent in June 2014

The seasonally adjusted labour force participation rate increased by 0.1 percentage points to 64.7 per cent in June 2014. The number of people employed increased by 15,900 to 11,578,200 in June 2014 (seasonally adjusted). The increase in total employment was due to increased female employment (both full-time and part-time) and increased male part-time employment, offset by a fall in male full-time employment. Part-time employment increased by 19,700 people to 3,515,700 and full-time employment decreased by 3,800 people to 8,062,500.

The ABS monthly seasonally adjusted aggregate hours worked series increased in June 2014, up 15.1 million hours (0.9 per cent) to 1,629.1 million hours. The seasonally adjusted number of people unemployed increased by 20,300 to 741,700 in June 2014.

UnemploymentJun2014There are still considerable state variations, with unemployment lowest in the ACT (3.3%) and WA (4.9%), and highest in TAS (7.3%) and SA (6.8%).

UnemploymenStateJun2014As unemployment creeps higher, more households with large mortgages will be under pressure. We will be updating our mortgage stress modelling shortly.

ASIC Warns On Super And Managed Investment Fees

ASIC today released a report into fee disclosure practices for super and managed investments.  The intention of the fee and cost disclosure requirements is to promote comparability of products. However, ASIC’s review of industry practices indicates that there is significant variation in the disclosure of fees and costs. A key driver of this variation is the frequent complexity of the operational and investment structures of funds. In addition, data quality and differences in the interpretation of the fee and cost disclosure requirements can also lead to variations in disclosed fees. As a result, DFA’s take on the report is that investors need to be very careful when comparing products. ASIC makes a number of significant observations. Remember this is a $2,338.8bn industry, and fees have a profound impact on the overall returns from an investment.

  • The reporting of fees and costs in underlying investment vehicles has been an area of significant concern. The fees and costs that are generally disclosed in a fund-of-funds arrangement are the fees and costs of the fund-of-funds manager, and not the fees and costs associated with the underlying funds. As a result, fees and costs may be understated by as much as 0.20%–0.40% annually.
  • The disclosure of indirect costs provides investors with a more accurate representation of the overall fee burden associated with each product and allows for increased comparability across funds.
  • Whilst difficult, APRA expects trustees to make all reasonable efforts to obtain information about their investments beyond the first non-connected entity.
  • The disclosure of management costs is an area of significant concern for ASIC. Anecdotally, it has been alleged that there are instances of costs being manipulated to present investors with a product that appears to be more financially attractive than it really is.
  • These disclosure practices can be fundamentally misleading because they reduce the amount disclosed as management costs and do not accurately portray the cost of individual products. They also prevent investors from being able to accurately compare superannuation or managed investment products against each other.
  • There is also a lack of clarity in the industry regarding how future performance fees should be determined and disclosed. Currently, a number of alternative methods are used to determine future performance fees, and this can result in significantly different projections across superannuation funds. One common practice is for superannuation funds to disclose the previous year’s performance fees as a reflection of what will occur in the current year. ASIC considers the adoption of this practice may lead to misleading results because it implies that past performance fees are indicative of future performance fees.
  • Inconsistency in the disclosure of fees in relation to the treatment of tax undermines the purpose of the Stronger Super reforms because it prevents investors from accurately and confidently comparing fee structures between superannuation funds.
  • The disclosure of fees net of income tax assumes that all investors receiving the PDS will be entitled to a share of the reduction in income tax resulting from the costs that the fees pay for. However, only investors who have received taxable income during the year into their superannuation account—such as positive investment returns or taxable contributions (e.g. employer contributions)—are entitled to a reduction in income tax. ASIC considers the disclosure of fees net of income tax to be misleading to investors who are not entitled to a reduction in income tax.
  • ASIC encourages industry to develop industry standards for good practice in fee and cost disclosure for superannuation funds and managed investment products.

We discussed the questions of fees in the light of FOFA recently. The ASIC report provides further evidence that improvements need to be made.

Increasing Competition In Banking – Lessons From The UK

​The UK Prudential Regulation Authority (PRA) and Financial Conduct Authority (FCA) have today published a review of the changes introduced last year which were put in place to reduce the barriers to entry for new financial institutions. The purpose of the measures was to enable increased competition in the banking industry, to the benefit of customers. The changes focussed on two key areas: reforms to and a simplification of the authorisation process for new banks; and a major shift in the prudential regulation, such as capital requirements, for new entrants.

The two areas of focus were:

  1. A new ‘mobilisation’ option where authorisation is granted when a firm has met key essential elements but with a restriction on their activities due to some areas still requiring completion.
  2. Capital and liquidity requirements for new entrants are now lower than before, but are set against a requirement for a firm to show the regulators that it has a clear recovery and resolution plan in place in the event of it getting into difficulty in the future.

In the twelve months following the changes, the PRA authorised five new banks and there has been a substantial increase in the number of firms discussing the possibility of becoming a bank with the regulators. In the twelve months to 31 March 2014 the regulators held pre-application meetings with over 25 potential applicants. These firms have a range of different business models from retail and wholesale banking to FCA-regulated Payment Services firms who are looking to enter the banking market and offer deposits and lending to their current client base (including small SMEs) and others who are proposing to offer a mixture of SME or mortgage lending funded by retail and SME deposits.

The minimum amount of initial capital required by a new entrant bank is £1m compared to £5m under the previous regime. The on-ramp strategies have been helpful for applicant firms that may previously have faced challenges in raising capital or investing in expensive IT systems without the certainty of being authorised.

The PRA intends to publish statistics regarding banking authorisation annually.

In the Australian context, we know from recent client work that potential new entrants face a stiff climb to gain access to the local market. Consideration should be given to given to emulate the UK approach, because we need greater competitive tension in Australian banking.

Why FOFA Matters So Much

Last week, the Future of Financial Advice regulations were tabled in Parliament, following the recently published Senate review.  As currently incarnated they have the potential to drive a coach and horses through the original intentions of the FOFA reforms. Today we explore why this is so, and highlight some of the consequences for both the managed funds industry and investors.

First, we need to remember that according to the ABS, as at 31 March 2014, the managed funds industry had $2,338.8bn funds under management, an increase of $31.3bn (1%) on the December quarter 2013 figure of $2,307.5bn. This is the marked to market value of the overall portfolio, helped by the facts that S&P/ASX 200 increased 0.8%; the price of foreign shares, as represented by the MSCI World Index excluding Australia, increased 0.6% and the A$ appreciated 3.1% against the US$. Here is the trend chart from the ABS series.
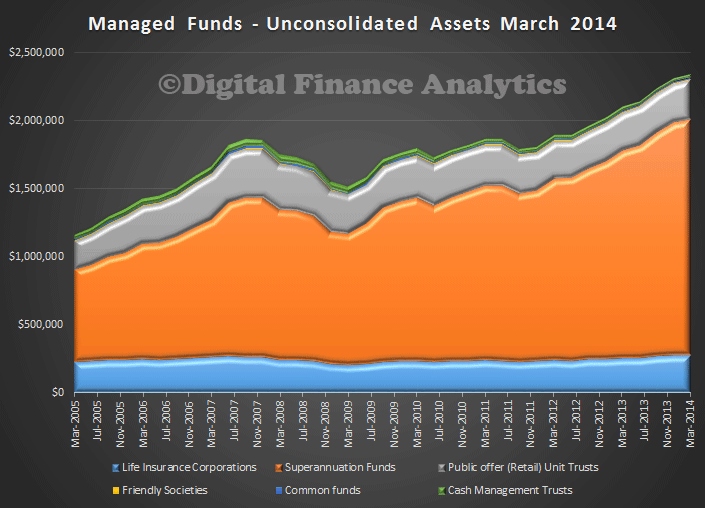
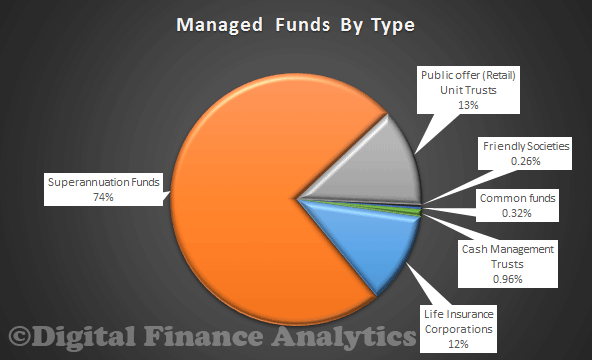
Managed-Funds-March-2014Looking at the splits by type, superannuation is the largest contributing element, with 74% of the total, or $1.706.1bn. This is not surprising seeing as we have a forced savings scheme for households.
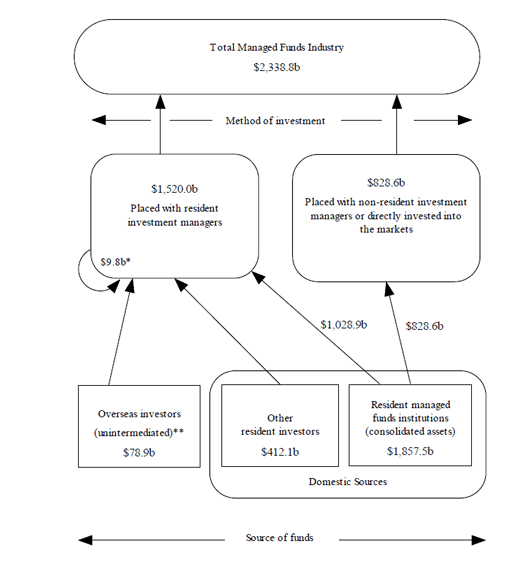
Managed-Funds-March-2014-PCThe ABS also show the industry flows in their report. Local Investment Managers have $1,520 bn invested, whilst $828.6 bn are invested with managers overseas, or directly into the market.
ABS-Managed-Funds-ChartThere has been considerable consolidation in the managed funds industry, looking at the managers themselves, the financial planners, and the wealth management platforms. The big banks are estimated to have about 80% of the financial planners, and are behind the bulk of the wealth management platforms and fund managers. This significant industry concentration is bad for competition, households and savers. We discussed this at length in our earlier series on superannuation. This is part of a wider consolidation within financial services, and should not have been allowed to happen, because such value chain consolidation allows a small number of players to control the industry, reduce competition and keep fees high. We recently covered the question of wealth management fees, those in Australia are significantly higher than elsewhere, despite the higher savings per capita. There have also been reports of poor or fraudulent advice to investors, where advisors recommended their own solutions, even if they were not the best for the investor concerned. Of course the original FOFA proposals was a response to this. We covered the history of FOFA up to the recent Senate Inquiry here.

So, now lets look at the latest regulated changes. On 30 June 2014, the Government registered the Corporations Amendment (Streamlining Future of Financial Advice) Regulation 2014. These changes  to the FoFA laws were effective from 1 July 2014, and note they are yet to be tested in the Senate, maybe the regulatory amendment approach was seen as a way to avoid scrutiny. The changes are

  • to remove the Opt-In requirement;
  • to require Fee Disclosure Statements (FDS) to apply prospectively – for new clients from 1 July 2013 only;
  • to remove the requirement to satisfy section 961B(2)(g) (the ‘catch-all’ provision) from the best interests duty;
  • to allow for scaled advice;
  • to amend the grandfathering regulations in order to remove the current restrictions on trade for financial planners who may change employers/licensees, and enable fair market competition for financial planners selling their business;
  • to ban commissions on investment and superannuation products, and eliminate the possibility of a re-introduction of these commissions through the previously proposed general advice exemption.

The Governments position is that financial planners will continue to provide advice in the best interests of their clients, without the catch-all provision, and that as commissions have been banned for providing general advice, (despite the fact that advisors may receive other remuneration options and bonuses), they will not be conflicted. Therefore, the changes will reduce the costs of advice, and provide greater access to potential investors.

We are not convinced. In fact, we think that the latest adjustments will lead to confusion in the industry, enable the large banks to continue their consolidation and control of the industry, and will lead to investors potentially being given poor advice.

First, it will be easy to get round the ban of commissions. The original FOFA would have outlawed financial planners working in the banks to receive any reward for suggesting their own products. In addition, any fees or commissions would have had to be disclosed. Now, planners can provide general product advice, and get rewarded. In addtion, bank tellers, and other bank employees are now able to receive bonuses for selling products under general advice, provided they have an appropriate “target” and it is not called a commission. This creates a conflict.

Second, the original FOFA did not really separate specific advice (where a planner takes the history and needs of a client, to work out what their best investment strategy might be) and general product advice, or splitting advice from product sales. Product sales were overlaid with considerable obligations and requirements, more befitting advisors. In addition, people selling products could not be rewarded for achieving sales (as happens in most sales environments). What should have happened was a clear distinction between sales and advice, with sales able to be remunerated, but advisors not. Advisors would never sell products, so could not be conflicted.

The proposed changes which the Senate Inquiry considered were to allow planners to receive a proportion of their income from product sales, with the caveat that it should be in the best interests of the client.  However, now in the regulated clauses, this best interest element has gone missing. Because the best interest clause has been removed, financial planners are now able to point potential investors to their own bank products, provided they meet their savings requirements, even if they are not the best products. So, a planner has no obligation to point to the best product in the market, even if that is with a competitor.

So, the amendments as currently in the regulations, work in favour of the big banks, means that planners can remain conflicted, tellers can sell products, and the potential to release real competitive tension into the market as products would have be compared cross market (with an bias towards cheaper?) are all gone.

We can only hope the new Senate will have the chance to review and change the regulations.  The really interesting question, is whether the latest round of changes reflect a poor understanding of how the wealth management industry works, or whether the big banks, protecting their own highly profitable enterprises have lobbied successfully. Remember wealth management fees in Australia are three times higher than they should be!
 

Whilst Bank Margins Improve Significantly, Most Households Do Not Benefit

Using the updated RBA chart pack data, we can see the movements in deposits, lending and funding, all elements impacting bank profitability and their customers. We see that funding costs are down, deposit returns are down, whilst headline lending rates are static. This is creating an opportunity for banks to discount selectively to attract target housing lending. Looking in more detail, margins on personal loans have increased, with no change to the average rate since 2012, despite the fall in funding costs and the target rate since then. Average mortgage rates have not changed since September 2013, again despite falls in funding costs. Deposit rates have been falling recently as can be seen from the chart. Small business lending rates are still very high. This is creating significant profit for the banks.

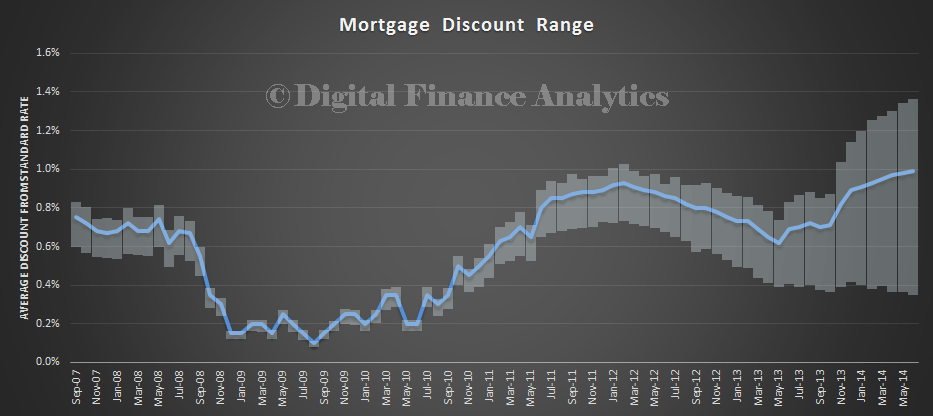
Bank-MarginsIn addition, wholesale bank funding costs are lower than they have been since 2007, and we are even seeing improvements in the costs of securitisation, as well as debt based funding. We recently published an update to our series on mortgage discounting, and we highlight again the wide range of margins available depending on the particular transaction involved. Large home loans, and investment property loans appear to attract the biggest discounts. Small business on the other hand find it hard to get any reduction in interest rates.

DiscountJun-Range Those with the capacity to switch have the potential to negotiate quite a discount, but those unwilling or unable to switch are unable to take advantage of the lower rates, so continue to be locked into high rates, which flow direct to the bank’s bottom line. And remember, according to the BIS, we have some of the most profitable banks in the western world. Clearly competitive tension is insufficient to drive down margins for most households. I will be interested to see if the current Financial Sector Inquiry discusses the question of completion in banking as it looks to me to be a major issue, which is costing Australia Inc, dear. Banks were quick to put their rates up when needed, but the reverse is not true.