Cyber Resilience: A Financial Stability Perspective

Andrew Gracie, Executive Director, Resolution, Bank of England, spoke at the Cyber Defence and Network Security conference, London on Cyber Resilence and its impact on financial stability. He argues that cyber is an ever-present threat and firms need to stand ready to manage this risk. And just as cyber has changed the world for firms, it has also changed the landscape for authorities; so they need to adapt their approach to operational resilience of the financial sector as a whole. He outlines two areas of focus for the regulators. First, dialogue with the main industry firms, and second, with their agreement, stress testing and simulations to test response frameworks. Indeed, a joint testing programme between US and UK governments and authorities will start this year. This is because cyber knows no borders and the significant operational inter-linkages between systems cross borders and it reflects the growing dialogue with the US and others as to how best to manage the risk to financial stability from cyber. He also makes three observations:

  1. Cyber has changed the rules: existing operational resilience arrangements are often geared to dealing with physical threats. These still matter. But cyber changes the game. Cyber is a dynamic, intelligent and adaptive threat. In the cyber arms race, costs are stacked in favour of the attacker, not the defender. To meet the challenge, organisations need to have policies and processes that are dynamic, intelligent and adaptive too. This means investment in capability to identify threats and detect cyber attacks. Without this situational awareness it is hard to determine and achieve appropriate maturity levels for cyber defence and to allocate resources effectively to meet the threat.
  2. Cyber is not a minority sport for technologists only: Of course the first line of defence is critical and we still need IT specialists who understand the technical challenges cyber presents. But good cyber resilience is about much more than technology. It is about culture too and this means people and processes. All parts of an organisation need to understand cyber risk and their responsibilities towards improved cyber hygiene. This includes Board level engagement. Front line business areas need to understand and own the risk. Management of cyber vulnerabilities needs to feature in strategic planning.
  3. Cyber requires effective and regular testing: Of people, processes and technology. Industry investment in cyber is significant but testing the effectiveness of this investment has not kept pace. Assurance is often based on audits and control sampling which is not sufficient, not least because of the challenge for internal audit departments to keep pace with change in this area. And of course, given the dynamic nature of the threat, such tests should take place on a regular basis.

Finally, he highlights that firms need to cooperate not compete in this space. With that in mind, the regulators are working with industry to strengthen arrangements for information sharing, reviewing existing forums for tactical information sharing and supplementing them where necessary with arrangements for more strategic information sharing including on good practice.

Australia to Launch A “Digital Transformation Office”, But With No Budget

The Commonwealth Government will establish a Digital Transformation Office (DTO) within the Department of Communications so that government services can be delivered digitally from start to finish and better serve the needs of citizens and businesses according to a joint statement from the Prime minister Tony Abbott and communications minister Malcolm Turnbul.

The DTO will comprise a small team of developers, designers, researchers and content specialists working across government to develop and coordinate the delivery of digital services. The DTO will operate more like a start-up than a traditional government agency, focussing on end-user needs in developing digital services.

The DTO will use technology to make services simpler, clearer and faster for Australian families and businesses.

People need to be able to transact services and access information anytime, anywhere. Like any other service industry, government should design its services in the most user friendly way. Interacting with government should be as easy as Internet banking or ordering a taxi through an app.

One of the DTO’s first tasks will be to ensure people no longer have to complete separate log on processes for each government service.  Instead, people should have a ‘digital identity’, which they can use to log in to each of their services across the government.

The DTO will also work closely with State and Territory Governments to identify opportunities for collaboration, including ways to make better use of myGov.

By designing digital services that are consistent and simple to use, fewer people will need to come into a shopfront or make a phone call.

The Government is committed to protecting the personal information it holds about individuals and businesses. Maintaining the security and privacy of personal information is a vital consideration for the DTO.

It is worth noting that there is no new budget for the DTO, “the government already has significant expenditure on service delivery and it is anticipated that much of the DTO’s work will be funded through existing expenditure”.

ECB European QE To Start With “Shock-and-awe”

So the European Central Bank (ECB), QE programme is confirmed. Overnight, President Mario Draghi announced the launch of an open-ended, expanded monthly 60 billion euro (US$70 billion) private and public bond-buying program. However, the programme is open-ended until at least 2016 and could amount to as much as a trillion euros.

The program will start in March this year. The hope is that it will boost the region’s painfully low inflation rate, which came in at an annual minus 0.2 percent in December. Draghi said:

Inflation dynamics have continued to be weaker than expected. While the sharp fall in oil prices over recent months remains the dominant factor driving current headline inflation, the potential for second-round effects on wage and price-setting has increased and could adversely affect medium-term price developments.

This assessment is underpinned by a further fall in market-based measures of inflation expectations over all horizons and the fact that most indicators of actual or expected inflation stand at, or close to, their historical lows. At the same time, economic slack in the euro area remains sizeable and money and credit developments continue to be subdued. Second, while the monetary policy measures adopted between June and September last year resulted in a material improvement in terms of financial market prices, this was not the case for the quantitative results. As a consequence, the prevailing degree of monetary accommodation was insufficient to adequately address heightened risks of too prolonged a period of low inflation. Thus, today the adoption of further balance sheet measures has become warranted to achieve our price stability objective, given that the key ECB interest rates have reached their lower bound.

Looking ahead, today’s measures will decisively underpin the firm anchoring of medium to long-term inflation expectations. The sizeable increase in our balance sheet will further ease the monetary policy stance. In particular, financing conditions for firms and households in the euro area will continue to improve. Moreover, today’s decisions will support our forward guidance on the key ECB interest rates and reinforce the fact that there are significant and increasing differences in the monetary policy cycle between major advanced economies. Taken together, these factors should strengthen demand, increase capacity utilisation and support money and credit growth, and thereby contribute to a return of inflation rates towards 2%.

The ECB is joining the U.S. Federal Reserve, Bank of England and Bank of Japan in launching a quantitative easing (QE) scheme.

Looking at the scheme in more detail, the ECB will purchase euro-denominated investment-grade securities only. However, debt that is trading with a negative yield will also be eligible for the program. Draghi also said that in the event of a sovereign restructuring or default, public and private bondholders would be treated on equal terms. Twenty percent of the additional purchases will be subject to risk-sharing arrangements, designed to limit the amount of risk the ECB takes on to its balance books. The majority of risk will remain with euro zone national central banks. No more than 25 percent of each debt issue will be purchased. The maturities of the debt purchases will range between two and 30 years.

It is worth noting that the ECB also announced it would hold its main interest rate unchanged at 0.05 percent, with the rate on its marginal lending facility at 0.30 percent. The rate on its deposit facility was held at -0.20 percent. Yes, that is a negative number, so deposits are attracting a charge!

Bank Spreads Have Increased By 35 Basis Points

Continuing our analysis of bank margins, we have updated our industry model, with the latest funding and product data. At an aggregate industry level, we see that the average home lending rate has remained static (because whilst there are substantial discounts for new loans, the bulk of the back book has not seen any rate reduction) since 2013. The RBA last reduced their cash rate in August 2013, and the benchmark rate has remained static since then.

NetMarginDec2104However, savers have see their returns falling thanks to deposit repricing initiatives. Between September 2013 and now, the average deposit return has dropped by 35 basis points. As we explained, banks are less reliant on deposits, and can get cheaper funding from other sources (and the recently announced QE in Europe will make funding even cheaper).

So, despite the fact that the banks are unlikely to be able to reduce their provisions much further (as they did last year) to bolster profits, and their increased capital requirements, the highlighted net increase in margins bodes well for bank performance, though at the expense of borrowers, who are not enjoying rate reductions, and depositors who are seeing their interest rates continuing to fall.

What Can Monetary Policy Do?

In a speech at the University of Edinburgh, External MPC member Professor David Miles set out the strengths and limitations of monetary policy. He argues that although central banks cannot keep inflation at a specific target at all times, monetary policy is more powerful than assumed by many economic models. But it is more reliant on being consistent with fiscal policy than is often recognised.

Central banks cannot keep inflation at target at all times. Nor would it be desirable for them to do so. The UK’s current experience is evidence of this; the significant fall in oil prices over recent months has, among others things, brought the level of inflation down to 0.5% with a chance that it will temporarily dip below zero in coming months.  But clearly ‘one should not expect a central bank to be fully able to offset the impacts of such huge swings in commodity prices on current inflation.’ This is why ‘having a flexible inflation target which… allows policy to be set so as to return it to target over several quarters’, such as that in the Bank of England’s remit, ‘makes sense’.

But while monetary policy cannot prevent actual inflation being blown off-target, there are other respects in which, David argues, monetary policy can achieve ‘a lot more than is implied by many economic models’. These models often focus on how expectations shape the forward-looking behaviour of consumers, primarily through substitution effects. ‘In practice, in a mid-sized open economy with a huge stock of mortgages that are largely variable rate the mechanisms by which changes in interest rates affect spending go far beyond substitution effects’. By influencing short term spending decisions through cash flow effects, the influence of monetary policy extends beyond its impact on expectations.

‘Once you take seriously the idea that significant parts of the transmission mechanism of monetary policy don’t work through substitution effects, and may not solely reflect the expectations of forward looking agents, that can affect how you see unconventional monetary policy’. The idea that monetary policy loses most of its traction at the zero lower bound ‘underestimates what a central bank that is able to use its balance sheet can do’. David makes clear that he does not think the current low rate of inflation in the UK warrants additional stimulus. But the MPC’s previous experience of unconventional monetary policy, suggests its effectiveness extends beyond just its impact on expectations about future interest rates.

However, even accepting that monetary policy may be more effective than is sometimes realised, ‘monetary policy cannot be expected to achieve price stability in isolation from things fiscal’. This is because ‘monetary policy has fiscal consequences and unless fiscal policy is set in a way which is consistent with the aim of monetary policy those aims will not be met.’

‘This is not the same thing as saying that monetary policy has to be subordinate to fiscal policy.’ But it does highlight the importance of the primacy of the inflation target in anchoring inflation expectations and raises important questions about the future of the Bank’s balance sheet.

In concluding, David considers the case for broadening the aims of monetary policy and finds that any such move would be ‘unwise’. ‘Flexible inflation targeting is not inconsistent with attaching significant weight to short term fluctuations in output and employment.’ Longer to medium term targets for economic activity are a different matter. ‘Either those other targets are consistent with an inflation target – in which case achieving the inflation target is likely to require that output and employment over the medium term do not drift away from them – or they are not.  If they are consistent then there is nothing much to be gained by adding them to the inflation target’.

In sum, ‘monetary policy does not hold all the cards’. It cannot, and should not aim to, keep inflation to target at all times, and that target itself needs to be consistent with fiscal policy. However, monetary policy can also influence the economy in more ways than standard economic models imply.

New Home Sales Continue Upward March – HIA

The latest result for the HIA New Home Sales Report, a survey of Australia’s largest volume builders, highlights a second consecutive rise for sales in the month of November 2014. Renewed upward momentum in the multi-unit segment drove growth in overall new home sales in late 2014. In fact sales of multi-units surged in both October and November to reach their highest level since September 2003.

HIAJan2015

Whilst detached house sales increased by 4.0 per cent in Victoria, 16.0 per cent in Queensland, and 0.3 per cent in South Australia, detached house sales fell in November in New South Wales (-5.6 per cent) and Western Australia (-10.6 per cent, following a +24.8 per cent result in October).

HIA says the key leading indicator measures of building approvals and new home sales suggest this re-concentration of growth in the ‘multi-unit’ segment will persist into 2015. They call for a focus on housing policy reform to a further burst of growth in detached house construction which would at the same time provide productivity gains for the broader Australian economy.

60% of Australian Internet Users Use a Tablet – eMarketer

Australia enjoys the highest tablet penetration rates in Asia-Pacific, in terms of both internet users and the general population, according to eMarketer’s latest estimates of tablet usage around the world. By the end of this year, tablet penetration among internet users will be more than 10 percentage points higher than in second-place China, and among the population at large, the difference will be more than 20 percentage points.

With a projected 10.3 million tablet users this year, Australia is the only country in Asia-Pacific to have tablets reach a majority of the internet population already, and also the only country in the region where we expect a majority of the total population to use tablets at any point during our forecast period. Even other mature markets in the region, like South Korea and Japan, will have relatively low penetration throughout our forecast period, due to several factors including aging population and high usage of phablets. Australia’s relatively small population, however, means that in absolute numbers, the tablet population is the second-smallest in Asia-Pacific, ahead of South Korea.
DFA Video Blog On Why Savers Are Getting Crunched

Savers are seeing deposit rates falling according to our household surveys. This short video explains why, and which households in particular are most impacted.

There is bad news for those households with bank deposits. We have already seem a range of deposit repricing initiates by the banks, as they trim their deposit rates. But it is likely to get worst, as international sources of funding get cheaper, and changes to capital requirements are likely to translate to further rate cuts for savers down the track.

We see that Down-Traders hold the largest relative share of savings, up from 32% last year to 38% this year. All other segments are at the same relative values as last year, or at lower levels. This highlights that people looking to sell and move to smaller properties are hold the most significant savings.

In this analysis, savings includes balances in current accounts, call and term deposit accounts, and other liquid savings vehicles, but excludes property, shares are superannuation.

Looking at savings intentions, we see that Down-Traders are expecting to save more next year (55%), and only 5% are expecting to be savings smaller amounts. Investors, Portfolio Investors and Refinancers are more likely to be saving less next year. Want to Buys and First Time Buyers are also quite likely to do the same next year.

There will be a realignment of savings vehicles, thanks to the low bank deposit rates, many savers are looking at shares or property as an alternative. Actually this is introducing more risks into savings portfolios, something which the RBA seems quite happy about. As Glenn Stevens said in his opening remarks to the House of Representatives Standing Committee on Economics last year “The returns to savers for holding safe assets have commensurately declined, and this has clearly prompted substitution towards other assets, including equities and dwellings”.

Our survey suggests that households who are in savings mode will continue to save, and actually lower interest may well encourage even greater saving. Low interest rates are not a path to stimulate spending in the current environment for many.

Finally, I think we see significant inter-generational issues in play. Some say it has always been this way, but the relative wealth distribution seems more skewed in 2014, thanks to rising property values, significant savings by some, and significant borrowing by others.


IMF Lowers Global Growth Forecasts by 0.3%

Even with the sharp oil price decline—a net positive for global growth—the world economic outlook is still subdued, weighed down by underlying weakness elsewhere, says the IMF’s latest WEO Update.

Global growth is forecast to rise moderately in 2015–16, from 3.3 percent in 2014 to 3.5 percent in 2015 and 3.7 percent in 2016 (see table), revised down by 0.3 percent for both years relative to the October 2014 World Economic Outlook (WEO).

Recent developments, affecting different countries in different ways, have shaped the global economy since the release of the October WEO, the report says. New factors supporting growth—lower oil prices, but also depreciation of euro and yen—are more than offset by persistent negative forces, including the lingering legacies of the crisis and lower potential growth in many countries.

“At the country level, the cross currents make for a complicated picture,” says Olivier Blanchard, IMF Economic Counsellor and Director of Research. “It means good news for oil importers, bad news for oil exporters. Good news for commodity importers, bad news for exporters. Continuing struggles for the countries which show scars of the crisis, and not so for others. Good news for countries more linked to the euro and the yen, bad news for those more linked to the dollar.”

Cross currents in global economy

In advanced economies, growth is projected to rise to 2.4 percent in both 2015 and 2016. Within this broadly unchanged outlook, however, is the increasing divergence between the United States, on the one hand, and the euro area and Japan, on the other.

For 2015, the U.S. economic growth has been revised up to 3.6 percent, largely due to more robust private domestic demand. Cheaper oil is boosting real incomes and consumer sentiment, and there is continued support from accommodative monetary policy, despite the projected gradual rise in interest rates. In contrast, weaker investment prospects weigh on the euro area growth outlook, which has been revised down to 1.2 percent, despite the support from lower oil prices, further monetary policy easing, a more neutral fiscal policy stance, and the recent euro depreciation. In Japan, where the economy fell into technical recession in the third quarter of 2014, growth has been revised down to 0.6 percent. Policy responses, together with the oil price boost and yen depreciation, are expected to strengthen growth in 2015–16.

In emerging market and developing economies, growth is projected to remain broadly stable at 4.3 percent in 2015 and to increase to 4.7 percent in 2016—a weaker pace than forecast in the October 2014 WEO. Three main factors explain this downward shift.

• First, the growth forecast for China, where investment growth has slowed and is expected to moderate further, has been marked down to below 7 percent. The authorities are now expected to put greater weight on reducing vulnerabilities from recent rapid credit and investment growth and hence the forecast assumes less of a policy response to the underlying moderation. This lower growth, however, is affecting the rest of Asia.

• Second, Russia’s economic outlook is much weaker, with growth forecast downgraded to –3.0 percent for 2015, as a result of the economic impact of sharply lower oil prices and increased geopolitical tensions.

• Third, in many emerging and developing economies, the projected rebound in growth for commodity exporters is weaker or delayed compared with the October 2014 WEO projections, as the impact of lower oil and other commodity prices on the terms of trade and real incomes is taking a heavier toll on medium-term growth. For many oil importers, the boost from lower oil prices is less than in advanced economies, as more of the related windfall gains accrue to governments (for example, in the form of lower energy subsidies).

Risks to recovery

The distribution of risks to global growth is more balanced than in October, notes the WEO Update. On the upside, lower oil prices could provide a greater boost than assumed. Other risks that could adversely affect the outlook involve the possible shifts in sentiment and volatility in global financial markets, especially in emerging market economies. The exposure to these risks, however, has shifted among emerging market economies with the sharp fall in oil prices. It has risen in oil exporters, where external and balance sheet vulnerabilities have increased, while it has declined in oil importers, for whom the windfall has provided increased buffers.

Policy priorities

The weaker global growth forecast for 2015–16 underscores the need to raise actual and potential growth in most economies, emphasizes the WEO Update. This means a decisive push for structural reforms in all countries, even as macroeconomic policy priorities differ.

In most advanced economies, the boost to demand from lower oil prices is welcome. It will also lower inflation, however, which may contribute to a further decline in inflation expectations, increasing the risk of deflation. Monetary policy must then stay accommodative to prevent real interest rates from rising, including through other means if policy rates cannot be reduced further. In some economies, there is a strong case for increasing infrastructure investment.

In many emerging market economies, macroeconomic policy space to support growth remains limited. But lower oil prices can alleviate inflation pressure and external vulnerabilities, giving room to central banks to delay raising policy interest rates.

Oil exporters, for which oil receipts typically contribute a sizable share of fiscal revenues, are experiencing larger shocks in proportion to their economies. Those that have accumulated substantial funds from past higher prices can let fiscal deficits increase and draw on these funds to allow for a more gradual adjustment of public spending to the lower prices. Others can resort to allowing substantial exchange rate depreciation to cushion the impact of the shock on their economies.

Lower oil prices also offer an opportunity to reform energy subsidies and taxes in both oil exporters and importers. In oil importers, the saving from the removal of general energy subsidies should be used toward more targeted transfers to protect the poor, lower budget deficits where relevant, and increase public infrastructure if conditions are right.

All of Australia’s Five Major Metropolitan Areas Were Severely Unaffordable – Demographia

The latest housing affordability survey from Demographia has been released. Using data from Q3 2014, they conclude that in Australia, for the 11th year in a row all of Australia’s five major metropolitan areas were severely unaffordable. The latest survey also highlights the divergent trends in Australia’s main urban centres, and other parts of the county. This authoritative report adds further weight to the evidence that the property market is broken.

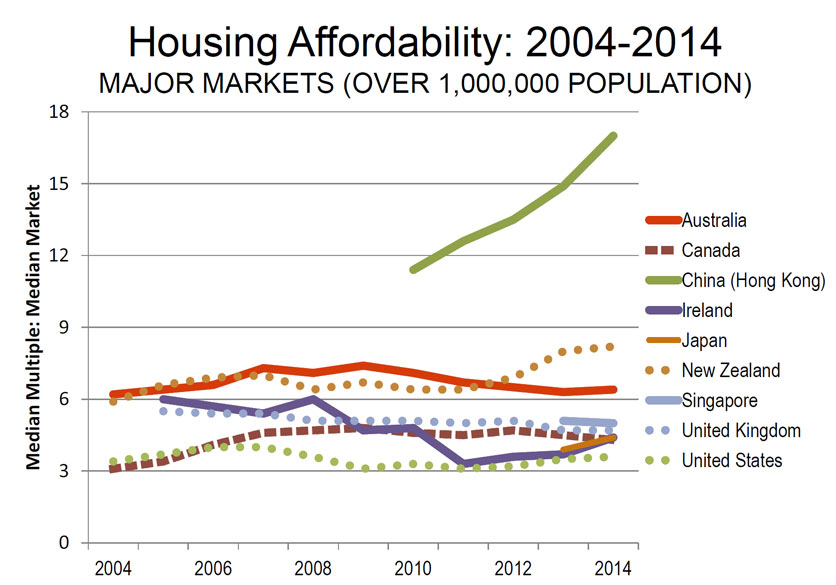
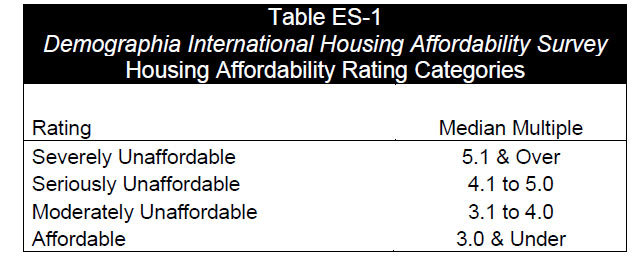
By way of background, the 11th Annual Demographia International Housing Affordability Survey covers 378 metropolitan markets in nine countries (Australia, Canada, China, Ireland, Japan, New Zealand, Singapore, the United Kingdom and the United States). A total of 86 major metropolitan markets — with more than 1,000,000 population — are included, including five of the six largest metropolitan areas in the high income world (Tokyo-Yokohama, New York, Osaka-Kobe-Kyoto, Los Angeles, and London). The Demographia International Housing Affordability Survey rates housing affordability using the “Median Multiple.” The Median Multiple is widely used for evaluating urban markets, and has been recommended by the World Bank and the United Nations and is used by the Joint Center for Housing Studies, Harvard University. Historically, the Median Multiple has been remarkably similar in Australia, Canada, Ireland, New Zealand, the United Kingdom and the United States, with median house prices from 2.0 to 3.0 times median household incomes. However, in recent decades, house prices have been decoupled from this relationship in a number of markets, such as Vancouver, Sydney, San Francisco, London, Auckland and others. Without exception, these markets have severe land use restrictions (typically “urban containment” policies) that have been associated with higher land prices and in consequence higher house prices (as basic economics would indicate, other things being equal). Here is the rating scale the report uses.

Demographia-Ratings-2015The most affordable major metropolitan markets in 2014 were in the United States, which had a moderately unaffordable rating of 3.6. Canada and Ireland were rated “seriously unaffordable,” with a Median Multiple of 4.3, along with Japan (4.4), the United Kingdom (4.7) and Singapore (5.0). Australia (6.4), New Zealand (8.2) and Hong Kong (17.0) were severely unaffordable.

Demographia-2015-SummaryThe most affordable major metropolitan markets were in the United States, with 14 markets rated as “affordable.” Hong Kong’s Median Multiple of 17.0 was the highest recorded (least affordable) in the 11 years of the Demographia International Housing Affordability Survey. Again, Vancouver was second only to Hong Kong, with a Median Multiple of 10.6. Housing affordability in Sydney deteriorated to a Median Multiple of 9.8, which was followed by San Francisco and San Jose (each 9.2). Melbourne had a Median Multiple of 8.7 and London (Greater London Authority) 8.5. Three other markets had Median Multiples of 8.0 or above, including San Diego (8.3), Auckland (8.2) and Los Angeles (8.0). At a more detailed level, Australia had 33 severely unaffordable markets, followed by the United States with 25 and the United Kingdom with 16.

Demographia-2015-OZ-SummaryAmong the major metropolitan area markets the overall Median Multiple was 6.5. The least affordable market was Sydney, with a Median Multiple of 9.8. This is a substantial increase from last year’s 9.0. This makes Sydney the third least affordable out of the 86 major markets rated in this Survey. Housing affordability also deteriorated in Melbourne, rising to a Median Multiple of 8.7 in 2014 from 8.3 in 2013. Melbourne ranked 6th least affordable of the 86 major markets. Housing affordability deteriorated slightly in Adelaide (from 6.3 to 6.4), Perth (from 6.0 to 6.1) and Brisbane (from 5.8 to 6.0).

Among all markets, Australia’s Median Multiple remained severely unaffordable, at 5.5. After major market Sydney (9.8), Tweed Heads (Queensland) was the least affordable, with a Median Multiple of 9.1. Queensland’s Sunshine Coast ranked third least affordable with a median multiple of 8.3 (following Melbourne, which ranked fourth among all markets in Australia). The fifth least affordable market in Australia was Port Macquarie, with a median multiple of 8.2. There were signs of considerable improvement, however, among the smaller markets of Australia. Gladstone (QLD) achieved a moderately unaffordable rating, with a median multiple of 3.9. Townsville (QLD) and Latrobe (VIC) tied for fourth most affordable market, with a seriously unaffordable Median Multiple of 4.3. For the first time in the 11 years of the Demographia International Housing Affordability Survey, Australia had markets that were rated as affordable. The most affordable market was Karratha, in Western Australia’s Pilbara, with a median multiple of 2.6. Kalgoorlie, also in Western Australia was the second most affordable market, with a median multiple of 2.8. These improvements appear related to resource industry related demand decreases.