Australians Trading Fixed For Mobile Broadband

According to the latest OECD data, published today, whilst we are lagging behind other developed OECD countries in fixed broadband, we rank third in the world for wireless broadband behind Finland and Japan. Some Australians have more than one wireless service and mobile growth is significantly higher than fibre.

Using June 2014 data, Australia ranked 20 out of 34 OECD countries based on the number of fixed broadband connections for 100 inhabitants, behind nations including Switzerland, UK Korea, New Zealand and Japan. Total penetration was around 27 per cent. About 81 per cent of connections were via DSL, 15 per cent and 3 per cent fibre. Our fibre rates are lower than the 17% OECD average.  OECDFixedBroadbandFeb2015
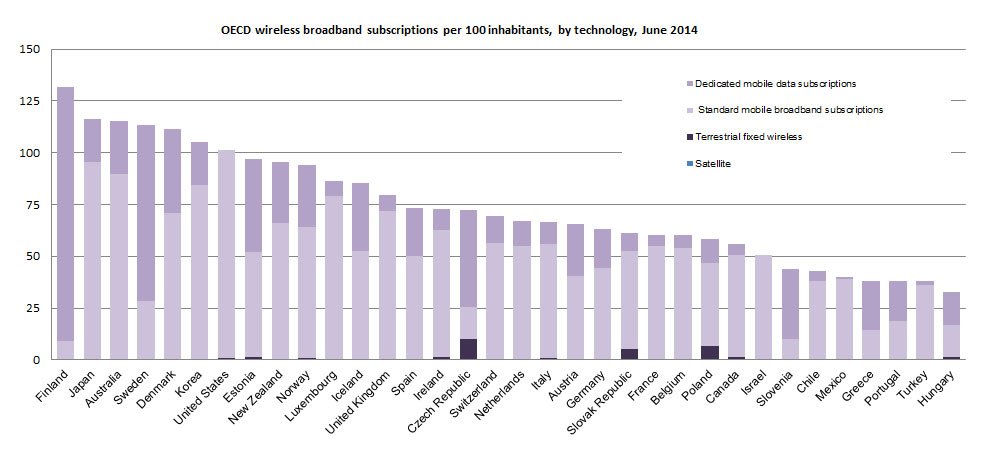
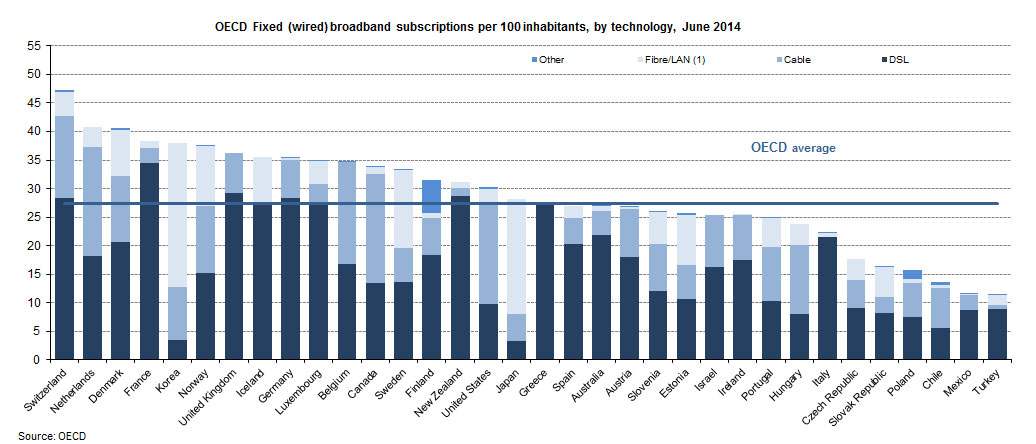
Mobile broadband penetration has risen to 78.2% in the OECD area, making more than three wireless subscriptions for every four inhabitants, according to data for June 2014 released today.

OECDMobileBroadbandFeb2015

Mobile broadband subscriptions in the 34-country area were up 11.9% from a year earlier to a total of 983 million, driven by growing use of smartphones and tablets.

Seven countries (Finland, Japan, Australia, Sweden, Denmark, Korea and the United States as ranked in descending order of mobile broadband subscriptions) lie above the 100% penetration threshold.

Fixed broadband subscriptions in the OECD area reached 344.6 million as of June 2014, up from 332 million in June 2013 and making an average penetration of 27.4%. Switzerland, the Netherlands and Denmark remained at the top of the table with 47.3%, 40.8% and 40.6% respectively.

DSL remains the prevalent technology, making up 51.5% of fixed broadband subscriptions, but it continues to be gradually replaced by fibre, now at 17% of subscriptions. Cable (31.4%) accounted for most of the remaining subscriptions.

Annual growth of above 100% in fibre take-up was achieved in OECD economies with low to average ratio of fibre to total fixed broadband levels such as New Zealand, Luxembourg, Chile and Spain. Japan and Korea remain the OECD leaders, with fibre making up 71.5% and 66.3% of fixed broadband connections.

Full details are available from the OECD Broadband portal.

Treasury Consultation on Resolution Regime for Financial Market Infrastructure (FMI’s)

The Treasure today announced further consultation on a proposed resolution regime for financial markets infrastructure (FMI’s).   Australia was one of sixteen jurisdictions which has no administrative authority responsible for resolution of FMIs. FMIs are defined as multilateral systems used to clear, settle and record financial transactions. They are an essential element enabling financial markets to work smoothly.

  • Clearing is a post-trade and pre-settlement function performed by financial market participants to manage trades and associated exposures. Through the legal process of novation, a central counterparty (CCP) interposes itself between counterparties to transactions executed in the markets it serves, becoming principal to each transaction so as to ensure performance of obligations.
  • Settlement is the point at which the counterparty exposures associated with a transaction are eliminated. In securities markets, settlement is facilitated by securities settlement facilities (SSFs).
  • TRs are facilities that centrally collect and maintain records on over-the-counter (OTC) derivatives transactions and positions for the purpose of making those records available to regulators and, to an appropriate extent, the public.

Internationally, the Financial Stability Board (FSB), the Committee on Payments and Market Infrastructures (CPMI, formerly the Committee on Payment and Settlement Systems (CPSS)) and the International Organization of Securities Commissions (IOSCO) have progressed work on international guidance for FMI recovery and resolution. The FSB adopted the Key Attributes of Effective Resolution Regimes for Financial Institutions (the KAs) in October 2011, and the G20 Leaders endorsed these KAs in November 2011. The FSB subsequently added guidance for applying the KAs to FMIs (the FMI Annex to the KAs) in October 2014. Together, the KAs and the FMI Annex to the KAs identify the powers and limits of a resolution framework for financial institutions, including FMIs. CPMI and IOSCO also published guidance on the development of recovery plans for FMIs in October 2014. The guidance provided in these documents extends to CS facilities and TRs, but not financial markets. The FSB is monitoring jurisdictions’ progress in implementing the KAs, including in respect of FMIs, through a series of peer reviews. The first such review was published in April 2013 and noted that resolution regimes for FMIs were generally less developed than corresponding regimes for banks. Australia was one of sixteen jurisdictions identified in the report as having no administrative authority responsible for resolution of FMIs.

The Australian Government, acting on the advice of the Reserve Bank of Australia (RBA), the Australian Securities and Investments Commission (ASIC), the Australian Prudential Regulation Authority (APRA) (jointly, the Regulators) and the Australian Treasury — seeks stakeholder views on legislative proposals to establish a special resolution regime for clearing and settlement (CS) facilities and trade repositories (TRs), together referred to as financial market infrastructures (FMIs), consistent with international standards. Some of the legislative proposals in this paper relating to directions powers and international regulatory cooperation also extend to operators of domestically incorporated and licensed financial markets. Closing date for submissions is Friday, 27 March 2015.

Although robust risk management significantly reduces the likelihood of an FMI failure, the possibility of such failure is not entirely eliminated. With increasing dependence on centralised infrastructure, motivated in part by regulatory reforms, it is vital that the official sector clarifies how it would address a situation of FMI distress. The particular focus of this consultation paper is on resolution: actions taken by public authorities to either return an FMI to viability or facilitate its orderly wind-down. The associated concept of recovery refers to actions taken by a distressed FMI itself to return to viability. The powers proposed for the resolution authority in relation to FMIs are:

  • Statutory management. The power to appoint an individual, company or the resolution authority itself to temporarily administer a distressed FMI in a manner consistent with the objectives of the resolution regime. The statutory manager would assume the powers of the FMI’s board, including carrying out recovery measures and other actions in accordance with the FMI’s rulebook. The exercise of powers by the statutory manager would be overseen by the resolution authority.
  • Moratorium on payments to general creditors. The power to suspend an FMI’s payment obligations to general creditors. This would exclude payments made in relation to core FMI activities (such as margin payments and settlement of securities transactions).
  • Transfer of operations to a third-party or bridge institution. The power to compulsorily transfer all or part of an FMI’s operations to a willing third-party purchaser, or a temporary bridge institution established by public authorities. A transfer to the latter would be intended as an interim step towards a return to private sector ownership under new governance arrangements.
  • Temporary stay on early termination rights. The power to impose a temporary stay of up to 48 hours on termination rights (with respect to future obligations) that may be triggered solely by an FMI’s entry into resolution. It is also expected that FMIs would ensure that such termination rights were not included in their rules or contracts with critical third-party suppliers.

The powers available to the resolution authority have the potential to significantly impact participants and other stakeholders that have dealings with FMIs. The legislative proposals provide a right to compensation from the Commonwealth should participants or other stakeholders be left worse off in resolution than they would have been had the FMI entered general insolvency. The proposals also include an immunity from liability for the resolution authority, statutory manager and others acting in compliance with the directions of the resolution authority. It is envisaged that in some resolution scenarios, there could be a need to draw on public funds to provide temporary liquidity, to ensure the timely disbursement of operating expenses, or in some extreme cases to meet a small shortfall required to complete an FMI’s closeout processes. In each of these cases the Government would seek to recover any expenditure from participants and shareholders of the FMI.

Mortgage Securitisation On The Rise

The ABS today released the data for Australian Securitisers to December 2014. We see two interesting points, first the value of mortgages being securitised has risen (up 4.8%), and second, a greater share are being purchased by Australian investors (all but 7.2%). We discussed recently the rise on securitisation, and the implications. We know the securitised mortgage pools have been securitised by both the banking sector, and non-banking sector. Investors who buy mortgage back securitised paper are of course leveraged into housing at a second order level.

At 31 December 2014, total assets of Australian securitisers were $136.5b, up $4.8b (3.6%) on 30 September 2014.

SecuritisersAssetsDec2014During the December quarter 2014, the rise in total assets was due to an increase in residential mortgage assets (up $5.2b, 4.9%) and cash and deposits (up $0.3b, 7.1%). This was partially offset by decreases in other loans (down $0.6b, 3.9%).

Residential and non-residential mortgage assets, which accounted for 83.0% of total assets, were $113.3b at 31 December 2014, an increase of $5.2b (4.8%) during the quarter.

At 31 December 2014, total liabilities of Australian securitisers were $136.5b, up $4.8b (3.6%) on 30 September 2014. The rise in total liabilities was due to the increase in long term asset backed securities issued in Australia (up $4.3b, 4.3%) and loans and placements (up $3.0b, 18.4%). This was partially offset by a decrease in short term asset backed securities issued in Australia (down $1.5b, 33.0%) and asset backed securities issued overseas (down $1.1b, 10.4%).

SecuritiserLiabilitiesDec2014At 31 December 2014, asset backed securities issued overseas as a proportion of total liabilities decreased to 7.2%, down 1.1% on the September quarter 2014 percentage of 8.3%. Asset backed securities issued in Australia as a proportion of total liabilities decreased to 77.5%, down 0.7% on the September quarter 2014 percentage of 78.2%.

Note the ABS says revisions have been made to the original series as a result of improved reporting of survey data. These revisions have impacted the assets and liabilities reported as at 30 September 2014 and 30 June 2014.

AMP Lifts Profit 32%

AMP Limited has reported a net profit of A$884 million for the full year to 31 December 2014,, up 32 per cent on A$672 million reported for FY 13. In response AMP’s share price rose to a five year high. Their banking division has grown on the back of a 9% rise in mortgage lending.

Underlying profit was A$1,045 million compared with A$849 million for FY 13, up 23 per cent year on year, driven by double digit growth in operating earnings across all contemporary businesses.

AMP-ProfitThe Board has declared a 17 per cent increase to the final dividend to 13.5 cents per share compared with 11.5 cents per share for the 2013 final dividend. This represents a FY 14 payout ratio of 74 per cent of underlying profit and is within AMP’s target range of paying 70 to 80 per cent of underlying profit.

The group cost to income ratio was managed tightly to 44.8 per cent for FY 14, down from 49.4 per cent in FY 13. Controllable costs increased 1.1 per cent and are tracking in line with guidance having been impacted positively by the business efficiency program.

Australian wealth management net cashflows were A$2.3 billion in FY 14, up A$115 million on net cashflows of A$2.2 billion in FY 13. AUM rose 9 per cent over the year to $109.5 billion, against a relatively flat Australian market. Total net cashflows on AMP platforms continue to perform strongly, growing 35 per cent to A$3.6 billion in FY 14.  AMP Capital external net cashflows were A$3.7 billion, a A$4.8 billion improvement from net cash outflows of A$1,039 million in FY 13.

Underlying return on equity: Increased to 12.7 per cent in FY 14 from 10.7 per cent in FY 13, reflecting the 23 per cent increase in underlying profit.

In Australian wealth management, operating earnings for FY 14 were up 13 per cent compared with FY 13, reflecting higher net cashflows supporting good growth in AUM and disciplined cost control in a growing business.

Australian wealth protection has recovered well with operating earnings of A$188 million compared with A$64 million in 2013.

AMP Capital’s improved performance: Operating earnings increased 16 per cent reflecting strong fee growth and investment returns. The internationalisation of the business drove this with global investors attracted by leading infrastructure and property capabilities alongside new inflows generated by the China Life AMP Asset Management joint venture and improved flows from the MUTB alliance. The cost to income ratio of 63 per cent was within AMP Capital’s target range of 60 to 65 per cent.

Seventh quarter of more than A$1 billion net cashflows on North platform: Net cashflows improved 34 per cent to A$5.5 billion for FY 14 and North AUM grew 66 per cent to A$16 billion since December 2013. North also had 50 per cent growth in customers with a total of over 76,000 customers on the platform in 2014.

AMP Bank: The bank delivered A$91 million in operating earnings, up 10 per cent compared with FY 13, reflecting an increase in residential mortgages with AMP growing above system in an intensely competitive environment and AMP aligned advisers contributing a quarter of new business. Total revenue increased 12% in FY 14 on FY 13, driven mainly by growth in the loan portfolio and improved net interest margin.

AMP Bank maintained a competitive lending position, with the total loan book growing by A$1,169m to A$14.5b in FY 14, an increase of 8.8% on FY 13. Residential mortgage competition remained intense in the period, with continued market-wide discounting. AMP Bank’s focus on pricing enhancements and productivity from key channels, contributed to deliver above system residential mortgage book growth of A$1,117m (9%) in FY 14 to A$14.0b. Strong growth was delivered through both the broker and AMP aligned adviser channels. The AMP aligned adviser channel now contributes 25% of AMP Bank’s mortgage new business, up from 19% in FY 13.Owner occupied loans made up 62% of the mortgage portfolio at 31 December 2014, while investment property loans were 38%

Customer deposits increased over FY 14 by A$0.5b (6%) to A$9.2b. The deposit growth was primarily driven by AMP Bank’s Notice Saver Account and the North Platform, offset by a reduction in both term deposits and deposits sourced from financial institutions. Customer deposit to loan ratio was 64% for FY 14, compared with 66% for FY 13

Net interest margin was 1.41% for FY 14, up 2 bps from FY 13 and up 6 bps from 1H 14, aided by improved cost of wholesale funding during the period, targeted use of discounting and enhanced liquidity managemen. AMP Bank’s credit policy remains conservative and has not been relaxed to achieve growth. Asset quality remains strong, with mortgages in arrears (90+ days) at 0.42% as at December 2014 (0.37% as at December 2013). Loan impairment expense to gross loans and advances was 0.01% in FY 14.

AMP Bank’s variable costs increased by A$9m (18%) in FY 14, largely attributable to higher commission payments, mortgage acquisition and securitisation financing costs. AMP Bank’s controllable costs increased A$6m (12%) to A$56m in FY 14, from A$50m in FY 13, due to investments in technology, product development and operating capability to support the growth in lending and improvements to customer service levels. AMP Bank’s cost base will continue to rise as it invests to support growth. The cost to income ratio increased by 0.7 percentage points to 30.3% in FY 14 from 29.6% in FY 13.

The Capital Adequacy Ratio (CAR) was 12.2% at FY 14, (11.8% at FY 13). The Common Equity Tier 1 Capital Ratio at FY 14 was 9.3% (8.7% at FY 13). Both ratios remain well above APRA and internal thresholds. AMP Bank is building its capital holdings to ensure compliance with Basel III capital requirements upon implementation in 2016

New Zealand achieved improved cashflows: Operating earnings of A$110 million, up 13 per cent compared with FY 13, reflecting growth in profit margins, experience profits and favourable currency movements.

Future of advice strategy: A package of measures to lift the quality of advice is being introduced along with a new approach to advice being piloted in five locations. AMP is also investing in services, platforms and digital capabilities to improve adviser quality and productivity. Australian adviser numbers are up slightly at 3,844 in a period of regulatory uncertainty.

AMP continues to hold an appropriate capital surplus, with A$2.0 billion capital above minimum regulatory requirements at 31 December 2014, down from A$2.1 billion at 31 December 2013. The decrease was driven by the redemption of AMP Notes and the impact of falling bond yields, partially offset by retained profits and other capital impacts.

Super Now Worth $1.93 Trillion

The Australian Prudential Regulation Authority (APRA) today released its December 2014 Quarterly Superannuation Performance publication and December 2014 Quarterly MySuper Statistics report. At 31 December 2014, total assets, which include the assets of self-managed superannuation funds and the balance of life office statutory funds, rose to $1.93 trillion, an increase of 9.3 per cent from the December 2013 quarter.

Contributions to funds with more than four members over the December 2014 quarter were $26.1 billion, up 15.3 per cent from the December 2013 quarter ($22.7 billion).  Total contributions for the year ending December 2014 were $100.6 billion.

There were $15.2 billion in total benefit payments in the December 2014 quarter, an increase of 9.4 per cent from the December 2013 quarter ($13.9 billion).  Total benefit payments for the year ending December 2014 were $56.4 billion.

Net contribution flows (contributions plus net rollovers less benefit payments) totalled $10 billion in the December 2014 quarter, an increase of 14.9 per cent from the December 2013 quarter ($8.7 billion).  Net contribution flows for the year ending December 2014 were $39.4 billion.

APRA has revised the method of segmentation it uses for these reports.  The segments that APRA most commonly uses for superannuation are fund types. These fund types comprise corporate funds, industry funds, public sector funds, retail funds and small superannuation funds. These segments, based on RSE licensee profit status and the membership base of the funds. These segments, based on RSE licensee profit status and the membership base of the funds, are shown below.

APRA-SuperFund-Segmentation-Dec-2014Corporate funds are RSEs with more than four members under the trusteeship of a ‘not for profit’ RSE licensee and with a corporate membership basis.
Industry funds are RSEs with more than four members under the trusteeship of a ‘not for profit’ RSE licensee and with either an industry or general membership base.
Public sector funds are RSEs with more than four members under the trusteeship of a ‘not for profit’ RSE licensee and with a government base membership base. Public sector funds also include superannuation schemes established by a Commonwealth, State or Territory law (known as exempt public sector superannuation schemes).
Retail funds are RSEs with more than four members under the trusteeship of a ‘for profit’ RSE licensee with a corporate, industry or general membership basis.
Small funds are superannuation entities with fewer than five members and include small APRA funds (SAFs), single-member approved deposit funds and self-managed superannuation funds (SMSFs). SMSFs are regulated by the ATO and have different legislative requirements than APRA regulated funds.

Of the 258 entities in existence at 31 December 2014, there are 45 cases where the fund type is different under the new segmentation methodology. In these cases, APRA analysed the information reported to APRA, the structure of the fund and composition of the RSE licensee as well as other prudential information. APRA also drew on publicly available information and consulted RSE licensees in the cases where the information reported on SRF 001.0 was inconsistent. Following this further analysis, of the 45 entities:

  • 38 entities were re-classified from corporate to retail;
  • four entities were re-classified from industry to retail;
  • one entity was re-classified from retail to industry;
  • one entity was re-classified from corporate to public sector; and
  • one entity was re-classified from industry to public sector.

After the review of fund types, retail funds’ assets increased from $502 billion to $516 billion and account for 39 per cent of total superannuation assets as at 31 December 2014. Industry funds’ assets decreased by $15 billion from $418 billion to $403 billion and account for 31 per cent of total superannuation assets as at 31 December 2014. Public sector funds’ assets increased by $15 billion to $335 billion (to 26 per cent of total superannuation assets), while corporate funds’ assets decreased from $63 billion to $58 billion (to four per cent of total superannuation assets).


Residential Land Prices Rise Again

The latest HIA-RP Data Residential Land Report provided by the Housing Industry Association, and CoreLogic RP Data, show that acute supply bottlenecks continue to affect Australia’s residential land market. Land prices reached an all-time high in both the capital city and regional markets.

Turnover in the national land market declined by some 16.7 per cent during the September 2014 quarter. At the same time, price growth accelerated to 3.3 per cent over the quarter.

During the September 2014 quarter the weighted median price of residential land rose by 3.3 per cent to $212,727 per lot. This represents an all-time high for land prices nationally. Capital city land prices saw growth of 4.7 per cent during the quarter, and were 10.0 per cent higher than twelve months earlier, however some of this was due to an increase in the size of land lots transacted. In regional Australia, land prices rose by 0.7 per cent during the quarter and were 3.5 per cent higher compared with a year earlier.

The supply and price issues flow directly into helping to drive house prices higher.

What’s Up With Economic Growth?

What’s up with Economic growth? According to Andrew G Haldane, Chief Economist, Bank of England in  a recent speech, since the financial crisis, global growth has under-performed. In the decade prior to it, advanced economy growth averaged 3% per year. In the period since, it has averaged just 1%. The world has grown fast, then slow. That has led some to fear “secular stagnation” – a lengthy period of sub-par growth. The self-same concerns were voiced at the time of the Great Depression in the 1930s. The economic jury is still out on whether recent rates of growth are a temporary post-crisis dip or a longer-lasting valley in our economic fortunes. Pessimists point to high levels of debt and inequality, worsening demographics and stagnating levels of educational attainment. Optimists appeal to a new industrial revolution in digital technology. Given its importance to living standards, this debate is one of the key issues of our time.

“Today’s great debate is where next for growth. The sunny uplands of innovation-led growth, as after the Industrial Revolution? Or the foggy lowlands of stagnant growth, as before it? Which of the secular forces – innovation versus stagnation – will dominate? And if growth is going back to the future, on which side of the Industrial Revolution will it land?

The balance of these arguments matters greatly for future well-being and public policy. Indeed, it is hard to think of anything that matters much more. More parochially, for central banks setting monetary policy one of the key judgements is the appropriate “neutral” level of interest rates. You can think of this as the interest rate that would align desired saving and investment over the medium term.

But what is the “neutral” level of interest rates today? Secular innovation might imply a level at or above its historical average of 2-3%, in line with historical growth rates. But secular stagnation may imply a level much lower than in the past, possibly even negative. In monetary policy, this is the difference between chalk and cheese, success and failure.

One interpretation is society having become significantly more patient, as in the lead up to the Industrial Revolution: higher global saving relative to investment would lower global real interest rates. If that is the cause, bring out the bunting. By lowering the cost, and raising the return to innovation, investment and growth would be stimulated. Falls in real rates would signal secular innovation. The optimists would have it.

But an alternative reading is possible. Low real rates may instead reflect a dearth of profitable investment opportunities relative to desired savings. If that is the cause, bring out the bodies. For this would imply low returns to innovation and low future growth. Falling real rates would instead signal secular stagnation. The pessimists would have it.

And looking ahead, it is possible that sociological headwind could strengthen. One of the causes of rising inequality in advanced economies is believed to be the loss of middle-skill jobs, at least relative to high and low-skill jobs. There has been a “hollowing out” in employment. Technological advance – the mechanisation of middle-skill tasks – is believed to have contributed importantly to these trends.

A second secular headwind, closely related to rising inequality, concerns human capital. Inequality may retard growth because it damps investment in education, in particular by poorer households. Studies show parental income is crucial in determining children’s educational performance. If inequality is generational and self-perpetuating, so too will be its impact on growth.

Growth is a gift. Yet contrary to popular perceptions, it has not always kept on giving. Despite centuries of experience, the raw ingredients of growth remain something of a mystery. As best we can tell historically, they have been a complex mix of the sociological and the technological, typically acting in harmony. All three of the industrial revolutions since 1750 bear these hallmarks.

Today, the growth picture is foggier. We have fear about secular stagnation at the same time as cheer about secular innovation. The technological tailwinds to growth are strong, but so too are the sociological headwinds. Buffeted by these cross-winds, future growth risks becoming suspended between the mundane and the miraculous.


RBA Outsources Macroprudential to APRA

In the Monetary Policy Meeting of the Reserve Bank Board minutes, released today, there is significant emphasis on the role of APRA to regulate the housing market. The economic data suggested continued easing in momentum, and the rate reduction was line ball, between cutting straight away or leaving it a month. Nothing about future intentions.

Financial Markets

Members commenced their discussion of financial markets with the observation that central bank policy actions, along with developments in Greece, had been the main focus of markets over the past two months.

Members were briefed about the announcement by the European Central Bank (ECB) of a large sovereign bond purchase program in January, following its assessment that its existing measures would not be sufficient to prevent inflation from remaining well below 2 per cent for a prolonged period. Starting in March, the ECB plans to purchase €60 billion of securities each month, well above the current rate of purchases of private securities; sovereign bonds would be bought in proportion to member countries’ contributions to the ECB’s capital. Debt purchases would continue until there was a sustained increase in inflation, but they would end no earlier than September 2016. This would increase the size of the ECB’s balance sheet past its 2012 peak of €3.1 trillion. While less than the US Federal Reserve’s maximum purchases of US$85 billion a month, on an annualised basis the ECB’s purchases would be equivalent to around 7½ per cent of the euro area’s annual GDP, compared with 6 per cent of US GDP for purchases by the Federal Reserve (and 16 per cent of Japanese GDP for purchases by the Bank of Japan).

Members noted that the Federal Reserve continued to indicate that it expected to start increasing its policy rate around the middle of this year, but financial markets had pushed back expectations for the first rate rise in the United States to around the end of the year. A number of central banks had eased policy in recent months in response to the effect of lower oil prices, including the Reserve Bank of India and the Bank of Canada. Markets had also pushed back expectations for policy tightening by a number of other central banks. In contrast, the central banks of Russia and Brazil had increased their policy rates.

The Swiss National Bank (SNB) abandoned its exchange rate ceiling against the euro, which had been in place since September 2011, and lowered the rate on bank deposits at the SNB by 50 basis points to −0.75 per cent. The SNB’s announcement noted that divergences between the monetary policies of the major currency areas had increased significantly. The move surprised markets, resulting in considerable market volatility and the bankruptcy of several foreign exchange brokers.

Members noted that sovereign bond yields in the major markets had fallen significantly since the December meeting. The falls had occurred across the yield curve but were particularly pronounced at longer maturities, with yields on 10-year bonds in the United States falling back to around 1.6 per cent and those in Germany and Japan reaching historic lows of 30 and 20 basis points, respectively. At these levels there was very little, if any, compensation for term risk. For maturities up to five years, yields on bonds issued by Japan, Germany and most of the core euro area economies, as well as Sweden and Switzerland, had fallen below zero. Yields on Australian government bonds had mostly tracked global developments and had also fallen considerably, with the 10-year yield declining to a historical low below 2½ per cent.

The declines in global bond yields reflected a number of factors but the extent of the decline in yields was difficult to explain. The large bond purchases by major central banks had clearly contributed but so too had a reduction in bond supply, reflecting a narrowing of fiscal deficits in a number of countries. Concerns about the global growth outlook and the risk of sustained low inflation following falls in the oil price had also played a role.

Members noted that the Greek authorities had indicated that they planned to restructure the country’s debt, most of which was owed to official sector institutions. Greece had nonetheless also indicated a desire to remain part of the euro area. The current European assistance program expired at the end of February and markets had been closed to Greece since the recent election. Members also noted that the critical issue in the near term was not so much the obligations of the Greek Government but rather the funding of Greek banks. To date, there had been minimal spillover from developments in Greece to other markets.

There had been sizeable movements in exchange rates since the December meeting, reflecting the increasingly divergent paths of monetary policy among the major advanced economies. Most notably, the Swiss franc had appreciated by around 15 per cent against the euro since mid January. While the US dollar had depreciated against the Swiss franc, it had also appreciated further against most other currencies since the December meeting (including by around 10 per cent against the euro). The renminbi had been little changed against the US dollar over much of 2014, but had depreciated somewhat since the December meeting.

The Australian dollar had depreciated by around 9 per cent against the US dollar since the December meeting. On a trade-weighted basis, the Australian dollar was around 4 per cent below its early 2014 levels, notwithstanding significant falls in commodity prices over the intervening period. The depreciation of the Australian dollar against the US dollar and renminbi had been partly offset by its appreciation against the yen and euro.

Equity prices in advanced economies had been broadly unchanged since early December, notwithstanding a strong rally in European share prices following the announcement of the expansion of the ECB asset purchase program. Global equity prices had risen moderately over 2014, led by an 11 per cent increase in US equity prices, while Chinese equities had significantly outperformed other emerging markets since mid 2014.

In Australia, equity prices recorded a smaller rise over 2014 than that recorded in most global markets, primarily reflecting the decline in equity prices of resource companies. Equity prices had increased by 4 per cent since the start of 2015 even though prices of resource companies had fallen further.

Members noted that Australian lending rates on the outstanding stock of housing and business loans had continued to edge down since the December meeting. At the time of the December meeting, financial market pricing had suggested some chance of an easing in policy during 2015. This expectation strengthened somewhat during January, and by the time of the February meeting pricing reflected a two-thirds probability of a 25 basis point reduction in the cash rate at that meeting, with the cash rate expected to be 2 per cent by the end of the year.

International Economic Conditions

Members noted that growth of Australia’s major trading partners had been around its long-run average in 2014 and that early indications suggested this pace had continued into 2015. Prices of a range of commodities, notably oil and iron ore, had fallen further in recent months, reflecting a combination of both lower growth in global demand for commodities and, more importantly, significant increases in supply. Members also noted that the lower oil prices, if sustained, would be positive for the growth of Australia’s trading partners, which are net importers of energy, and would continue to put downward pressure on global prices of goods and services. Very accommodative global financial conditions were also expected to support global growth in 2015. These positive effects on trading partner growth, however, were expected to be largely offset in 2015 by a gradual decline in the pace of growth in China.

In China, economic growth had eased a little but was close to the authorities’ target for 2014. Growth of household consumption had held up over 2014, while growth of investment and industrial production – which contribute significantly to the demand for commodities – had trended lower over the past year or so. Conditions in the residential property market had remained weak, and measures introduced to support the market appear to have had only a modest effect so far.

In Japan, economic activity had been weaker than expected since the increase in the consumption tax in April 2014, but growth appeared to have resumed in the December quarter and the labour market remained tight. However, inflation had declined in recent months and remained well below the Bank of Japan’s target. The pace of growth had slowed a little in the rest of east Asia over 2014; as the region as a whole is a net importer of oil, activity was likely to have been supported by the decline in oil prices.

Members observed that the US economy had continued to strengthen, resulting in output growing at an above-trend pace over the second half of 2014. Employment growth had picked up further and the unemployment rate had continued to decline. Ongoing strength in the labour market and lower gasoline prices had contributed to a sharp rise in consumer sentiment. On the other hand, growth in the euro area remained modest. Inflation had remained well below the ECB’s target and inflation expectations had declined further, prompting the ECB to implement additional stimulus measures.

Domestic Economic Conditions

Members noted that the data released since the December meeting suggested that the domestic economy had continued to grow at a below-trend pace over the second half of 2014. Resource exports appeared to have continued growing in the December quarter and growth was expected to remain strong, particularly as liquefied natural gas (LNG) production came on line over the next year or so. The lower exchange rate was expected to support growth of exports, particularly service exports such as education and tourism.

Activity and prices in the housing market had continued to be bolstered by the low level of lending rates and strong population growth. A range of indicators, including residential building approvals, suggested further growth of dwelling investment in the near term. Housing price inflation had moderated from the rapid rates seen in late 2013, but remained high and in Sydney and Melbourne had been well above the growth rate of household income. Growth of owner-occupier housing credit had remained around 6 per cent in year-ended terms, while investor credit had continued to grow at a noticeably faster rate.

Members were briefed on the main regulatory actions taken recently to address housing risks in the domestic economy. In particular, the Australian Prudential Regulation Authority (APRA) had announced several policy measures in early December to reinforce sound residential mortgage lending practices. These policies included clarification of prudential expectations on what constituted acceptable growth in housing lending to investors and the possible steps that would be considered if APRA’s expectations were not met, such as increased capital requirements.

Turning to the business sector, members noted that mining investment had continued to decline in the second half of 2014, and larger declines were expected over 2015 as existing projects were completed and very few new projects were likely to proceed. Non-mining business investment had remained subdued and recent data pointed to this continuing into the first half of 2015. Growth in public demand was expected to be subdued over the next year or so.

Members observed that household consumption growth had picked up since its lows in early 2013, supported by low interest rates and rising housing wealth. However, consumption growth had remained below average. The recent decline in fuel prices was expected to provide some offset for overall household incomes from weak growth in labour incomes.

Members noted that the most recent data on the labour market had been a little more positive than early in 2014. However, while employment growth had strengthened somewhat over the past year, the unemployment rate had increased further over 2014 and average hours worked had remained below the levels of a few years ago. Leading indicators of labour demand had changed little in recent months and pointed to only modest employment growth in the months ahead.

Consumer price inflation had declined in year-ended terms, partly as a result of a large fall in fuel prices in the December quarter and the effect of the repeal of the carbon price on utility prices in the September quarter. Various measures of underlying inflation, which largely abstract from these and other temporary factors, had declined in year-ended terms to around 2¼ per cent. Non-tradables inflation (excluding utility prices) had declined further in year-ended terms to relatively low levels, consistent with subdued domestic cost pressures. Prices of tradable items (excluding volatile items and tobacco) were little changed in the December quarter, but were expected to face upward pressure over time from the pass-through of the depreciation of the Australian dollar since early 2013.

Turning their discussion to the economic outlook, members noted that staff forecasts for output, which were conditioned on an assumption of no change in the cash rate, had been revised lower in the near term. Recent data indicated that the expected pick-up in consumption and non-mining business investment was likely to occur later than had been previously anticipated, while the pick-up in LNG exports over coming quarters was now likely to be less rapid. At the same time, it was anticipated that the net effect of commodity price changes and the exchange rate depreciation over the past three months would provide a positive impetus to domestic growth over the next year or so. Overall, the underlying forces driving growth remained much as they had been for some time and GDP growth was still expected to pick up gradually to an above-trend pace in the latter part of the forecast period.

The revisions to GDP growth implied that the unemployment rate would peak at a higher rate and later than had been previously forecast, before declining gradually. The inflation forecast had also been revised lower, reflecting the softer outlook for labour and product markets as well as the recent fall in oil prices. Headline inflation was expected to remain low for a time, before picking up at the end of the forecast period. Underlying inflation was expected to remain well contained and consistent with the target throughout the forecast period.

Members discussed a number of uncertainties around the forecasts. They noted that developments in commodity markets, particularly the price of oil, would affect future global growth and inflation outcomes. One area of uncertainty continued to be the outlook for the Chinese property market and its implications for Chinese demand for commodities. Members also noted that developments in commodity markets were likely to be affected by supply factors; for instance, the response of ‘unconventional’ oil producers in North America to lower oil prices.

As usual, the path of the exchange rate remained a key area of uncertainty. Members noted that the exchange rate had remained above most estimates of its fundamental value, given the decline in commodity prices over the past year, and that future exchange rate movements would be affected by market expectations for monetary policy, both domestically and abroad. They noted that, all else being equal, a sustained further depreciation would, if it occurred, stimulate growth in the domestic economy and put some temporary upward pressure on inflation.

Members noted that there was considerable uncertainty around the timing and extent of the expected increase in household consumption growth and non-mining business investment. Although fundamental factors such as low interest rates and strong population growth remained in place, they had not been sufficient to see a significant pick-up in the growth of these variables or a decline in the degree of spare capacity in the labour market. In addition, recent data suggested that the expected improvement in economic conditions would occur later than had been previously expected. Members commented that a strengthening in non-mining investment was a necessary element for growth to pick up to an above-trend pace, and noted the importance of confidence in underpinning such an outcome. Indeed, an improvement in the appetite for businesses to take on risk had the potential, should it occur, to lead to much stronger growth in non-mining business investment than currently forecast.

Considerations for Monetary Policy

In assessing the appropriate stance for monetary policy in Australia, members noted that the outlook for global economic growth was little changed, with Australia’s major trading partners still forecast to grow by around the pace of recent years in 2015. Commodity prices, particularly those for iron ore and oil, had declined over the past year largely in response to expansions in global supply, though members judged that demand-side factors, such as the weakness in Chinese property markets, had also played some role. Conditions in global financial markets had remained very accommodative.

Domestically, over recent months there had been fewer indications of a near-term strengthening in growth than previous forecasts would have implied. This included survey measures of household and business confidence, which remained around or even a bit below average. As a result, the revised staff forecasts – which were based on an unchanged cash rate – suggested that GDP growth would remain below trend over the course of this year, before gradually picking up to an above-trend pace in 2016, somewhat later than had been previously expected. The unemployment rate was therefore expected to peak a little higher (and later) than in the previous forecast. The net effect of declining commodity prices and the depreciation of the exchange rate was expected to boost growth over the forecast period. Nonetheless, the higher degree of spare capacity now in prospect and lower oil prices had led to a lowering of the forecast for inflation, offset somewhat by the effects of the recent exchange rate depreciation. The restrained pace of wage increases over the past year or so and accompanying growth in productivity, which had dampened growth in unit labour costs, suggested that low rates of inflation were likely to be sustained. In other respects, the forces underpinning the outlook for domestic activity and inflation were much as they had been for some time.

Members noted the current accommodative setting of monetary policy, which had been providing support to domestic demand. They noted that the Australian dollar had depreciated noticeably against a rising US dollar over recent months, although less so against a basket of currencies, and that it remained above most estimates of its fundamental value, particularly given the significant declines in key commodity prices. Members agreed that a lower exchange rate was likely to be needed to achieve balanced growth in the economy.

Given the large increases in housing prices in some cities and ongoing strength in lending to investors in housing assets, members also agreed that developments in the housing market would bear careful monitoring. They noted that it would be important to assess the effects of the measures designed to reinforce sound residential mortgage lending practices announced by APRA in December.

On the basis of their assessment of current conditions and taking into account the revised forecasts, the Board judged that a further reduction in the cash rate would be appropriate to provide additional support to demand, while inflation outcomes were expected to remain consistent with the 2 to 3 per cent target. In deciding the timing of such a change, members assessed arguments for acting at this meeting or at the following meeting. On balance, they judged that moving at this meeting, which offered the opportunity of early additional communication in the forthcoming Statement on Monetary Policy, was the preferred course.

The Decision

The Board decided to lower the cash rate by 25 basis points to 2.25 per cent, effective 4 February 2015.

Macquarie Group Operational Briefing

Macquarie Group Limited (Macquarie) today provided an update on business activity in the third quarter of the financial year ending 31 March 2015 (December 2014 quarter) and updated the outlook for the financial year ending 31 March 2015 (FY15). It was a solid story, and the changes in business mix are likely to support momentum together with positive movements in exchange rates.

  • Trading conditions across the Group have continued to improve during the Dec 14 quarter and there has been a continued weakening of the Australian dollar
  • Annuity-style businesses’ combined Dec 14 quarter net profit contribution down on both a strong Dec 13 quarter (prior corresponding period) and Sep 14 quarter (prior period) which benefited from significant performance fees in Macquarie Asset Management (formerly Macquarie Funds Group) and the sale of OzForex
  • Capital markets facing businesses experienced improved trading conditions with combined Dec 14 quarter net profit contribution1 up significantly on both the prior corresponding period and the prior period
  • APRA Basel III Group capital of $A14.3 billion, $A1.4 billion surplus to minimum regulatory capital requirements from 1 January 20163, $A2.6 billion surplus to existing requirements
  • Macquarie Funds Group has changed its name to Macquarie Asset Management, and Fixed Income, Currencies and Commodities has changed its name to Commodities and Financial Markets to better align the group names to their business activities

Looking at the segmentals:

  • Macquarie Asset Management (MAM), Australia’s largest global asset manager, saw assets under management increase to $A453.3 billion at 31 December 2014 from $A423.3 billion at 30 September 2014. Since 1H15, Macquarie Infrastructure and Real Assets raised $A2.2 billion in new equity, largely in Pan-Asia infrastructure. Macquarie Investment Management was awarded $A2.1 billion in new, funded institutional mandates across 14 strategies from clients in six countries. Macquarie Specialised Investment Solutions reached first close on the UK Inflation-linked Infrastructure Debt Fund.
  • Corporate and Asset Finance (CAF) experienced continued growth in the lending and asset portfolios, increasing to $A29.0 billion at 31 December 2014 from $A27.5 billion at 30 September 2014. CAF continued to grow its corporate and real estate lending portfolios across all geographies, and the Energy Leasing business continued its key funding role in the rollout of smart meters throughout the UK.
  • Banking and Financial Services (BFS) increased its Australian mortgage portfolio to $A22.3 billion at 31 December 2014 from $A19.8 billion at 30 September 2014, which represents 1.6 per cent of the Australian mortgage market. Macquarie platform assets under administration increased by four per cent during the December 2014 quarter to $A43.2 billion while retail deposits increased by one per cent during the same period to $A35.7 billion.
  • Macquarie Securities Group (MSG) held the No.1 market share position for Australia/New Zealand Initial Public Offerings (IPOs) by number and value of deals5. In October 2014, MSG launched its Malaysia Structured Warrants product gaining No.1 market share6, establishing Macquarie as a leading issuer in Asia by coverage.
  • Macquarie Capital completed a number of transactions in the December 2014 quarter including: Joint Lead Manager on the $A5.7 billion IPO of Medibank Private, the largest Australian IPO in 2014 and the second largest Australian IPO ever; Adviser to Freeport LNG on its landmark $US11 billion equity and debt raising to project finance its LNG export facility in Texas; and Adviser to State Grid Corporation of China on the €2.1 billion acquisition of a 35 per cent interest in CDP RETI in Italy.
  • Commodities and Financial Markets (CFM) experienced increased volatility in oil and gas prices which generated increased customer activity across the energy platform. The business also experienced stronger client flows in foreign exchange due to increased market volatility. CFM is ranked the No.3 US physical gas marketer in North America

Looking further at the Australian mortgage business, we see significant growth in the book, a fall in the mix of high LVR loans, and a slightly higher concentration in NSW and Investment loans than system. The Australian mortgage portfolio includes $1.5 billion portfolio of non-branded mortgages they purchased from ING in September.

MBLDec20143 MBLDec20142 MBLDec20141


ANZ Trading Update – Solid In Tough Environment

ANZ today announced an unaudited cash profit of $1.79 billion and an unaudited statutory net profit of $1.65 billion for the 3 months to 31 December 2014, declaring it was a “solid result in a tough environment”. We say, “below expectations, in an increasingly complex and competitive market!”  Profit before Provisions grew 5.2% versus the prior comparable period and rose 3.6% on a constant Foreign Exchange (FX) basis. This result was below consensus estimates, with margins squeezed, institutional banking revenue down, and provisions lower than expected. The share price fell on the day.

Revenue was above the quarterly average for FY14 with benefits from the decline in the Australian dollar exchange rate partially offset by lower Global Markets trading income. Expenses were also higher than the FY14 quarterly average reflecting exchange rate impacts along with several key business enhancement projects becoming operational. This included a new digital platform for the Australian business which provides better product speed to market and customer interface. ANZ continues to invest in growth opportunities and enablement capability.

Customer deposits grew 9% with net loans and advances up 8%. Deposit growth was strong across all geographies with lending demand varied across the Group and customer pay-down levels remaining elevated.

Group Net Interest Margin declined 6bps compared with the end of the second half FY14, 2bps of which related to foreign exchange translation impacts. The remainder was largely attributable to Global Markets and the impact of higher liquidity requirements.

Portfolio quality improvement, with further reductions in impaired assets. The provision charge of $232m was slightly lower than the FY14 quarterly average with no reduction in the management overlay balance during the period.

Excluding the impact of the FY14 final dividend payment, CET1 capital improved by around 20 bps. At 31 December the capital ratio on an APRA CET1 basis was 8.4% (11.9% Basel 3 Internationally Comparable basis). Risk Weighted Assets in creased $17.4 billion of which $8.2 billion was attributable to FX translation which has a negligible impact on Group CET1.

Looking at the segmentals,

The Australia Division is performing strongly, with all core segments contributing. Home lending has continued to grow at above system rates, with the fastest growth occurring in New South Wales. Targeted campaigns, leveraging our digital sales capabilities, have seen the Credit Cards business rebound, posting the highest market share gains of the major banks in the past 6 months. Commercial lending momentum has been maintained following the trend in the second half of FY14, particularly in Small Business Banking. Deposit growth trends were also positive, especially in Commercial, and ANZ has  maintained market share in Household Deposits.

The New Zealand Division is also performing strongly delivering balance sheet growth with market share steady in the competitive mortgages market and deposit growth also strong. Ongoing benefits from the brand and systems merge continue to contribute to positive income expense jaws and the credit environment remains benign.

Global Wealth continues to build momentum, delivering strong in-force premiums growth, stable claims and lapse experience together with further growth in Funds under Management. Innovations including ANZ Smart Choice Super, the GROW by ANZ digital platform and the ANZ Grow Centre are driving greater adoption of Wealth products by both new to bank and existing ANZ customers.

International and Institutional Banking had a mixed start to the year. Trade volumes have been consistent; however significant reductions in commodity prices are impacting the value of shipments and providing a revenue headwind. Cash Management saw significant growth in volumes, particularly in Asia, with margins slightly improved. The Global Markets business delivered its strongest quarterly customer sales result in two years; however total Markets revenues (1Q15 $555 million) were down on the quarterly average for last year reflecting lower trading income. The business settings remain cons ervative with the value at risk (VaR) tracking below 2014 levels.