Economic Implications of High and Rising Household Indebtedness

The Reserve Bank of New Zealand just published an interesting report on this important topic. High and rapidly rising levels of household debt can be risky. A high level of debt increases the sensitivity of households to any shock to their income or balance sheet. And during periods of financial stress, highly indebted households tend to cut their spending more than their less-indebted peers. This can amplify a downturn and helps to explain why many advanced economies since the 2008-09 crisis have had subdued recoveries. Financial institutions can suffer direct losses from lending to households, although these losses are rarely enough on their own to cause a systemic banking crisis. The sustainability of household debt can be assessed best by looking at data detailed enough to build a picture of how debt and debt servicing capacity is distributed across different types of borrowers.

Households, either individually, or in aggregate, can ‘over-borrow’, and financial institutions can ‘over-lend’ to them. A high level of household debt can affect both the financial system and the economy in several ways that are explained in this article.

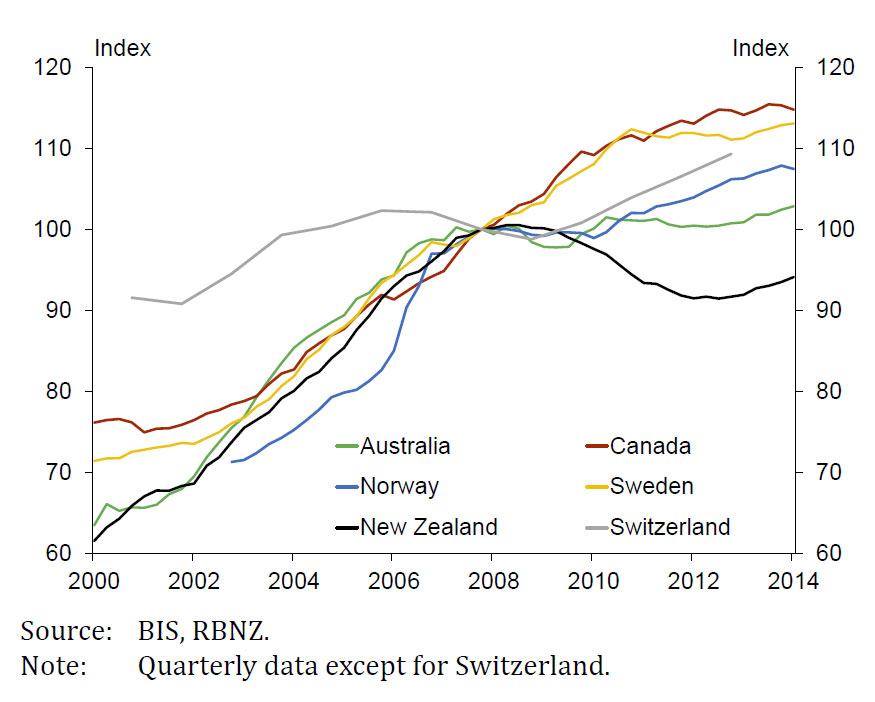
Two sets of comparative data makes interesting reading. First, household debt-to-disposable income ratio – by country. Cross-country comparisons of debt levels need to be treated with caution, given a variety of measurement issues and different institutional features. That said, the rise in household debt in New Zealand over the last cycle was not exceptional compared to other countries, and Australia is higher.RBNZ-Household-Ratio
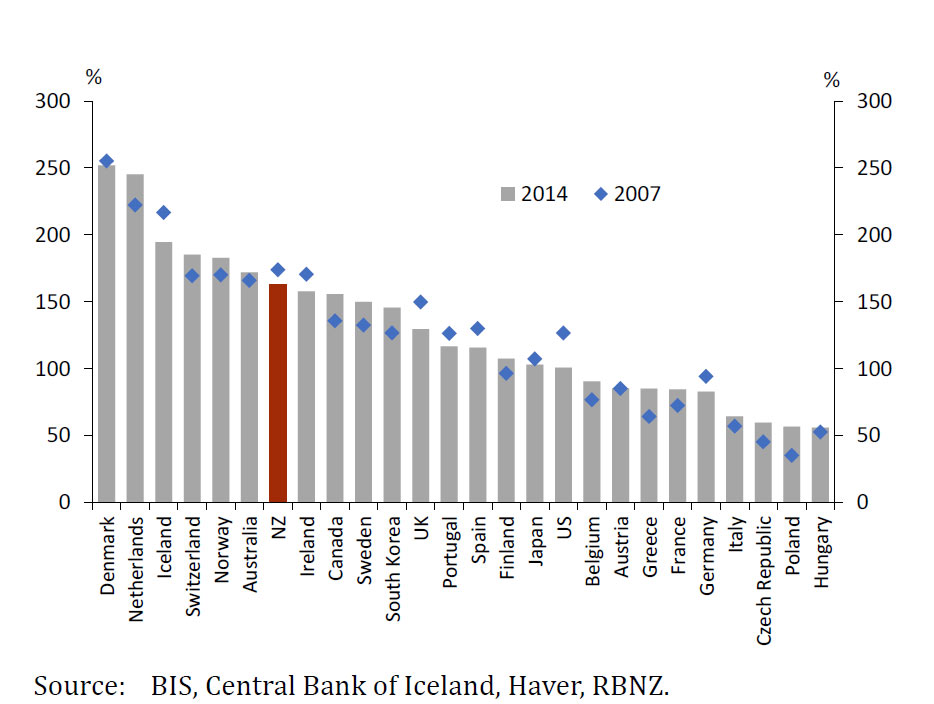
Second, Household debt-to-income ratios – selected countries. The Reserve Bank comments that “in quite a few countries there was no domestic financial crisis and little sustained fall in house prices. Policymakers in several of these economies, including New Zealand, have subsequently become concerned by household sector developments over the past several years – developments underpinned by low interest rates and an easing in lending standards. Household debt levels have started to increase from already high levels, while house prices are growing from a starting point of ‘over-valuation’.

RBNZ-Debt-To-Income The implementation of an LVR speed limit in New Zealand reflected emerging developments in the housing market that if left unchecked, could have threatened future macroeconomic stability. Some other jurisdictions have also used new macro-prudential tools, in combination with improving the existing underlying prudential framework. In addition to LVR restrictions, other measures include: maximum debt servicing-to-income limits, maximum debt to-income limits, higher risk weights on banks’ housing loans and prudent (or responsible) lending guidelines.

They conclude that:

“This article has focused on the various channels through which household debt can affect the financial system and broader economy. In this sense, households can ‘over-borrow’, although this is often not apparent in ‘real time’ and excess debt levels can lead to, or aggravate, economic downturns or periods of financial distress. The relationship between household indebtedness and consumption volatility is important for the macroeconomy, because it means that the behaviour of highly indebted households during periods of financial duress can amplify downturns. While historical evidence suggests losses on household lending are rarely the sole factor in systemic banking crises, housing-related credit booms and busts often occur alongside booms and busts in other sectors such as the (much riskier) construction and commercial property sector. It is also worth noting that, over time, housing loan portfolios have become a larger share of bank lending in many countries, including New Zealand, increasing their potential to play a larger part in future financial crises. Thus household debt is an important area of focus from a financial stability perspective.

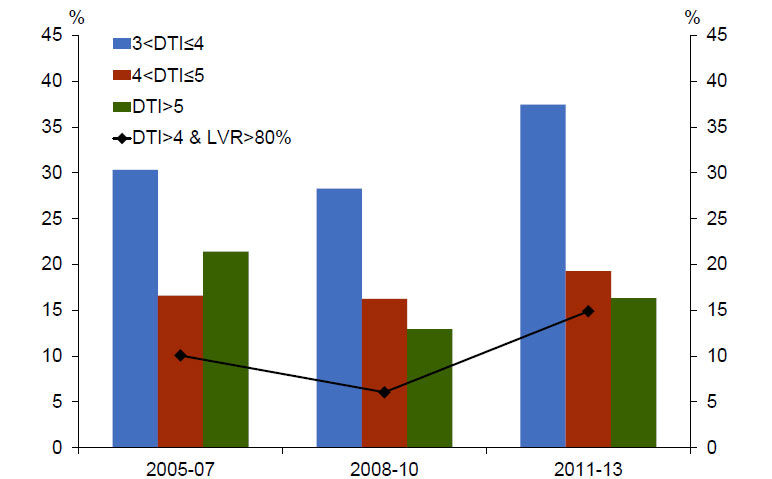
Good micro-level household data provide an important window into how debt and debt servicing capacity is distributed across the household sector, and are also helpful for carrying out simple stress-tests of the sector using a range of large, but plausible shocks. New Zealand’s data in this area are improving. Data from the Household Economic Survey show a rise in the proportion of borrowers with a high LVR and high debt-to-income ratio, thereby supporting the view that LVR speed limits have been appropriate to curtail risks to financial stability. The Reserve Bank will continue to develop its framework for analysing household sector risk and vulnerabilities.”

RBA On Household Risks

In the financial stability report today, the RBA comments:

“Household sector risks continue to revolve largely around the housing and mortgage markets. At this stage, competitive pressures have not induced a material  easing in non-price housing lending standards. The composition of new mortgage finance remains skewed to investors, however, particularly in the largest cities. Ongoing strong speculative demand would tend to amplify the run-up in housing prices and increase the risk that prices in at least some regions might fall significantly later on. In the first instance, the consequences of such a downturn in prices are more likely to be macroeconomic in nature because of the effects on household wealth and spending would be spread more broadly than just on the recent property purchasers. However, the further housing prices fall in that scenario, the greater the chance that lenders would incur losses on their housing loans.

At the margin, the recent decline in mortgage interest rates can be expected to boost demand for housing further, although it will also make it easier for existing borrowers to service their debts. Indicators of household stress are currently at low levels, but could start to increase if labour market conditions weakened further than currently envisaged”.

They go on to discuss the APRA and ASIC measures and say it is too soon to assesses their effectiveness.  Not, to worry though, as they are “monitoring an array of information”. Too little too late in my view. Actually households are currently more in debt than ever, so levels of stress are in relative terms higher. If rates were to rise, or if house prices fell, the impact would be severe and immediate (in Ireland it took just nine months to wreck household budgets in 2007).

Latest DFA Survey – Other Segments

Today we round out the latest survey results, by updating our other segments. The property as investment bug continues to spread.

First, those looking to trade up. Property investment has now overtaken the desire for more space as the main driver to transact. We also see that life style changes and purchase due to job changes are of similar significance. Up traders will be looking the purchase property from down traders, who slightly outnumber them.

UptradersMar2015The one million households looking to trade down, are still motivated first by the desire for greater convenience, but we also see an increasing desire to release capital for retirement and to lock in capital gains. This segment continue to be less bullish on future house price appreciation. Trading down because of unemployment and death of spouse also figure in the results. About 17% of down traders expect to use some or all of the proceeds of sale to facilitate the purchase of an investment property.

DownTradersMar2015Refinancers are still motivated by the desire to reduce monthly mortgage repayments, though the proportion looking to lock in a fixed rate has fallen, on the expectation of lower rates in coming months. About 16% of these households are looking to release capital, thanks to lifting house prices. This capital will flow to purchase specific items like a new car, or holiday, or as a deposit for an investment property. The flow of money into further property assets of course works against the RBA’s desire to lift household spending towards facilitating economic growth.

RefinanceMar2015Finally, as we highlighted before, the number of households who want to buy, but cannot continues to rise. The main barrier is the high price of property. Concern about interest rate rises has fallen in the light of RBA expectations.

WantToBuysMar2015This concludes the results from our latest surveys, and we will be incorporating the updated findings in the next edition of the Property Imperative, to be released in April.

Standing back, it is all about investment property. The nation is fixating on property speculation. A logical reaction to low interest rates, high house prices, and the search for yield, maybe. However, not good for long term productive growth. Yet, the recipe to address the underlying problem, greater housing supply, changes to negative gearing, increases in banking capital for housing, and other macroprudential measures seem beyond the powers that be. The current trajectory is deeply flawed, but I fear little will be done. Worst still, further interest rate reductions, would pour more fuel on the fire.

Lazard Warns On Australian Property

According to the Australian today, Lazard Asset Management fund managers are concerned about the banks’ skyhigh valuations and the risks of a housing market correction.

“…it’s record high household debt in a hot property market — a more worrying scenario for it tends to cause deeper economic pain.

“Property prices, bank valuations — we’re still in the pre-2007 paradigm: as soon as we get a rate cut, we go out and buy another property,” Mr Hofflin said, citing higher median prices in Wagga Wagga than Chicago.

“What happened in the US in terms of the wealth effect when property fell could be worse here because property dominates Australians’ balance sheet … and because prices are so high in the first place.

“If you have an asset that is expensive but there’s no debt against it, we think it’s much less dangerous to the economy … in this case there is a lot of debt against it.”

While there is a view that Australia’s circumstances such as tight land supply and tax incentives protected the nation from a property collapse, regulators are growing increasingly concerned, particularly in Sydney.

As chief banking regulator Wayne Byres noted last week, the nation’s good housing fortune over the years “doesn’t mean that will always be the case”.

Mr Hofflin, fresh from speaking at the national “Big Day Out” events for financial advisers, shares regulators’ concerns about the state of lending, where almost half of new loans are to investors and 45 per cent on interest-only terms. He added that if you use gross rental yields, costs and taxes to generate, residential property is trading on a massive 60 times earnings — four times the value investors ascribe to the stock­market.

The housing credit boom and insatiable appetite for yield stocks has pushed bank market capitalisations to about 35 per cent of the stockmarket, a level Mr Hofflin said he’d never seen before”.

RBA Data On Bank Funding

In the latest RBA Bulletin for the March quarter, there is an interesting article on bank funding “Developments in Banks’ Funding Costs and Lending Rates”. It demonstrates mix of forces in play, including competitive dynamics, relative product pricing, and the impact of the global financial system on the banks. The main finding is that the spread between the major banks’ outstanding funding costs and the cash rate narrowed a little over 2014. This was due to slightly lower costs of deposits combined with a more favourable mix of deposit funding. The contribution of wholesale funding to the narrowing was marginal as more favourable conditions in long-term debt markets were mostly offset by a rise in the cost of short-term debt. Lending rates declined a little more than funding costs, reflecting competitive pressures.

The spread of banks’ funding costs to the cash rate is estimated to have narrowed by about 9 basis points in 2014. With the cash rate unchanged over the past year, the slight narrowing in the spread was entirely due to changes in the absolute cost and mix of funding liabilities. In particular, the narrowing was driven by a lower cost of deposit funding and changes in the composition of deposits. Changes in the costs and composition of wholesale funding (i.e. bonds and bills) contributed only marginally to the fall in funding costs. Nonetheless, funding costs relative to the cash rate remain significantly higher than they were before the global financial crisis in 2008.

BankFundingMar15Interest rates offered on some types of deposits declined over the year. The cost of outstanding term deposits is estimated to have fallen by about 40 basis points as deposits issued at higher rates matured and were replaced by new deposits at lower rates. Similarly, the major banks’ advertised ‘specials’ on new term deposits fell by about 40 basis points over the past year.

HouseholdDepositsMar2015During 2014, the estimated average interest rate on outstanding variable-rate housing loans continued to drift lower relative to the cash rate. The overall outstanding rate declined as new or refinanced loans were written at lower rates than existing and maturing loans. This reflected a sizeable reduction in fixed rates over the year and an increase in the level and availability of discounting below advertised rates. The interest rates on around two-thirds of business
loans are typically set at a margin over the bank bill swap rate rather than the cash rate. While these spreads remain wider, reflecting the reassessment
of risk since the global financial crisis, they have generally trended down over the past two years. BanksFundingMar2015Much of the narrowing of spreads over 2014 was due to average business lending rates declining by over 20 basis points, with outstanding rates for small business decreasing by more than rates for large businesses.

BusinessLoansMar2015

Deep Mortgage Discounts To Be Had

We have updated our survey models, and we note that since January banks have been discounting their mortgage dealss in an attempt to gain relative share. The average discount is more than 100 basis points off the standard advertised rate. So households should be negotiating hard to get the best deal.

DiscountsMar2015We also see that the range of discounts available are still wide, depending on elements such as customer segment, LVR, loan type, loans size and location. Different players appear to to targeting different business. The best discounts are around 130 basis points.

DiscountRangeMar2015Our analysis shows that mortgage competition and SME lending is being supported by banks further reducing their returns to depositors. Something which we foreshadowed last year.

APRA Waiting For Global Capital Developments Before Acting

In Wayne Byres speech today to the House of Representatives Standing Committee on Economics, there was a clear indication that they would wait for the results of the international work of changes to capital rules before doing much locally. Meantime they will continue to talk to the local banks about sound lending practice. Too little, to late in my view. We need to move beyond a fixation on financial stability.

Sound Lending Practices for Housing

When we made our last appearance, we were still contemplating potential actions with respect to emerging risks in the housing market. We have since written to all authorised deposit-taking institutions (or ADIs) encouraging them to maintain sound lending standards, and identified some benchmarks that APRA supervisors will be using in deciding whether additional supervisory action – such as higher capital requirements – might be warranted.

I would like to emphasise that, in alerting ADIs to our concerns in this area, we are seeking to ensure emerging risks and imbalances do not get out of hand. We are not targeting house price levels – as I have said elsewhere, that is beyond our mandate – and we are not at this point asking banks to materially reduce their lending.  We have identified some areas where we have set benchmarks that we think will be useful indicators of where risk could be building, and in doing so, will help reinforce sound lending practices amongst all ADIs.  We are currently assessing the plans and practices of individual ADIs and, over the next month or so, will be considering whether any supervisory action is needed. So far, our discussions with the major lenders have suggested they recognise it is in everyone’s interests for sound lending standards to be maintained.  But we shall see – we are ready to take further action if needed.

Financial System Inquiry

Beyond this immediate issue, we are also giving thought to the more fundamental issues in relation to ADI capital contained in the recommendations of the Financial System Inquiry. There are two key influences on how we will proceed on these issues: first, the submissions made through the Government’s consultation process, and second, the work still underway on a number of related issues in the international standard-setting bodies, particularly the Basel Committee on Banking Supervision.

Helpfully, the FSI and the international work are pointing us in the same direction. There are, however, complexities in the detail that we need to work through carefully. In terms of timing, we do not need to wait for every i to be dotted and t to be crossed in the international work before we turn our minds to an appropriate response to the FSI’s recommendations.  But it will be in everyone’s interests if, over the next few months, we are able to glean a better sense of some of the likely outcomes of the international work before we make too many decisions on proposed changes to the Australian capital adequacy framework.

Conflicts Management in Superannuation

When we last appeared before this Committee, we spent some of our time discussing the management of conflicts of interest in the superannuation industry. Since the introduction of prudential standards for superannuation in 2013, APRA has been assessing how well trustees have adjusted to the heightened expectations placed upon them, with a particular focus on conflicts management. The main message from our recent review in this area is that, while there have been improvements across the industry and some trustees have established quite good practices, others still have more work to do to meet the objectives of the prudential standard. Unfortunately, we still see instances where actual and potential conflicts are viewed very narrowly: a minimalist, compliance-based approach is taken to the design of conflicts management frameworks, rather than an approach that seeks to meet the spirit and intent of the requirements. Some trustees also take a reactive approach to dealing with conflicts, rather than ensuring regular and appropriate prior consideration of conflicts and a proactive approach to their effective management.

APRA’s supervisors are engaging with the entities that were covered by the review to ensure that appropriate and timely action is taken on any specific issues that were identified. We are also issuing a general letter to the industry, providing the key findings from the review and identifying a range of specific questions for trustees to consider in reviewing and enhancing their conflicts management frameworks. APRA will continue to focus on conflicts management as part of its future supervision activities, and will continue to push the industry to meet the enhanced governance and risk management expectations set out in our standards.

Private Health Insurance

Finally, let me make a quick comment on private health insurance. As you would be aware, APRA is not currently the prudential regulator of private health insurance – the Private Health Insurance Administration Council (PHIAC) performs that function – but we are preparing to take on that task from 1 July 2015, assuming the passage of the relevant legislation. For our part, we are working closely with PHIAC and other stakeholders, and will be ready to take on these new responsibilities. We are proposing only the minimum change necessary to the prudential standards and rules to align them with the proposed new legislation – in practice, health insurers should notice very little difference in their prudential arrangements from 1 July. But, even though the impact of the change may not be particularly noticeable, we would stress that a lot of work has gone into the preparations and it is in everyone’s interest that the momentum is not lost. APRA, PHIAC staff and industry will all benefit from the certainty provided by that.

Latest DFA Survey – First Time Buyers Motivations and Barriers

We continue our series using data from the latest DFA segmented household surveys. First time buyers are more than ever becoming property speculators. Whilst we have already quantified the number of first time buyers and first time investors in the market,

FTBFootprintMar2015 today we look at their underlying motivations. So, looking at these trends there are some striking observations. We see that the prospect of potential capital gains, is now the highest rated driver at 32%, whilst the desire for somewhere to live is  just 28%. We see the prospect of gaining tax advantage is growing, now up to 10%, whilst the advantage of a First Home Owner Grant (FHOG) is falling away as these grants become less accessible. Fewer buyers now expect to pay less than renting, whilst the prospect of greater security remains about the same.

FTBMotivationsMar2015The biggest barrier to purchase are clearly current prices. This translates into too higher mortgages, or too bigger savings requirements to get into the market. The bank of “Mum and Dad” remains a prime source of funding. Fear of unemployment has diminished, whilst the problem of finding a place to buy has increased (now 22%).  The impact of potential interest rates reduced slightly, in response to the RBA cut, and expectation of lower rates for longer. Many now assume rates will stay low for at least three years, and they plan on this basis.

FTBBarriersMar2015Looking at where they will buy, 20% of potential first time buyers are not sure where to purchase. Across all Australia a suburban home is still the most desired property type, but in Sydney, a unit is much more the expectation now, mostly on the urban fringe, or inner suburbs.

FirstTimeBuyersWhereMar2015If we look at the split between owner occupied and investor first time buyers, we see investors are predominately going after units, either on the edge of the City (inner suburbs – e.g. in Sydney Hurstville, Wolli Creek), or suburban units.

FirstTimeBuyersTypeMar2015So putting this together, we conclude that first time buyers are reacting to the current house price boom in logical ways. They are however being infected by the notion that property is about wealth building, rather than somewhere to live. This notion, which served previous generations quite well (once they were on the property escalator), may be tested if interest rates rise later, or property prices fall from their current illogical stratospheric levels. The overriding result from the survey is the first time buyers are very fearful of missing out, and that delaying potential entry into the market will simply make it less affordable later.  This is why we expect to see a continued rise in the number of first time investor buyers.

Latest DFA Survey – Investor Motivations

Continuing our series of updates from our latest household surveys, today we look at the latest investment property trends. Looking at solo investors first (using the DFA segmentation) we see the main drivers to transact relate to the continued potential for appreciating property values and the tax efficient nature of the investment. We also see an expectation of higher returns than deposits. This all explains why property investment is so hot. It is, from an investment perspective, for many, the best game in town. The average age for a first time property investor continues to fall, and now stands at 38 years, partly reflecting the rise of first time buyer investors, as we featured recently.

SoloInvMar2015Turning to potential barriers which may stop investors transacting, current prices are not seen as a critical issue – only 18% said this was a turn-off. Whilst 45% had already transacted, there is still significant potential for further purchases, especially in the Sydney and Melbourne markets. We also see that whilst there is some recognition of potential changes to regulation (relating to LVR hurdles, interest only, and gearing), less than one third of investors are worried by this. Finally, only 15% were worrying about potential budget changes, we saw a spike after the budget last year, we may see the same again in our post budget survey.  Nearly half expect to select an interest only loan.

InvBarriersMar2015Investing via a super fund is still a minority sport, though some investors are getting advice from internet forums, or mortgage brokers. We estimate about 3.5% of SMSF have an investment property in their fund, and a further 3% are actively considering this investment route.

SMSFAdvisorsMar2015Those who are thinking of a SMSF transaction continue to be attracted by tax efficient outcomes and appreciating property values. These drivers match the broader investment sector quite well as we showed above.

SuperInvMar2015Finally we look at portfolio investors. This is becoming an ever more important sector, because the capital gains and imcone from current properties are being used to leverage further investment, to crease a self-sustaining (some would say critical mass) proposition. The proportion with a holding of 10 properties or more is steadily increasing. Again, these investors are driven by tax efficiency and appreciating property values and also an expectation of better returns than deposits.  One trend we detected in this segment is the rise in the number of portfolio investors who now see property investment as their main source of income, it has essentially become their job.

PortfolioInvMar2015 Next time we will look at some of our other segment findings.

NZ Loan To Income Ratios Higher

The Reserve Bank of NZ released a report today “Vulnerability of new mortgage borrowers prior to the introduction of the LVR speed limit: Insights from the Household Economic Survey.” The paper uses household level data for New Zealand to assess the vulnerability of new mortgage loans to owner-occupiers between 2005 and 2013.

They modelled financial vulnerability, considering:

  • Does the household have adequate cash flow to support mortgage borrowing?
  • How large is the equity buffer of the household?

Their analysis suggests a move towards more stretched debt-to-income ratios between the 2008-10 and 2011-13 cohorts.

RBNZ-LTIThey highlighted that most banks will lend at much higher DTIs to high income borrowers than low income borrowers. Owner occupiers with an income of greater than $80,000 do account for almost half of high DTI lending in the 2011-13 cohort. However, this is significantly lower than their share of total lending of around 70 percent. By number, such households account for only 30 percent of owner occupiers with a high DTI.19 Subject to the caveat that our sample of high DTI borrowers is relatively small, this suggests that owner-occupiers with a high DTI are more likely to have an income below $80,000 than those with a low DTI (despite banks’ preference to supply high DTI loans to high income households).

They found an increase in typical DTI multiples compared to earlier years, in addition to the well-known rise in the share of high-LVR lending. The proportion of borrowers with both a high-DTI and a high-LVR also increased sharply and was higher than prior to the GFC. These results are consistent with an increase in the vulnerability within the 2011-13 cohort, although the quantum of lending undertaken and the tail of very high DTI borrowers both remained smaller than prior to the GFC.

Note that an assessment of the vulnerability of other borrower types – including investors and owner occupiers that have not recently bought – is left for future work.