Stock markets all over the world followed China’s lead, plunging into the red and wiping hundreds of billions of dollars off of share values. But, while it’s tempting to lay the blame entirely at China’s door, a look at the global economy and markets shows Western markets have been overvalued and were due a correction.
Equities are risky assets and do not go up forever in straight lines, so corrections can be fast and furious at times. This acts as a useful reminder to investors that stocks are risky assets.
Stock markets in recent years have benefited from market-friendly monetary policies. There have been three rounds of quantitative easing from the Federal Reserve, the Bank of Japan and more recently the European Central Bank. There have for some time been concerns about the outrageous valuation of shares of certain US companies, including Facebook, Twitter, Tesla, GoPro, Netflix and Amazon. Both short-term and long-term interest rates globally have been artificially low for record periods. This unusual era of money printing and low interest rates has boosted asset prices – not just stocks, but also property prices in major towns and cities around the globe.
More interestingly, until this correction, the current bull market has been extremely unusual in that it has been one of the longest ever periods recorded (48 months) without a 10% correction in the S&P 500 index. The green candles in the chart below show the index being up for the month red candles represent it down for the month. The previous longest periods were October 1990-October 1997 (84 months) and March 2003-October 2007 (54 months). The large red candle at the end represents the most recent drop.
Monthly movements in the S&P 500 index from February 2009.XXXX
Another sign that US stocks had become overvalued was the fact that the price-to-earnings ratio, which measures a company’s current share price relative to its earnings per share, was approaching 19 to 20 times earnings – historically it averages 16.
Price to earnings ratio on the S&P 50.XXXX
If we were to use Robert Shiller’s ten-year cyclically adjusted ratio, the market is even more overvalued at 24 times ten-year average earnings, typically the long term average is 15. By giving a long-term average of earnings, the Shiller ratio better reflects a firm’s long-term earning power.
Prospective ten-year annual returns were likely to be in the region of just 1-3%, which is too low to compensate investors for holding risky assets. The recent fall in US and other stock markets will help improve future prospective US stock returns to a low, but more healthy, 3-5% range.
Ten-year average price earnings ratio on the S&P 500.XXXX
What about China?
The current sell-off is probably related to events in China – there, the stock market clearly entered bubble territory some months ago. Chinese stocks were rising despite the economy clearly slowing and it was selling at price-to-earning ratios that made no economic sense even if you believed in a 7% growth story.
The Chinese economy is in much greater difficulty than the Chinese government has been prepared to admit to date. That is why recent devaluations of the renminbi have been a catalyst for the recent global stock market correction. It is an admission by the Chinese that their economy is in serious trouble, and represents an attempt to boost the economy through an increase in exports at the expense of some of their competitors.
The Chinese economy is the second-biggest economy in the world after the US, so trouble there also spells trouble for the global economy. The attempts by the Chinese government to prop up their stockmarket were doomed to fail and in recent days this has become very clear.
Closer to home
Another reason for the global stock market sell-off is that the US Federal Reserve has been getting closer to raising interest rates from their artificially low target range of 0 to 0.25%. Some market participants are clearly trying to get out of the market before any rise, which is now unlikely to happen in September.
The low interest rates have led to US companies issuing record amounts of debt, not so much to finance future growth but to buy back their own shares to artificially raise their earnings per share. This can work in the short-run, but not in the long run. Raising the leverage (debt-to-equity ratio) of US stocks increases their riskiness and therefore their potential for volatility. This is precisely what we are now witnessing.
Three-month US treasury bill interest rates.XXXX
The obvious question is what the recent turbulence implies for investors and companies. Should they stay put, or be worried that we are facing a similar crisis to the 2007-08 crash? The good news is that US stocks are nowhere near as overvalued as in the 2001 and 2007 although they should be wary of some of the most obscenely overvalued stocks mentioned earlier.
The Chinese stock market remains overvalued (still some 60 times their earning value) and the economy is in deep trouble. Even US stocks are still highly valued using the Shiller measure. This means global stocks will remain under pressure.
The turbulence we have witnessed is likely to continue, but rallies both ways tend to happen very quickly. Interest rates remain extremely low and will act as a future drag on the market as and when they rise. Companies should also be concerned about a wider slowdown in the global economy hitting their earnings, as China is now the world’s second largest importer of commodities, goods and services.
Author: Keith Pilbeam, Professor of Economics at City University London
NAB has announced a reclassification of household data provided previously as part of its regulatory reporting obligations. The reclassification, similar to the recent ANZ announcement, has no impact on customers and does not alter risk weighted assets, regulatory capital, cash earnings, balance sheet or risk appetite. The announcement was released to the ASX, not via the NAB web site or media releases.
The data being restated covers the period from July 2014 to June 2015. The main movements are:
Restatement of owner occupied housing from $165.4bn to 126.5bn
Restatement of investment housing from $66.6bn to $93bn
Restatement of non-housing from $11.5bn to $23.7bn
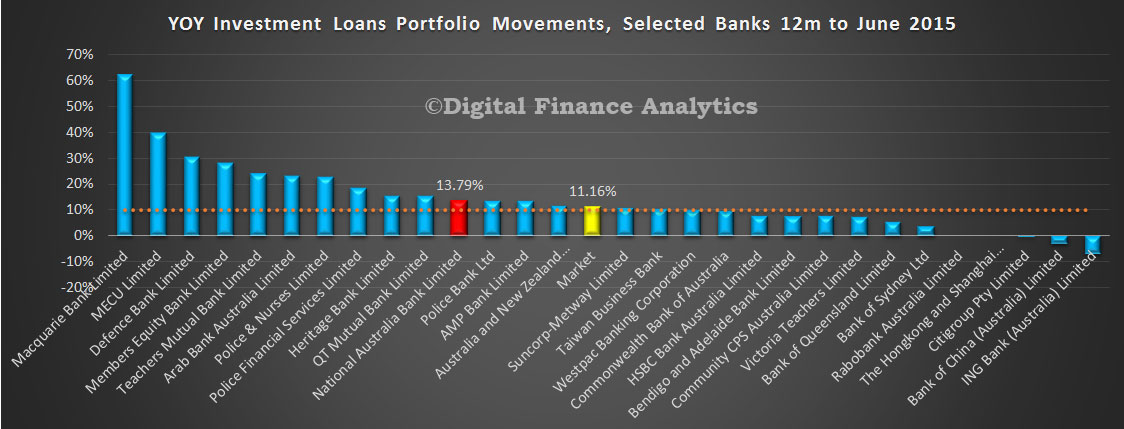
We have run an update to our APRA loan model which shows that the market for investment loans grew at a revised 11.16% (compared with the APRA 10% “speed limit”) and we estimate that NAB grew its investment portfolio by 13.79%, well above the hurdle.
These reporting adjustments make us question the accuracy of the reporting processes. We would observe that as a result of the banks adjustments the value of investment loans are higher, but the growth trajectory is similar to previously calculated, provided the one-off adjustments are run back through the full year.
This week’s global sell down in stocks has been pegged to fears about the slowdown in China, but looks more like the effects of contagion.
In China, the Shanghai Composite fell by more than 8%, to levels below that which have previously triggered government intervention. The S&P/ASX 200 Index closed down 4.1% on Monday, and the Australian dollar hit a fresh six-year low at 72.69 US cents. The Tokyo Stock Exchange slumped 4.61% to its lowest level in six months, and markets in Taiwan and Hong Kong were also significantly lower.
Talk of a currency war has continued, with the suggestion that China is devaluing its currency against other Asian currencies in order to maintain its all-important export competitiveness. This implies some form of deliberate policy action, and in the modern era of Asian central banks I do not see that this is what is happening. Modern central banks, of which there are many in Asia, do not typically engage in this type of behaviour. Instead, what we seem to be seeing is evidence of reassessment and contagion.
Contagion is not transmitted by fundamental economic relationships. For example, if there is a fall in the oil price, we could realistically expect the value of the Japanese yen to fall (as an oil importer) and the value of the Norwegian kroner to rise (as an oil producer). Contagion, instead reflects deviations from these fundamental expected relationships.
When a market, “over-reacts” (or under-reacts) to a shock generated elsewhere, then this may represent the effects of contagion.
But commentators are sometimes a bit loose in their use of the term. Sometimes, they mean that the drop in the value of a currency will have real effects on another economy. For example, a drop in the value of the renminbi means competitive pressure on other economies in the region, resulting in some potential reduction in their expected future growth, and hence some fall in value of their currencies. This is what is known as a spillover.
The fact that we can articulate a channel for this effect makes it something we can anticipate, and we could perhaps even have bought a hedge against this risk in the financial markets. Contagion proper is not expected and as a result cannot be priced in the markets. Contagion may be based on investor behaviour – often spooked by fear.
The current currency uncertainty in Asia is a good case in point. To date, there is no real evidence of the currency war that had been feared by some commentators. Instead, lowered expectations for future growth, and to some extent concerns of portfolio holders have created falls in the value of other Asian currencies. That which is based on underlying fundamental linkages and is well-founded will remain, but where fundamentals are stronger than current market fears suggest, then we might well expect corrections.
Rebalancing in action
The reaction of global currency markets to the Chinese renminbi devaluation is mainly newsworthy because it was unexpected. In a manner rather reminiscent of the disbelief that Russia would defer payments on its debt in 1998 (because a nuclear power had never before done so), there was no expectation that the Chinese currency would change in such a ground-breaking manner. It then takes markets a little while to sort out their reaction. As it does, this will set up a new set of expectations around how transmissions work.
It is the changes in the network of the relationships between different currencies and countries that represent the contagion effect. Previously existing links between currencies, may be weakened in the longer term, perhaps as markets recognise the greater separability of some of the other Asian economies from the driving force of China. At the same time other links may form or strengthen, perhaps in the direct assessment of individual Asian economies by non-Asian investment markets.
This changing landscape of the transmissions between currencies represents the changing nature of the underlying economies, and our preferences in incorporating them into our portfolio decisions. The existence of contagion represents the stress that ensues when we recognise that our existing map of the linkages between economies is fundamentally questioned by new events. It is part of a transition arrangement as information is rearranged by the markets.
While the above sounds very sound, the problem with contagion is that it is often abrupt, costly and falls disproportionately.
My recent research shows how contagion transmits internationally, and identifies a number of different channels. More importantly, it illustrates the costs associated with contagion in the form of ensuing banking crises. We show that if there is contagion which has both systematic effects (affecting the common drivers of the currencies in the Asian region for example), and idiosyncratic effects (where the source of the shock causes a disproportionate reaction in a particular asset, such as perhaps the effect of the Chinese devaluation on the Indonesian rupiah) these channels are likely to lead to high fiscal costs of subsequent banking crises.
Indonesia has itself paid a high cost in the past for these crises – during 1997-98 it arguably had stronger fundamentals than those of other Asian economies, but it suffered extraordinary economic hardship in the period of recovery.
The question is what is to be done about contagion. The experts find this a very difficult issue. In some ways nothing can be done, markets must realign their expectations. But if there is significant volatility as a result of this, or a retraction of credit, there will be very real effects for the economy in reducing investor confidence. Detecting, preventing and managing contagion is an important component of the management of systemic risk for any economy.
Author: Mardi Dungey, Professor of Economics and Finance, Associate Dean of Research, Tasmanian School of Business and Economics at University of Tasmania
APRA released their latest quarterly ADI property exposure data today. The publication contains information on ADIs’ commercial property exposures, residential property exposures and new housing loan approvals. Detailed statistics on residential property exposures and new housing loan approvals are included for ADIs with greater than $1 billion in housing loans.
ADIs’ commercial property exposures were $233.7 billion, an increase of $9.9 billion (4.4 per cent) over the year to 30 June 2015. Commercial property exposures within Australia were $194.0 billion, equivalent to 83.0 per cent of all commercial property exposures.
ADIs’ total domestic housing loans were $1.3 trillion, an increase of $97.1 billion (7.9 per cent) over the year. There were 5.4 million housing loans outstanding with an average balance of $243,000.
ADIs with greater than $1 billion in housing loans approved $96.0 billion of new loans, an increase of $10.5 billion (12.2 per cent) on the quarter ending 30 June 2014. Of these new loan approvals, $55.1 billion (57.4 per cent) were owner-occupied loans and $41.0 billion (42.6 per cent) were investment loans.
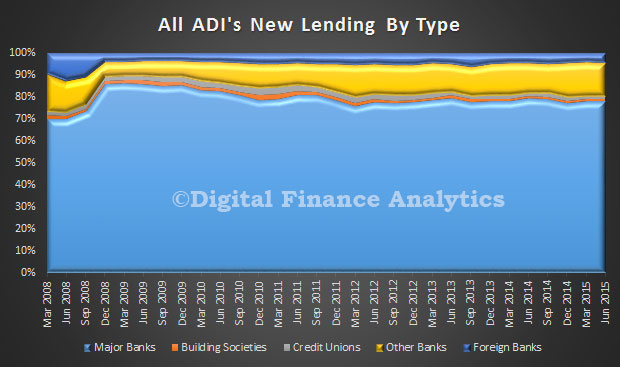
Looking at the housing related data in detail, we see major banks wrote about 80% of all home loans, other banks had about 13% of the market, the rest covered by building societies, credit unions and foreign banks.
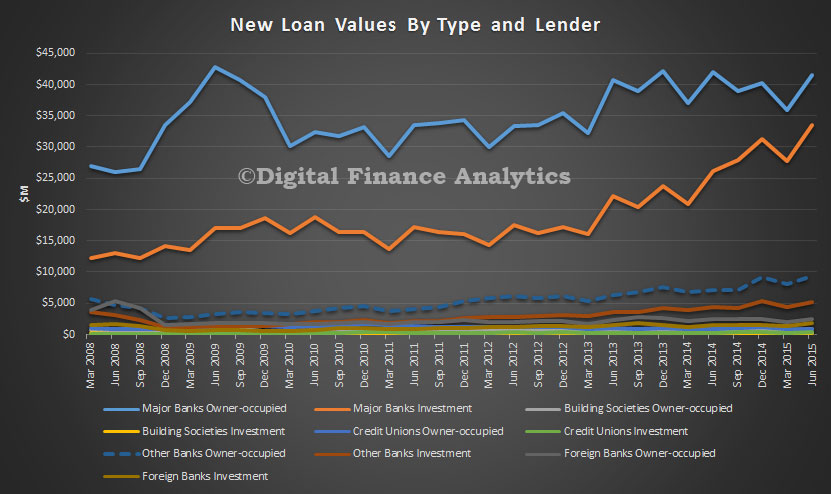
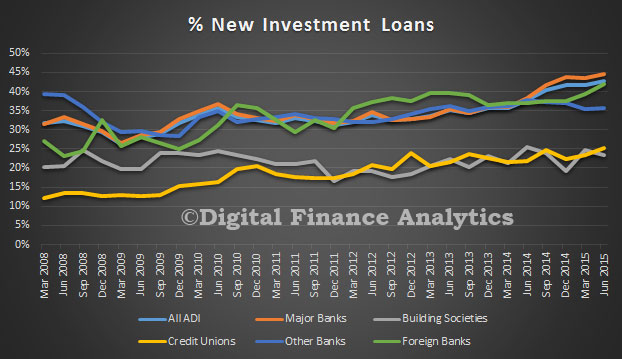
Looking at the relative value of loans, major banks still have the lion’s share, and we see the continued growth in investment lending
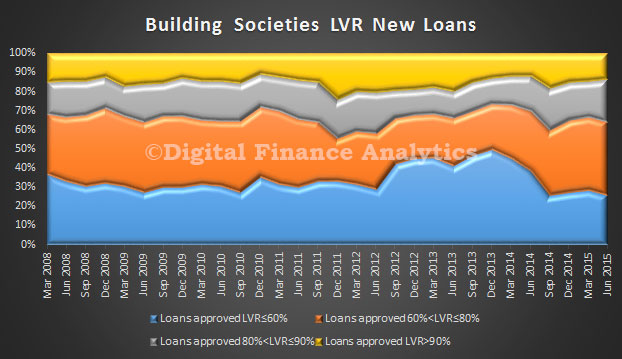
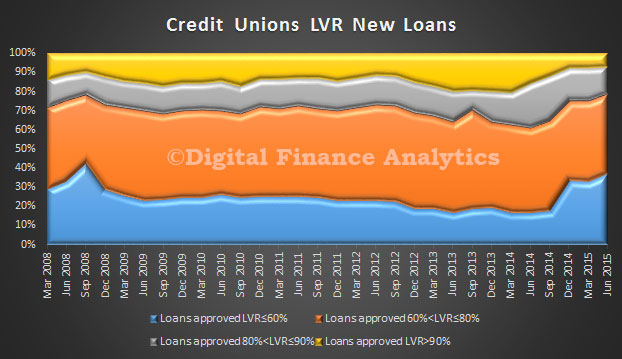
Looking at the LVR’s of new loans, we see that major banks have upped the proportion in the 60-80% range, and there is a slight reduction in loans over 90%. Clearly lending criteria have been tightened.
Building societies are writing more than 10% of loans over 90%, significantly more than credit unions.
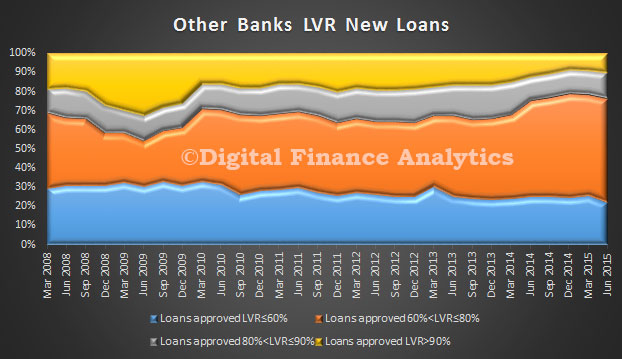
Other banks (excluding majors) also dialled back higher LVR loans but grew then past quarter and also grew their relative mix of 60-80% LVR loans.
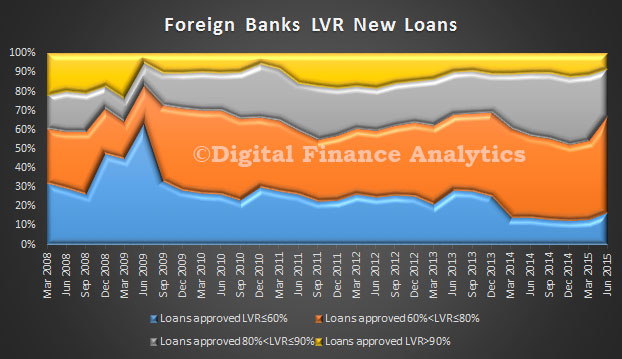
Foreign banks new high LVR loans fell. Once again we see growth in the 60-80% LVR range.
New investment loans grew with the majors (ANZ reclassified loans in the quarter), other banks investment loans fell slightly
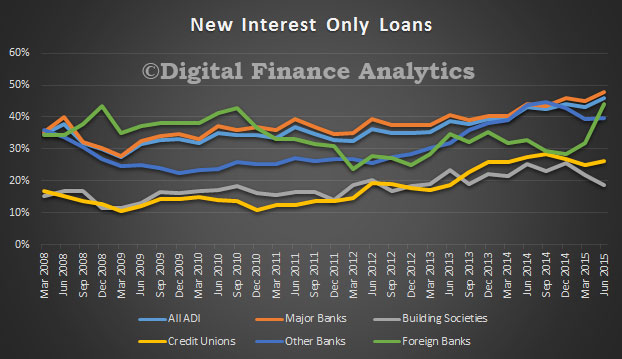
There was significant growth in interest only loans, foreign banks were strongly up.
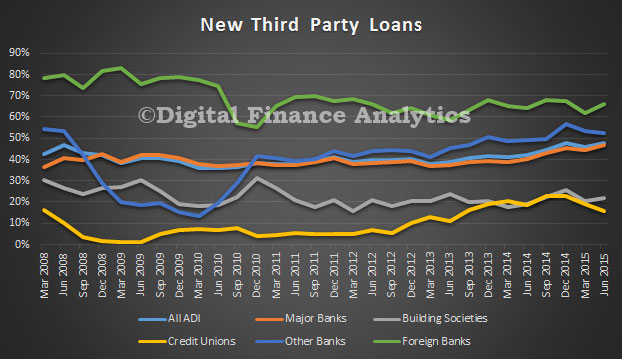
Overall about 46% of all new loans were written via third party channels. We see the majors continuing to grow their broker origination, whilst credit unions and foreign banks use of brokers fell.
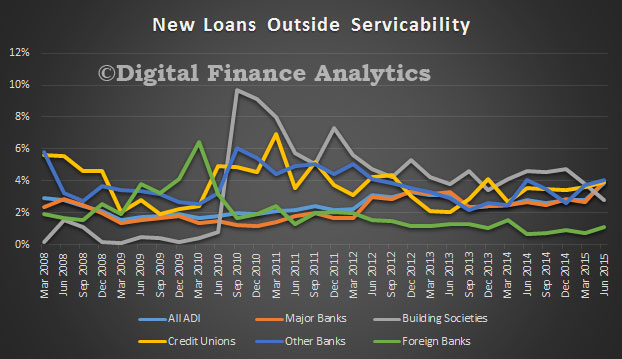
Overall, the proportion of out of serviceability criteria fell, but overall about 4% of new loans were approved outside normal criteria.
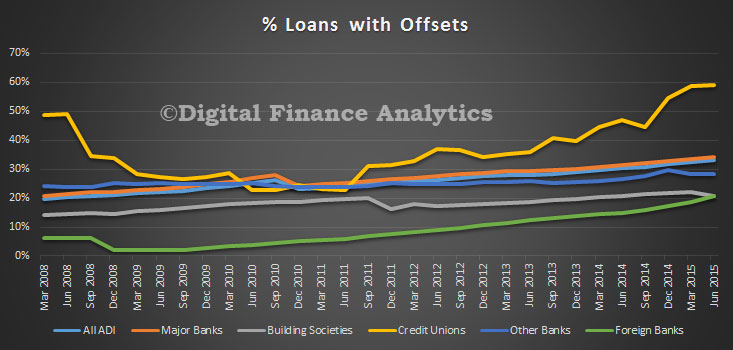
Loans with offset facilities continued to rise, with credit unions leading the way.
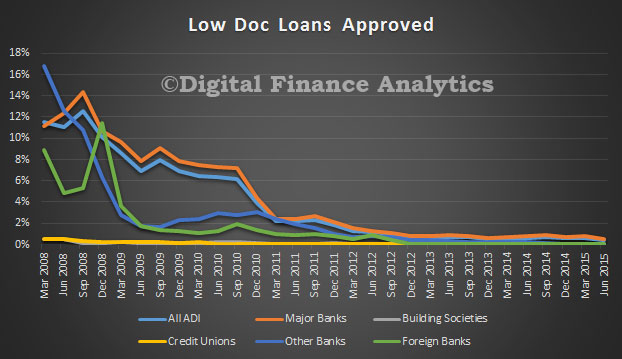
Finally, low documentation loans continue to languish.
In virtually every science fiction novel or film, there is an evil corporation which dominates the world – from LexCorp in the Superman franchise to Weyland-Yutani in Alien. Their masterminds tend to hide their ambitions behind stretched smiles and a language of care. That is, until the story’s protagonist exposes their plans and saves the world by exposing the evil afoot.
Compare this to the real world. We have corporations with huge influence which do bad things, we are well aware of it and yet we continue to let it happen. Why?
The recent New York Times exposé of life working for Amazon used old-fashioned investigative journalism to reveal the harsh reality of working in the company’s head office in Seattle. It documents a culture of relentless criticism, with a reliance on continual measuring of performance and long working hours. Unsurprisingly, this results in high labour turnover, as those who refuse to become “Amabots” (a term used to describe someone who has become part of the system) get spat out like returned parcels.
Nothing new to see here
There has been predictable criticism of Amazon following these revelations – rightly so. But consider what we already know about the company. We have known for some time that it has a tax structure which ensures that it minimises its responsibilities in paying for the roads which allows it to transport its goods and the education that allows its employees to be able to read and write (Amazon’s British business paid just £4.2m in tax in 2014, despite selling goods worth £4.3 billion).
Amazon factory workers in Germany striking last year for better pay and conditions.EPA/Roland Weihrauch
What else do we already know? That Amazon is a company which seeks to dominate markets through cost efficiencies, putting competitors out of business, or ensuring that they have to do their business through Amazon. There are well-documented accounts of its attempts to ensure that publishers offer the same discounts that it does, or that all print on demand has to go through its own company.
And, if that fails, it simply buys the competition with the huge piles of cash it has built from doing what it does, as it did with AbeBooks, LoveFilm, Goodreads, Internet Movie Database, The Book Depository, BookFinder, to name a few. And this isn’t even to mention its domination of the e-reader market through Kindle. Even if it doesn’t say so on the website, you might well be doing business through an Amazon subsidiary. If this isn’t a strategy for world domination, what is it?
In 21 years, Amazon has grown to become a company with almost US$89 billion in turnover every year. To put this in context, that’s greater than the GDP of countries such as Cuba, Oman and Belarus. And it has made Jeff Bezos, its driven founder, a personal fortune of around US$47 billion, which is about the same as the GDP of Costa Rica or Slovenia.
As one of his many plaudits, he was named “World’s Worst Boss” by the International Trade Union Confederation at their World Congress in May 2014. He also now owns the Washington Post.
All this, and much much more, is known about Amazon, but it continues to grow, recently suggesting a move into delivery by drones and beginning a food delivery service in a few US cities.
In his recent novel, The Circle, Dave Eggers describes a US internet company (a cipher for Google) that gradually moves towards world domination, using relentless monitoring of its employees and a continual rhetoric about exceeding customer needs. In the novel, when the customers or employees are confronted by criticisms of what the company does, they don’t see it, instead pointing to all the ways in which the company is making their lives easier. Criticism is seen as negative, practised by people who want to turn the clock back.
Results driven: Amazon CEO Jeff Bezos.EPA/Michael Nelson
Talk to most people about why Amazon is a problem and you will get similar responses. “But it makes things so easy.” “They are cheaper than anyone else.” “What’s wrong with efficiency?”
The law of the jungle
But this isn’t just a debate about Amazon, as if it is a bad company surrounded by lots of good ones. It raises much broader questions about what corporations do. Essentially, they are machines which are designed to grow, to externalise their costs and privatise their profits. The fact that this produces a management culture of extreme bullying, or anti-union practices in its workplaces, or anti-competitive strategies in its marketplaces shouldn’t really amaze us.
It’s the law of the jungle, right? What should amaze us is the extent to which we know that this happens and yet – unlike the heroes in the sci-fi films – we continue to do nothing about it.
Behind the reflective surfaces of its buildings and website, Amazon is selling us something else. It’s a vision of a different world of work and consumption. This is a privatised, measured and monetised world, in which every social value is for sale. You can even buy books which tell you what’s wrong with corporations through the website, because the content doesn’t really matter that much.
All that matters is that the company makes money, dominates markets, keeps customers happy. That is what Amazon sells, and we continue to keep buying it.
Author: Martin Parker, Professor of Organisation and Culture at University of Leicester
Most would accept that house prices in the major Australian centres are too high. Whether you use a measure of price to income, loan value to income, or price to GDP; they are all above long term trends. Indeed, in Sydney and Melbourne, they are arguably more than 30% higher than they should be. The latest DFA Video Blog discusses the issue and identifies the winners and losers, together with a transcript.
Ultra-low interest rates currently make large loans affordable for many households, yet overall household debt is as high as it has ever been and mortgage stress, even at these low interest rates is quite high. Banking regulators are concerned about systemic risks from overgenerous underwriting criteria and they have been lifting capital ratios to try to improve financial stability, with a focus on the fast growing investment sector. In many countries around the world, house prices are also high, so from New Zealand to UK, regulators are taking steps to try limit systemic risks. These rises are partly being driven by global movements of capital, ultra-low interest rates and quantitative easing.
However, let’s think about who benefits from high and rising prices. First anyone who currently holds property (and that is two-thirds of all households in Australia) will like the on-paper capital gains. This flows through to becoming an important element in building future wealth. In addition, refinancing is up currently, and we see some households crystalising some of the on-paper gains for holidays, a new car or other purposes, stimulating retail activity. A recent RBA research paper, suggests that low-income households have a higher propensity to purchase a new vehicle following a rise in housing wealth than high-income households.
Those holding investment property also enjoy tax-concessions on interest and other costs; and on capital appreciation. Rising wealth generally supports the feel-good factor, and consumer confidence – though currently this is a bit wonky.
Higher values stimulates more transactions, which creates more momentum.
Now, the one-third of households who are not property active, consist of those renting and those living with family, friends or in other arrangements. Their confidence levels are lower and they are not gaining from rising house prices. A relatively small proportion of these are actively seeking to buy, and they are finding the gradient becoming ever more challenging, as saving for a deposit is becoming harder, lending criteria are tightening and income growth is slowing. We have noted previously that a rising number of first time buyers have switched directly to the investment sector to get into the market. Generally younger households are yet to get on the housing escalator, whilst older generations have clearly benefited from sustained house price growth. This has the potential to become a significant inter-generational issue.
But overall, the wealth effect of rising property is an umbrella which spreads widely. The sheer weight of numbers indicates that there are more winners than losers. No surprise then that many politicians will seek to bathe in the reflected glory of rising values, whilst paying lip-service to housing affordability issues.
There are other winners too. For states where property stamp-duty exists, the larger the transaction value and volume, the higher the income. For example, in NSW, in January and February nearly $1bn was added to coffers thanks to this tax and the state is well on track to achieve the $6.1 billion of stamp duty forecast in the 2014-15 budget papers. The higher the price the larger the income. The tax-take funds locally provided services so ultimately residents benefit.
The banks also benefit because rising house prices gives them the capacity to lend larger loans (which in turn allows house prices to run higher again). They have benefited from relatively benign capital requirements and funding, thus growing their balance sheet and shareholder returns. Whilst recent returns have been pretty impressive, future returns may be lower thanks to changes in capital ratios and especially if housing lending moderates. On the other hand, their appetite to lend to productive business and commercial sectors is tempered by higher risks and more demanding capital requirements. The relative priority of debt to housing as opposed to productive lending to business is an important issue and whilst higher house prices can flow through to real economic growth, it is mostly illusory.
Finally, building companies can benefit from land banks they hold, and development projects, despite high local authority charges. We also note that some banks are now winding back their willingness to lend to the construction industry (because of potentially rising risks). The real estate sector of course benefits, thanks to high transaction volumes and larger commissions. Mortgage brokers also enjoy volume and transaction related income. Even retailers with a focus on home furnishings and fittings are buoyant.
So standing back, almost everyone appears to benefit from higher prices. But is it really a free-kick? Well, for as long as the music continues to play, it almost is. The question becomes what happens if (or when) prices were to fall (remember that during the GFC, northern hemisphere prices fell in some places up to 40%, though since then prices in the US, Ireland and the UK have started to recover). Given our exposure to housing, there would be profound impacts on households, banks and the broader economy if values fell significantly.
But underlying all this, we have moved away from seeing housing as something which provides shelter and somewhere to live; to seeing it as just another investment asset class. This is probably an irreversible process, and part of the “financialisation” of society, given the perceived benefits to the economy and households, but we question whether the consequences are fully understood.
The Reserve Bank New Zealand expects new lending limits for Auckland property investors will reduce heightened financial system risk, and help moderate the Auckland housing market cycle, Deputy Governor Grant Spencer said today.
Speaking to the Northern Club in Auckland, Mr Spencer said that the resurgence in Auckland house prices over the past year has increased the Bank’s concerns about financial stability risks.
Mr Spencer said that Auckland prices have risen a further 24 percent over the past year, compared to 3 percent for the rest of the country.
“This has stretched the price-to-income ratio for the Auckland region to 9, double the ratio for the rest of New Zealand, and places Auckland among the world’s most expensive cities.
“New housing supply has been growing, but nowhere near fast enough to make a dent in the existing housing shortage. In the meantime, net migration is at record levels, and investors continue to expand their influence in the Auckland market.”
Mr Spencer said that investors are now accounting for 41 percent of Auckland house purchases, up 8 percentage points since late 2013. “We have seen a particular increase in purchases by smaller investors and investors reliant on credit. Half of the new lending to investors is being written at loan-to-value ratios of over 70 percent.
“This trend is increasing the risk inherent in the Auckland market. The increasing investor presence is likely to amplify the housing cycle, and worsen the potential damage from a downturn, both to the financial system and the broader economy.”
Mr Spencer said that macro-prudential policy can assist in moderating the risks to the financial sector and broader economy associated with Auckland’s housing market.
“A sharp fall in house prices has the potential to accentuate weakness in the macro-economy, particularly if banks tighten lending conditions excessively, leading to greater declines in asset markets and larger loan losses for the banks. A key goal of macro-prudential policy is to ensure that the banking system maintains sufficient prudential buffers to avoid this sort of contractionary behaviour in a downturn.
“Modifications to the Reserve Bank’s LVR policy, announced in May, are targeted specifically at Auckland residential investors. The speed limit has been eased for the rest of the country where housing markets are not subject to the same pressures.”
Mr Spencer said that the Bank recognises that low interest rates are contributing to housing demand pressures, and this is a factor the Bank takes into consideration when setting monetary policy. “However, the current weakness in export prices, economic activity and CPI inflation means that interest rate increases are likely to be off the table for some time,” he said.
He noted that the Bank’s macro-prudential policy is one of many measures aimed at reducing the imbalances in the Auckland housing market.
“Much more rapid progress in producing new housing is needed in order to get on top of this issue. Tax policy is also an important driver, and we welcome the changes announced in the 2015 Budget, including the two year bright-line test, the proposed non-resident withholding tax and the requirement for tax numbers to be provided by house purchasers.”
In a research note Moody’s says that last Tuesday, China’s official Xinhua News Agency reported that the People’s Bank of China (PBOC) had injected $48 billion of equity capital into China Development Bank Corporation and $45 billion into The Export-Import Bank of China (CEXIM).
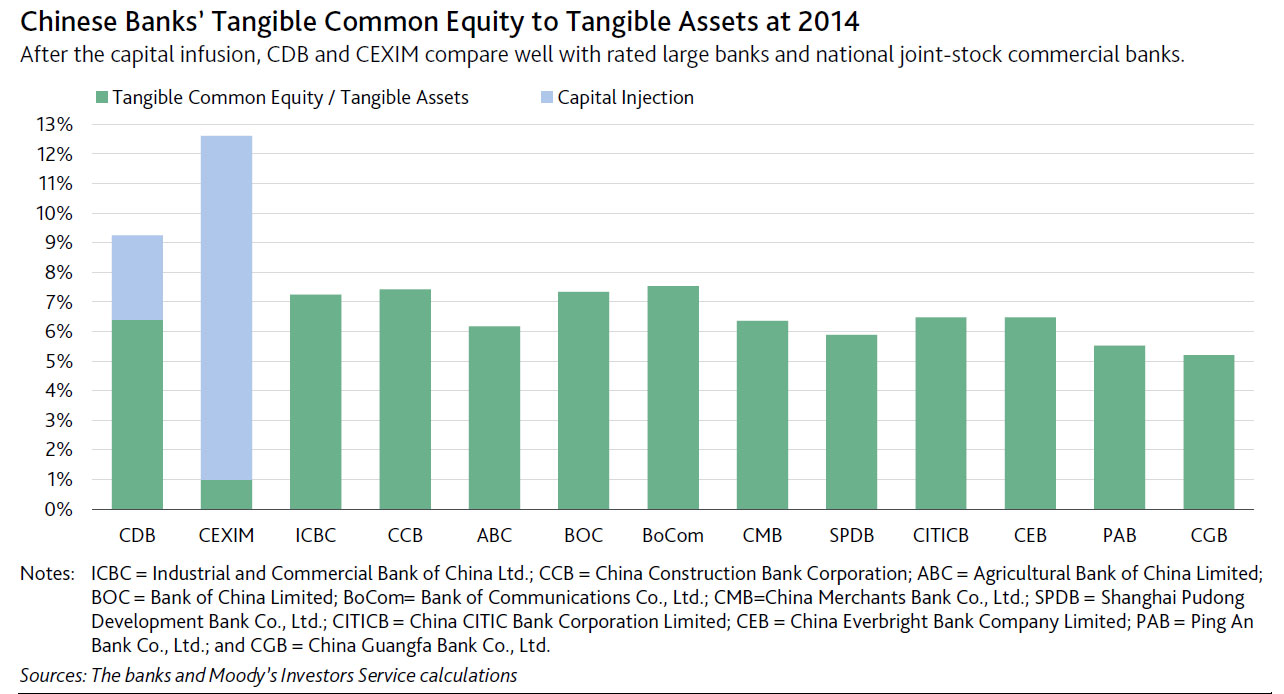
The injections were made through Wutongshu Investment Platform Co. Ltd., an entity that invests China’s foreign currency reserves. The massive equity infusions are credit positive for CDB and CEXIM. CDB’s capital adequacy ratio rises to about 11.8% from 9.1% under Basel III at year-end 2014, while CEXIM’s capital adequacy ratio, which it does not disclose, rises significantly. The injections also add to both banks’ loss-absorption capacity. Against the backdrop of heightened asset-quality risks at domestic banks, we think the enhanced loss-absorption implies that regulators are likely to impose minimum capital requirements on the banks.
The capital infusions are consistent with the Chinese government’s goal to strengthen Chinese policy lenders’ capital positions. After the injections, both banks’ ratios of tangible common equity to tangible assets compare well with those of the rated Chinese large and national joint-stock commercial banks.
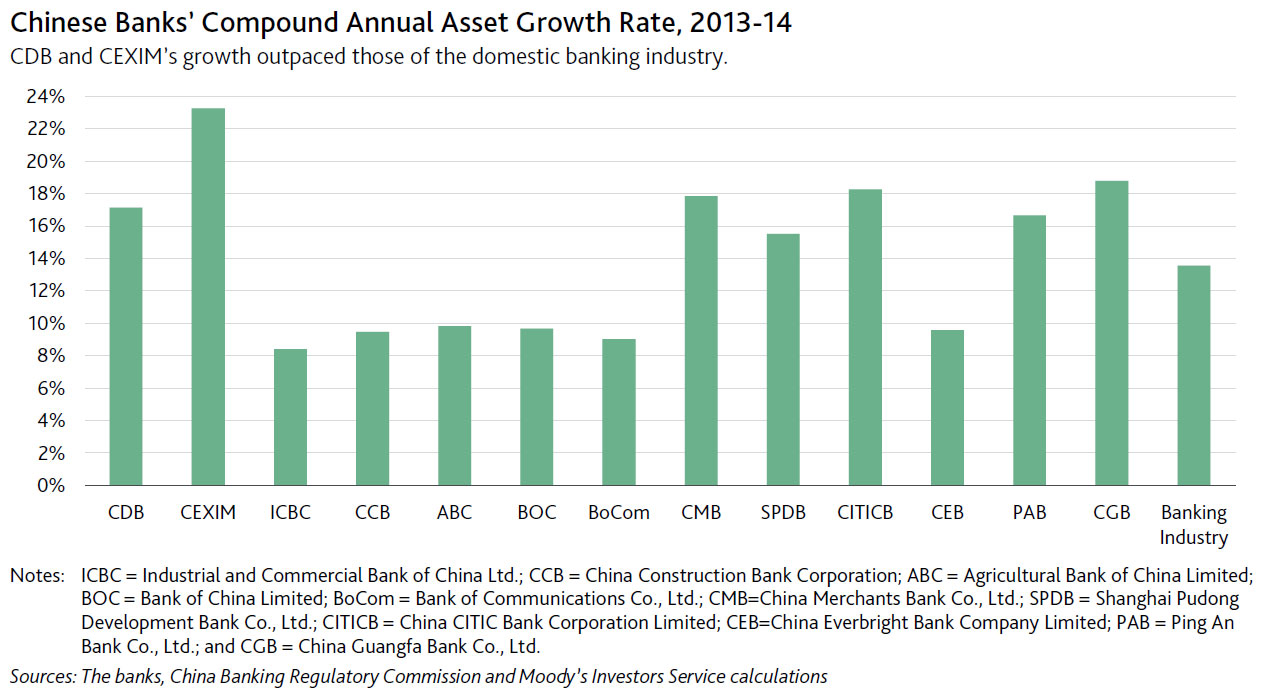
In the past several years, CDB and CEXIM have taken on key roles as policy-driven banks in financing priority projects and supporting the growth of Chinese corporates expanding overseas. For 2013-14, CDB’s compound annual asset growth rate was 17.1% and CEXIM’s 23.2%, compared with an average 13.6% rate for the Chinese banking industry during the same period
The capital injections demonstrate the Chinese government’s strong commitment to support the two lenders, whose policy roles are increasingly important for stimulating domestic economic growth. CDB and CEXIM are likely to take on greater credit exposure and their lending may have a greater strategic rationale rather than an economic one. For instance, the additional capital should facilitate CDB and CEXIM financing of overseas projects that are part of China’s One Belt, One Road initiative to boost infrastructure and economic connectivity across Eurasia.
Our assumption of a very high level of government support for CDB and CEXIM’s reflects strong government backing to offset their greater risks, given the two banks’ strategic importance as agents of the Chinese government in the implementation of development initiatives.
SMSFs are a great feature of the Australian superannuation system – they promote engagement and competition in the market. Currently SMSFs account for around one third of all superannuation funds under management. As of March this year, there were over 550,000 SMSFs with over one million members. This is up five per cent from the previous year.
There are several ways in which the ATO is trying to help trustees satisfy their obligations.
Borrowing
An issue of particular relevance to SMSFs is the recommendation in the Financial System Inquiry on leverage.
David Murray’s report has recommended a complete ban on limited recourse borrowing arrangements in the superannuation sector.
I am sure this issue is something a number of you have a keen interest in.
It would obviously be inappropriate for me to pre-empt what the Government proposes to do on this issue, as it forms part of the broader Government response to Murray. However, I do want to emphasise that we have been considering the issue carefully. We want to make sure the approach we adopt is proportionate to the risks identified.
We have all heard unhappy stories of property spruikers providing inappropriate advice to people, encouraging them to start up SMSFs in order to gear up and buy a flash new apartment off-the-plan. Then the property price plummets or the rent dries up, and the member is left either wiping out their super balances by liquidating other assets, and possibly losing the family home they’ve offered up as a personal guarantee. There may also be liquidity issues when funds move into pension phase.
Where this happens, it is clearly troubling. But these stories are very much the exception, not the rule.
The available statistics on limited recourse borrowing arrangements, while not perfect, tell us that limited recourse borrowing arrangements remain a very small proportion of SMSF assets, and are more often invested in commercial property than in residential high-rises.
Forty two per cent of limited recourse borrowing arrangements – or around $3.5 billion – were invested in residential property in mid-2013. To put this in context, that means that only 0.07 per cent of Australian residential property – perhaps 6,500 dwellings – were held by an SMSF through a limited recourse borrowing arrangement in 2013.
Leverage always carries risks. Lenders recognise this in their loan to valuation requirements.
And while we do not intend to ignore these risks, we need to make sure that our response is proportionate to the problem the FSI identified.
Assisting Self Managed Super Funds
The Government recognises that the majority of SMSF trustees try to do the right thing with regards to their compliance with the superannuation laws. The ATO, together with the SMSF industry and professional associations, are looking to assist trustees comply with their obligations by providing them with timely access to information that is relevant for them, at a time when it is most suitable for them. This includes:
• on-line education packages for SMSF trustees created in partnership with professional associations;
• short on-line SMSF trustee videos;
• SMSF Assist, which allows users to type specific SMSF questions online or into an app, and receive information relating to that topic when they need it;
• a subscription SMSF News service that includes case studies, legislative information and common question and answers.
Professionals are also supported in providing services to their clients. SMSF auditors have been provided with an express resolution service called ‘professional to professional’ and free software to help them complete audits and work through scenarios and case studies.
The methods that are in place ensure that we have enough support mechanisms available to help not only the large funds, but SMSFs as well.
As another corporate reporting season in Australia draws to a close, the broad trend has been moderately underwhelming earnings results, combined with a rise in the earnings repaid to shareholders in the form of a dividend.
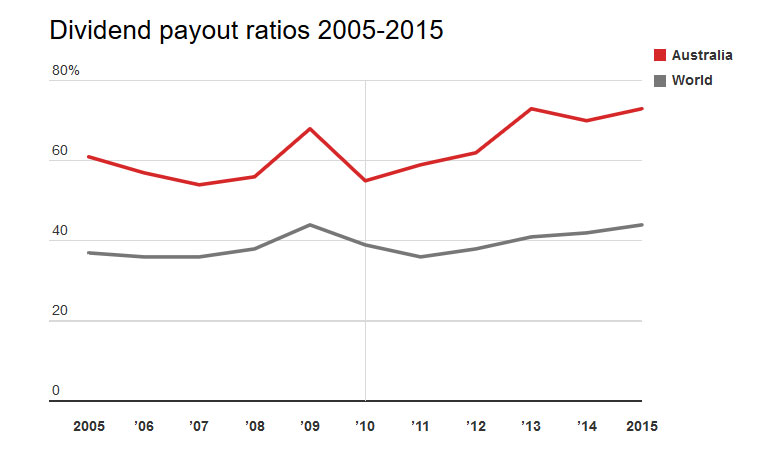
During this recent reporting period Australian firms returned, on average, 73% of their profits to shareholders as a dividend. This leaves only 27% of profits available to be retained in the firm to fund future growth.
As shown in the chart below, the ratio of profits paid out as dividends has increased in Australia from approximately 60% in 2005 to the current value of 73%. This result mirrors a recent international trend, however Australian firms continue to have high dividend payout ratios by international standards. The average firm around the world currently only returns 44% of profits to shareholders.
While many retail investors enjoy the regular revenue stream provided by the high yielding Australian equity market, this increasing trend in dividend payout ratios implies that dividends have consistently been growing at a faster rate than earnings; a phenomena that is not sustainable in the long-run and comes at the cost of economic growth.
A taxing issue
The large proportion of profits paid by Australian firms can largely be attributed to the imputation tax system, which was introduced in 1987 as a means of removing the double taxation of dividends. It allows companies to provide investors with a rebate for company tax that has been paid in the form of a franking credit attached to dividends.
Dividend imputation has achieved its intended aim of reducing the leverage of Australian firms. It’s an incentive for the use of equity rather than debt finance. Under the previous tax system, debt was more attractive than equity finance, resulting in the Australian economy having a large exposure to financial risk given the highly levered nature of many firms.
However, this reduction in financial risk has come at the cost of significant under-investment in the non-mining sectors of the Australian economy. The increased demand for dividends within an imputation tax system restricts firms’ access to their preferred source of financing: retained earnings.
The reinvestment of retained earnings creates multiplier effects that have a greater positive impact on the economy compared with dividends in the hands of individual shareholders. By retaining less of their earnings and under-investing compared with international counterparts, Australian firms run the risk of lagging behind.
Time for a policy fix?
Given the Australian government is currently focused on driving investment and growth in the non-mining sectors as the key mechanism for improving the current fiscal imbalance, consideration may have to be given to the future efficacy of the imputation tax system and the incentives it creates for large dividend payouts.
The imputation tax system is less relevant today than it was in 1987, given the increased integration between global markets and the growing reliance on international funding. As the tax benefits of the imputation tax system can only be accessed by Australian taxpayers, it creates a bias in favour of domestic investors.
For domestic superannuation funds with a marginal tax rate close to zero, the imputation tax system means they pay little, if any, tax on dividends, creating a big incentive for over-exposure to domestic equities. Given the structural changes that have occurred since 1987, the recent Financial System Inquiry noted that “the case for retaining dividend imputation is less clear than in the past”.
An alternative tax system that does not impose double taxation on investors while potentially reducing the current handbrake on economic growth is Singapore’s one-tier tax system. Under this system, profits are only taxed once at the corporate level. In Singapore dividends and capital gains are tax exempt. This simplified tax system reduces compliance costs and would ease the domestic investors’ current demand for dividends, and their associated franking credits, to be paid out.
Regardless of any taxation reform, investors need to be mindful that they can’t have their cake and eat it too with respect to dividends. The current trend of increasing the proportion of profits paid as dividends is not sustainable and has the potential to impede Australia’s long-run economic growth.
Author: Paul Docherty, Senior Lecturer, Newcastle Business School at University of Newcastle