The global economy is expanding at a moderate pace, but some key commodity prices are much lower than a year ago. Much of this trend appears to reflect increased supply, including from Australia. Australia’s terms of trade are falling nonetheless.
The Federal Reserve is expected to start increasing its policy rate later this year, but some other major central banks are continuing to ease policy. Hence, global financial conditions remain very accommodative. Despite fluctuations in markets associated with the respective developments in China and Greece, long-term borrowing rates for most sovereigns and creditworthy private borrowers remain remarkably low.
In Australia, the available information suggests that the economy has continued to grow. While the rate of growth has been somewhat below longer-term averages, it has been associated with somewhat stronger growth of employment and a steady rate of unemployment over the past year. Overall, the economy is likely to be operating with a degree of spare capacity for some time yet. Recent information confirms that domestic inflationary pressures have been contained. That should remain the case for some time, given the very slow growth in labour costs. Inflation is thus forecast to remain consistent with the target over the next one to two years, even with a lower exchange rate.
In such circumstances, monetary policy needs to be accommodative. Low interest rates are acting to support borrowing and spending. Credit is recording moderate growth overall, with growth in lending to the housing market broadly steady over recent months. Dwelling prices continue to rise strongly in Sydney, though trends have been more varied in a number of other cities. The Bank is working with other regulators to assess and contain risks that may arise from the housing market. In other asset markets, prices for equities and commercial property have been supported by lower long-term interest rates. The Australian dollar is adjusting to the significant declines in key commodity prices.
The Board today judged that leaving the cash rate unchanged was appropriate at this meeting. Further information on economic and financial conditions to be received over the period ahead will inform the Board’s ongoing assessment of the outlook and hence whether the current stance of policy will most effectively foster sustainable growth and inflation consistent with the target.
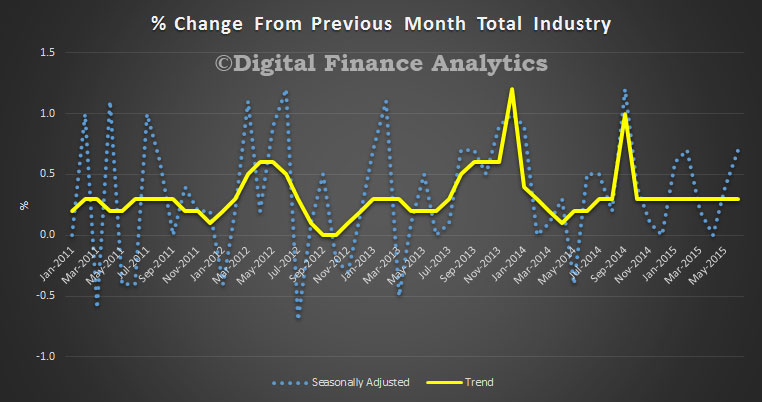
The monthly trend estimate for Australian retail turnover rose 0.3 per cent in June 2015 following a 0.3 per cent rise in May 2015. The trend estimate rose 4.7 per cent compared to June 2014.
In seasonally adjusted terms, there were rises in household goods retailing (2.2 per cent), other retailing (2.0 per cent) and cafes, restaurants and takeaway food services (1.2 per cent). There were falls in clothing, footwear and personal accessory retailing (-1.4 per cent), food retailing (-0.1 per cent) and department stores (-0.1 per cent).
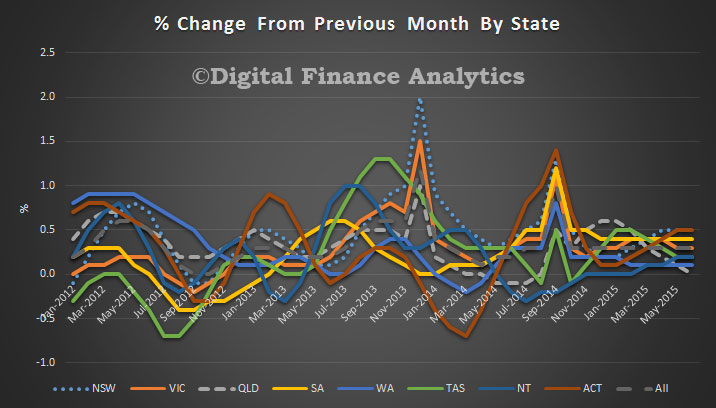
In seasonally adjusted terms there were rises in New South Wales (1.0 per cent), Victoria (0.8 per cent), South Australia (0.8 per cent), Queensland (0.2 per cent), Western Australia (0.2 per cent), the Northern Territory (0.8 per cent) and the Australian Capital Territory (0.2 per cent). Tasmania (0.0 per cent) was relatively unchanged.
The trend data shows a clearer pattern, with turnover in QLD falling to zero, ACT and NSW at the top rising, and the other states in between.
In seasonally adjusted volume terms, turnover rose 0.8 per cent in the June quarter 2015, following a rise of 0.6 per cent in the March quarter 2015.
Online retail turnover contributed 3.3 per cent to total retail turnover in original terms.
“The consumer guidance offers tips to help consumers get the best outcomes when using comparator websites. The industry guidance sets out the standards that the ACCC expects comparator websites to meet,” ACCC Deputy Chair Delia Rickard said.
“Comparator websites can drive competition and assist consumers to make informed purchasing decisions when comparing what are often quite complex products. However, the ACCC is concerned that poor conduct by some industry participants can mislead consumers,” Ms Rickard said.
The consumer guidance sets out tips that can assist consumers to understand and benefit from comparator websites, including:
Making sure they know what is being compared
Understanding commercial relationships
Know what their needs are.
The industry guidance is targeted at the operators of comparator websites and businesses whose products are listed on them. This guidance sets out how industry can comply with competition and consumer protection laws, including setting out three guiding principles of:
Facilitating honest, like for like comparisons
Being transparent about commercial relationships
Clearly disclosing who and what is being compared.
“Operators should carefully read this guidance as there will be no excuse for non-compliance with the Australian Consumer Law, and the ACCC will continue to take action where necessary,” Ms Rickard said.
The ACCC’s recent review of comparator websites was prompted by consumer and business complaints of misleading information being provided to consumers. The ACCC found that a number of websites, in particular those comparing energy plans, included information that may mislead consumers as to the extent of the comparison service, the amount of savings that could be achieved and the impartiality of the comparisons.
Following contact by the ACCC, website operators quickly implemented appropriate changes to remove or amend the potentially misleading information.
In November 2014, the ACCC released a report The Comparator Website Industry in Australia. The report set out the ACCC’s concerns over a lack of transparency in regards to the:
extent of the comparison service, including market coverage
savings achieved by using the comparison service
comparison services being unbiased, impartial or independent
value rankings
undisclosed commercial relationships affecting recommendations to consumers
content and quality assurance of product information.
Extract from a speech by Governor Powell at the Brookings Institution, Washington. The move to fully electronic trading raises important questions about the benefits of fully automated high-speed trading which may lead to industry concentration and liquidity fracturing as the arms-race continues. So it is a good time for market participants and regulators to collectively consider whether current market structures can be improved for the benefit of all.
Treasury markets have undergone important changes over the years. The footprints of the major dealers, who have long played the role of market makers, are in several respects smaller than they were in the pre-crisis period. Dealers cite a number of reasons for this change, including reductions in their own risk appetite and the effects of post-crisis regulations. At the same time, the Federal Reserve and foreign owners (about half of which are foreign central banks) have increased their ownership to over two-thirds of outstanding Treasuries (up from 61 percent in 2004). Banks have also increased their holdings of Treasuries to meet HQLA requirements. These holdings are less likely to turn over in secondary market trading, as the owners largely follow buy and hold strategies. Another change is the increased presence of asset managers, which now hold a bigger share of Treasuries as well. Mutual fund investors, who are accustomed to daily liquidity, now beneficially own a greater share of Treasuries.
Perhaps the most fundamental change in these markets is the move to electronic trading, which began in earnest about 15 years ago. It is hard to overstate the transformation in these markets. Only two decades ago, the dealers who participated in primary Treasury auctions had to send representatives, in person, to the offices of the Federal Reserve Bank of New York to submit their bids on auction days. They dropped their paper bids into a box. The secondary market was a bit more advanced. There were electronic systems for posting interdealer quotes in the cash market, and the Globex platform had been introduced for futures. Still, most interdealer trades were conducted over the phone and futures trading was primarily conducted in the open pit.
Today these markets are almost fully electronic. Interdealer trading in the cash Treasury market is conducted over electronic trading platforms. Thanks to advances in telecommunications and computing, the speed of trading has increased at least a million-fold. Advances in computing and faster access to trading platforms have also allowed new types of firms and trading strategies to enter the market. Algorithmic and high-frequency trading firms deploy a wide and diverse range of strategies. In particular, the technologies and strategies that people associate with high frequency trading are also regularly employed by broker-dealers, hedge funds, and even individual investors. Compared with the speed of trading 20 years ago, anyone can trade at high frequencies today, and so, to me, this transformation is more about technology than any one particular type of firm.
Given all these changes, we need to have a more nuanced discussion as to the state of the markets. Are there important market failures that are not likely to self-correct? If so, what are the causes, and what are the costs and benefits of potential market-led or regulatory responses?
Some observers point to post-crisis regulation as a key factor driving any decline or change in the nature of liquidity. Although regulation had little to do with the events of October 15, I would agree that it may be one factor driving recent changes in market making. Requiring that banks hold much higher capital and liquidity and rely less on wholesale short-term debt has raised funding costs. Regulation has also raised the cost of funding inventories through repurchase agreement (repo markets). Thus, regulation may have made market making less attractive to banks. But these same regulations have also materially lowered banks’ probabilities of default and the chances of another financial crisis like the last one, which severely constrained liquidity and did so much damage to our economy. These regulations are new, and we should be willing to learn from experience, but their basic goals–to make the core of the financial system safer and reduce systemic risk–are appropriate, and we should be prepared to accept some increase in the cost of market making in order to meet those goals.
Regulation is only one of the factors–and clearly not the dominant one–behind the evolution in market making. As we have seen, markets were undergoing dramatic change long before the financial crisis. Technological change has allowed new types of trading firms to act as market makers for a large and growing share of transactions, not just in equity and foreign exchange markets but also in Treasury markets. As traditional dealers have lost market share, one way they have sought to remain competitive is by attempting to internalize their customer trades–essentially trying to create their own markets by finding matches between their customers who are seeking to buy and sell. Internalization allows these firms to capture more of the bid-ask spread, but it may also reduce liquidity in the public market. At the same time it does not eliminate the need for a public market, where price discovery mainly occurs, as dealers must place the orders that they cannot internalize into that market.
While the changes I’ve just discussed are unlikely to go away, I believe that markets will adapt to them over time. In the meantime, we have a responsibility to make sure that market and regulatory incentives appropriately encourage an evolution that will sustain market liquidity and functioning.
In thinking about market incentives, one observer has noted that trading rules and structures have grown to matter crucially as trading speeds have increased–in her words, “At very fast speeds, only the [market] microstructure matters. Trading algorithms are, after all, simply a set of rules, and they will necessarily interact with and optimize against the rules of the trading platforms they operate on. If trading is at nanoseconds, there won’t be a lot of “fundamental” news to trade on or much time to formulate views about the long-run value of an asset; instead, trading at these speeds can become a game played against order books and the market rules. We can complain about certain trading practices in this new environment, but if the market is structured to incentivize those practices, then why should we be surprised if they occur?
The trading platforms in both the interdealer cash and futures markets are based on a central limit order book, in which quotes are executed based on price and the order they are posted. A central limit order book provides for continuous trading, but it also provides incentives to be the fastest. A trader that is faster than the others in the market will be able to post and remove orders in reaction to changes in the order book before others can do so, earning profits by hitting out-of-date quotes and avoiding losses by making sure that the trader’s own quotes are up to date.
Technology and greater competition have led to lower costs in many areas of our economy. At the same time, slower traders may be put at a disadvantage in this environment, which could cause them to withdraw from markets or seek other venues, thus fracturing liquidity. And one can certainly question how socially useful it is to build optic fiber or microwave networks just to trade at microseconds or nanoseconds rather than milliseconds. The cost of these technologies, among other factors, may also be driving greater concentration in markets, which could threaten their resilience. The type of internalization now done by dealers is only really profitable if done on a large scale, and that too has led to greater market concentration.
A number of observers have suggested reforms for consideration. For example, some recent commentators propose frequent batch auctions as an alternative to the central limit order book, and argue that this would lead to greater market liquidity. Others have argued that current market structures may lead to greater volatility, and suggested possible alterations designed to improve the situation. To be clear, I am not embracing any particular one of these ideas. Rather, I am suggesting that now is a good time for market participants and regulators to collectively consider whether current market structures can be improved for the benefit of all.
Between 2001 and 2010 roughly 1.7 million Australians dropped out of home ownership and shifted back to renting. More than one-third did not return by 2010. These statistics, from the Household, Income and Labour Dynamics in Australia (HILDA) survey, reflect increasingly insecure jobs, the prevalence of marital breakdown and lone person households, widening income inequalities and the high levels of debt accompanying spiralling real house prices.
Rather than climbing a ladder of housing opportunity that heads in an upward direction only, a growing number of Australians are precariously positioned on the edges of home ownership. We can think of the edges of ownership as a permeable, contested border zone between owning and renting, where households juggle their savings, spending and debt as they attempt to retain a foothold on the housing ladder.
And according to new research comparing Australia with the UK, policy settings play an important role in determining who can and can’t manage to stay in the home ownership game.
The research used three panel surveys – the HILDA survey, the British Household Panel Survey (BHPS) and its successor Understanding Society. We tracked the ownership experience of 1,907 Australian and 674 British individuals that began periods of home ownership between 2002 and 2010 (a period that covers the enormous disruption caused by the global financial crisis). In each year we have recorded their tenure status.
The figure below shows the proportion of people exiting ownership year on year as a spell of ownership lengthens (the maximum spell length in this study being 8 years). For example, 8% of those Australians that had managed to sustain three consecutive years of ownership shifted into the rental sector in the following year. In contrast, 6% of British home owners transitioned into rental housing after three successive years of ownership.
Despite the turbulent British housing market conditions, and a more serious economic recession following the global financial crisis, Australians’ experiences of home ownership appear more precarious. In fact, in all but one year the exit rate is higher in Australia. For a randomly selected Australian moving into home ownership between 2002 and 2010 the chances of “surviving” as a home owner beyond seven years are only 59%. The chances of “survival” are somewhat higher at 68% in the UK. The edges of ownership appear more permeable in Australia.
Exit rate Australia and UK, 2002–2010
Authors’ own calculations from the 2002–10 HILDA Survey, 2001–08 BHPS and Understanding Society wave 2.
For a minority of individuals in the surveys, labour market mobility might be a factor encouraging a temporary shift out of ownership, as people relocate to take advantage of job opportunities. However, it is clear from the data that the majority of moves out of home ownership are related to financial stress. For example, 15% of those Australians leaving home ownership reported difficulties in paying utility bills in one or more years before exit, while only 7% of those with enduring ownership spells reported such difficulties. 9% of departing Australians fell behind on their mortgages, but only 2% of those with enduring ownership spells testified to such difficulties. Similar patterns are revealed in the British data.
This is no surprise. What is striking is that financial stress is more likely to cause a loss of home ownership status in Australia than it is in Britain – a puzzling feature of the findings which cannot be explained by differences in the personal characteristics of Australian and British members of the panels. If, for instance, ownership reached further down the Australian income distribution we might expect more insecure housing experiences among Australian home buyers. But controlling for these possible differences does not explain our results.
Why is Australia different?
There are instead signals in the data which suggest institutional differences across the two countries are at play. There are two factors that could disproportionately draw marginal Australian owners into the rented sector, while propping up the ownership ideals of their British counterparts.
First, and most obviously, the rental sectors of the two countries are quite different, and appear to have a different function at the edges of ownership. The higher likelihood of exit from ownership in Australia may reflect the role of the larger unregulated Australian private rental sector in “oiling the wheels” between renting and ownership. The size, geography and diversity of the Australian private rented sector make it relatively easy for households to adjust housing costs to income by moving before mortgage stress becomes excessive.
Arguably, therefore, renting performs a risk management role, offering temporary, relatively easily accessible, refuge for those on the edges of home ownership. From this perspective, the earlier exit of Australian households who experience financial stress may be seen as the product, in part, of a well-functioning housing system in which the rented sector offers a general safety net. This does occur in the UK, but to a much more limited extent, via a small social rented sector which offers a ‘soft landing’ for households with some very specific (largely health-related) housing needs.
Second, however, there are differences in the two countries’ social security systems. Historically, British home owners with particular financial needs (such as the loss of all earned income) have been eligible for what is now known as support for mortgage interest (SMI). This may postpone or prevent the need to sell up. There is no such safety net for mortgagors in Australia.
Whether, in the long run, either institutional “solution”(growing the rental sector or subsidising mortgagors at risk of arrears) is satisfactory is a topic for policy makers to discuss.
Other options include shared ownership and equity share, which, if provided at scale could offer an escape valve for financially stretched home owners, perhaps improving on the diversity offered by the Australian private rental sector.
On the other hand, if households in either country have the need or appetite to swap the costs of owning for those of renting or shared ownership regularly or routinely, then it must be time to consider the financial instruments that might enable them to do so without incurring the massive transactions costs, and domestic upheaval, of selling up and moving into a rental property.
Authors: Gavin Wood, Professor of Housing at RMIT University, Melek Cigdem-Bayra, Research Fellow at RMIT University, Rachel On, Principal Research Fellow, Bankwest Curtin Economics Centre at Curtin University, Susan Smit, Honorary Professor of Geography at University of Cambridge.
Suncorp increased its interest rates by up to 0.27% p.a. for standard variable and access equity (to 5.81% p.a.) and back to basics rates (to 5.23% p.a.) for new and existing investor loans, effective 31 August.
Bank of Queensland has lifted home investor loan rates by 0.29% effective August 10. It will have more impact on existing borrowers than new however because its “Clearpath” loans – with discount of more than 1 per cent on its variable rate – are unchanged. Most new mortgages are offered under this product, applicable to both owner occupied and investor loans and they have headroom to grow their book – allowing for the 10% speed limit on investor loans.
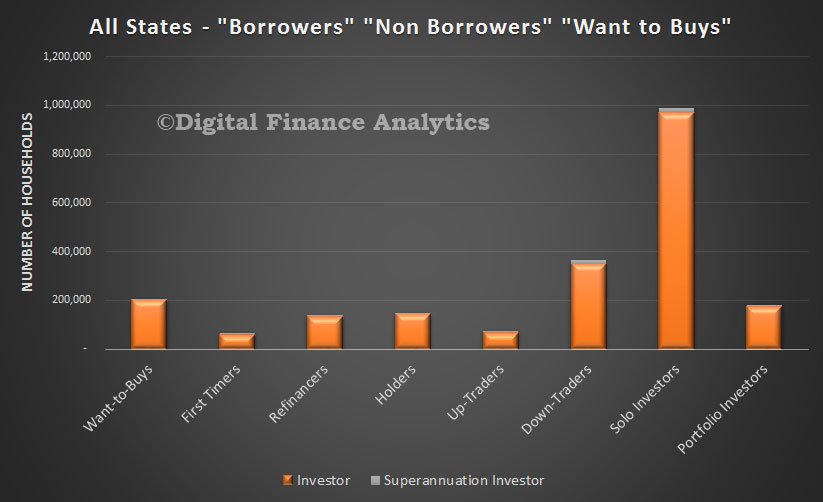
Continuing our analysis of the latest DFA household surveys, we look at the investor segment. You can find our segment definitions here. We start by estimating the number of investors in the market. Overall, there are 2.16m households with investment properties, up from 2.01m in 2014. The growth is explained by the entry of increasing numbers of first time buyers, and more down traders becoming active.
We also see the continued rise in the number of portfolio investors – households with a portfolio of investment properties, to nearly 200,000. A significant proportion will have more than five properties. Around 75% of portfolio investors expect to transact within the next 12 months, 49% of solo investors and 52% of down traders.
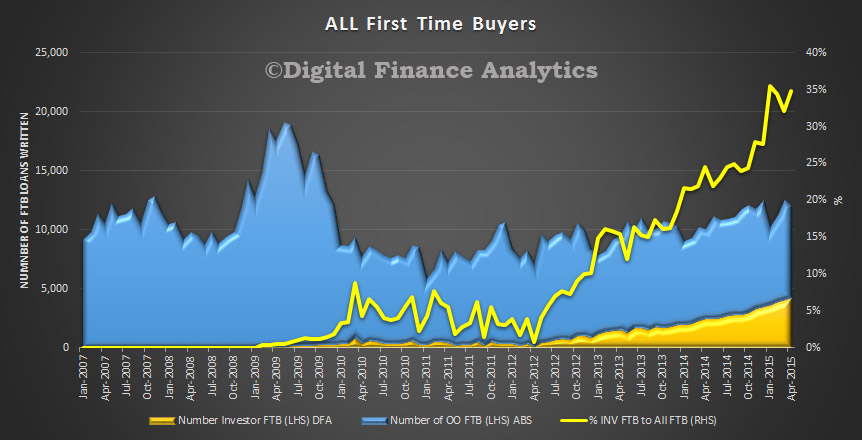
First time buyers are increasingly going direct to the investment sector, with more than 50% of first time buyers in Sydney following this path. We have explained why this is occurring in a recent video blog.
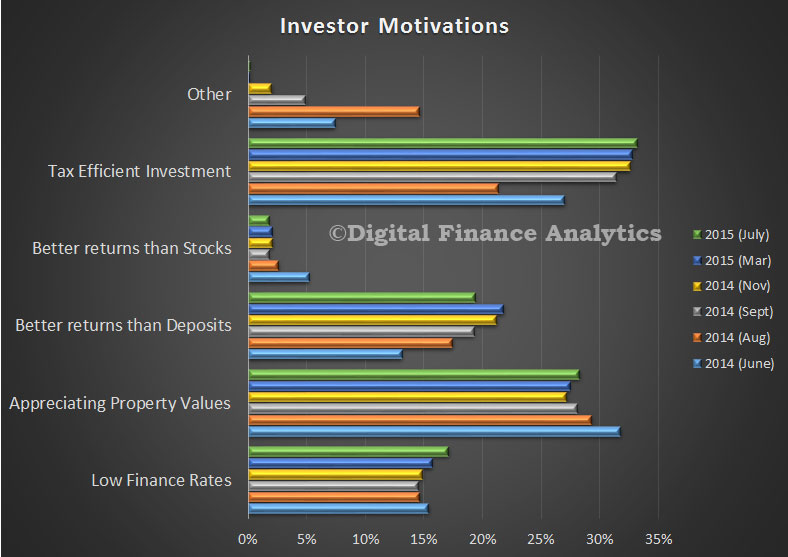
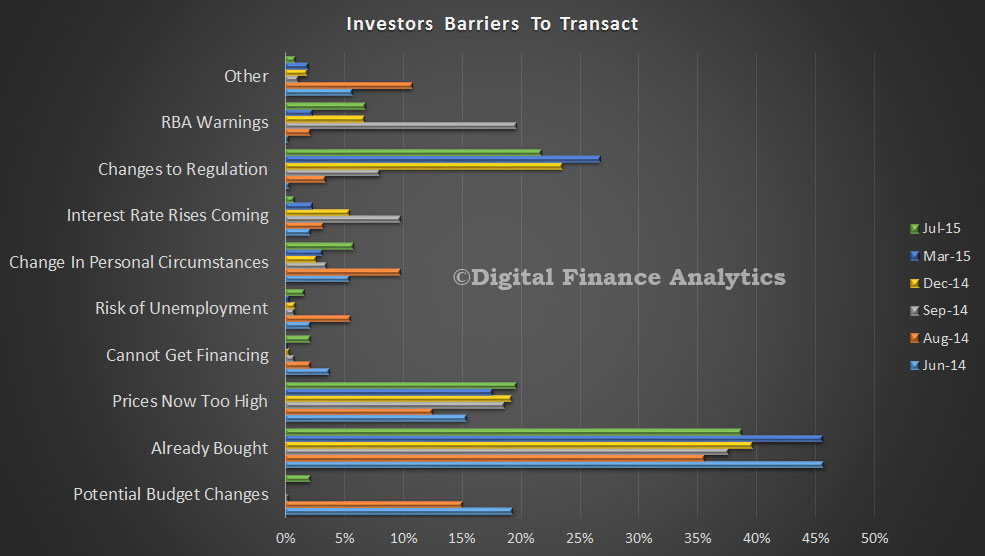
The latest motivation data suggests that appreciating property value, and tax effectiveness remain the main drivers to transact. They are also influenced by low finance rates, and the ability to get better returns than from deposits. A rising number of investors are now relying on rental income for future living expenses, this is especially true among down traders, who need higher returns than bank deposits. Some barriers to transact do exist, the main issues are that they have already bought, and are not considering another purchase (38%), that prices are getting too high (20%) and some concerns about the changing regulatory environment – leading to availability and price of finance (22%). But concerns about rising interest rates, budget changes and RBA warnings are relatively low. We did note a slight rise in those unable to get finance – the main reason was that the transaction LVR was too high to meet current underwriting rules.
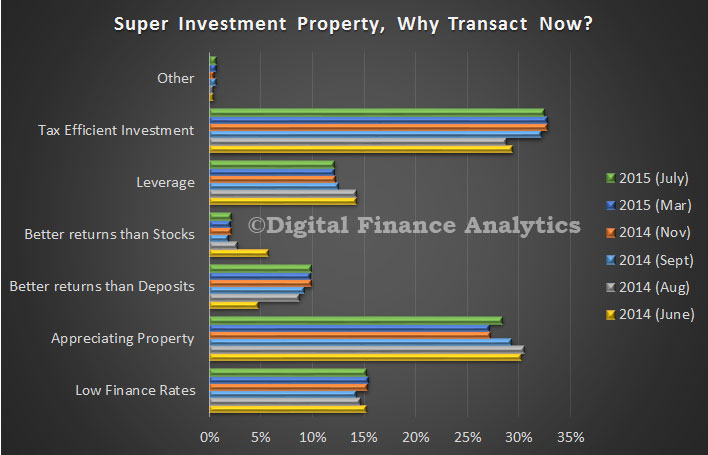
Finally, we continue to see a rise in property purchased through superannuation. Tax efficiency and appreciating property values, backed by low finance rates are key. We think that about 5% of transactions are now within superannuation.
So it reconfirms that property is really just another investment asset class, and many are using the current gearing and capital gains tax breaks quite logically. As we have discussed before, this is distorting the overall marker, and excluding many potentially willing owner occupied purchasers from the market.
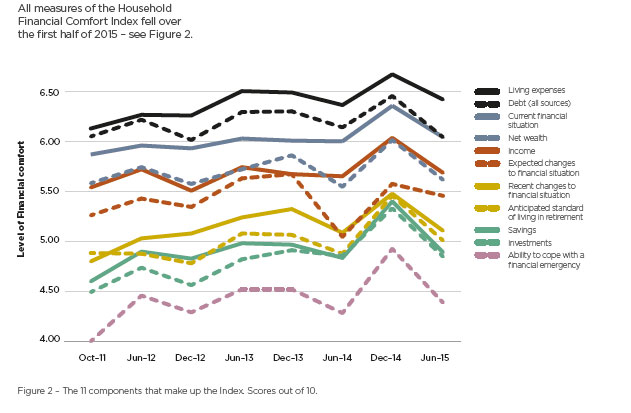
Household confidence in coping with a financial emergency (loss of income) fell 11% in the six months to June 2015, largely contributing to a 6% fall in overall household financial comfort, according to ME’s latest Household Financial Comfort Report. The findings are similar to DFA’s Household Finance Confidence Index, which fell to a new low in June.
Linked to the fall in financial emergency-preparedness are big falls in comfort with cash savings(down 9%) and income (down 6%) in the six months to June 2015. A lack of comfort about cash savings and the ability to cope with a financial emergency is particularly evident among single parents whose overall financial comfort fell 20% to 4.46 out of 10 during the first half of 2015. Decreased comfort with cash savings is likely to be caused by weak income growth – with only a third of respondents reporting household income gains in the past year – together with increased concerns about the job market. While job-security has remained steady at 71%, job availability fell 9 points with 56% of the workforce indicating it would be difficult finding another job within two months if they became unemployed, compared to 47% six months ago. Concern about savings and incomes has also resulted in a rise in the number of households citing ‘the cost of necessities’ as their biggest worry, up 3 points to 50% of households. Other major worries for households were ‘having enough cash on hand’, rising 3 points to 37% and ‘being able to make ends meet’ rising 5 points to 34% of households.
Renters feeling the financial pinch. Overall financial comfort is down 12% among renters to 4.35 out of 10, to remain well below the comfort of home-owners (down5% to 6.52) and households paying off mortgages (down 3% to 5.28). The fall in comfort among renters may be a reflection of the financial difficulty first home buyers are experiencing getting into the property market, coupled with a continued rise in rents across many states, particularly in some major capital cities.
A tale of two generations. The latest data also tells a tale of two generations, with Gen Ys (aged 18-34) and pre-retirees (aged 50-59) reporting the biggest falls in overall financial comfort (both down 10%), but for very different reasons. While Gen Ys (and single parents) are more concerned about their available cash savings, at the other end of the age spectrum, pre-retirees are most concerned about their expected standard of living in retirement as well as their investments. Falling financial comfort for older generations is also linked to falls in comfort with investments (down 9% on average, with the largest fall of 13% for Builders (aged 75+)) and increased risk aversion in the current low interest environment. A corollary of this is a fall in financial comfort in anticipated standard of living in retirement, down across all households by 8% to 5 out of 10, but by 16% to 4.5 among pre-retirees, with very high levels of comfort expected by self-funded retirees (7.14 out of 10) and significantly lower comfort levels reported among those totally/partly dependent on government pensions (3.38 and 5.15 out of 10 respectively).
Other findings include:
The labour-force: Self-employed workers reported the biggest fall in financial comfort (more than 20%) to the lowest level seen for this group since the survey commenced in late 2011, compared to a drop of 7% among full-time employees.
Regional variations: Comfort across all mainland states fell with relatively bigger falls in SA (down 10%), WA (down 9%) and NSW (down 8%). After a relatively small fall of 4%, comfort in Victoria was highest of the mainland states reflecting relatively higher levels of comfort across a range of drivers and in particular the ability to handle a financial emergency and comfort with cash savings.
Metro vs regional: After a fall of 9%, those living in regional areas continue to report significantly lower comfort (index of 5.18 out of 10), than city households (down 5% to an index of 5.52), with the highest comfort households located in Melbourne and Sydney.
Risk adverse: There has been a significant increase in financial risk aversion – with those people avoiding risk (39%) exceeding those willing to take risk (17%) by 22 percentage points – equal to its previous highest level in recorded in December 2012.
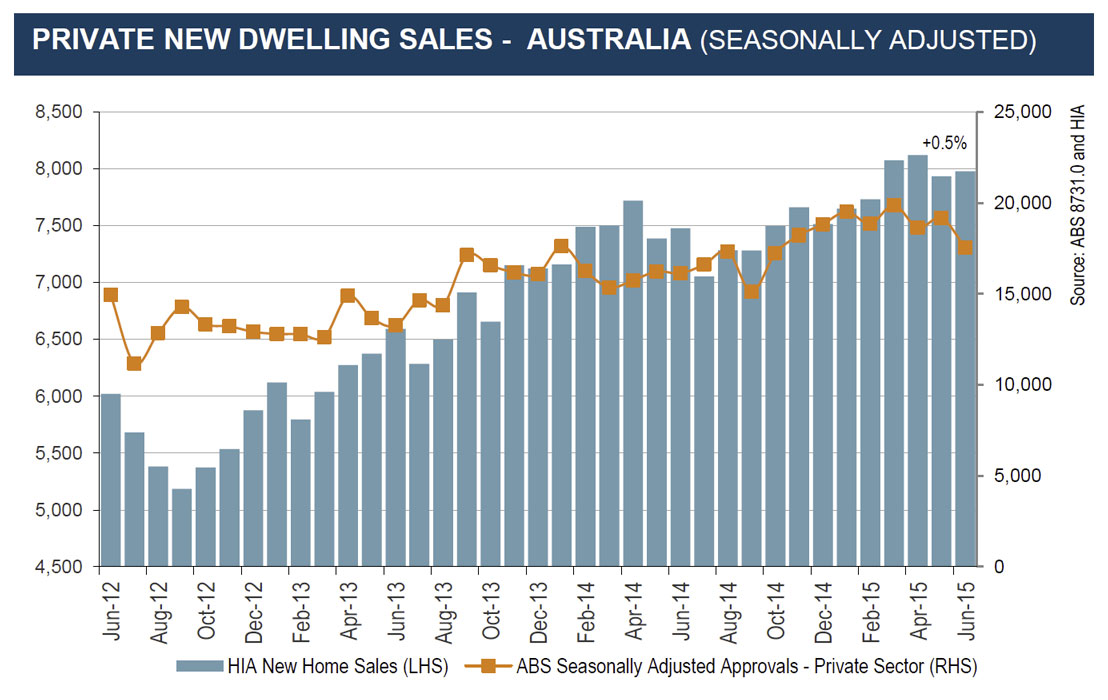
The HIA New Home Sales Report, a survey of Australia’s largest volume builders, recorded its fifth rise in six months in June 2015. Total seasonally adjusted new home sales increased by 0.5 per cent in June. Detached houses drove the modest increase in new home sales with a 1.7 per cent rise offsetting a 2.9 per cent decline in the sale of multi-units.
The HIA say New South Wales and Victoria continue to display upward momentum in detached house sales, but the other three mainland states are heading in the opposite direction. In the month of June 2015 detached house sales increased by 3.5 per cent in NSW, 1.5 per cent in Victoria, and 4.2 per cent in Queensland. Detached house sales fell by 2.0 per cent in South Australia in June, while in Western Australia sales eased by 0.9 per cent. In the June 2015 quarter detached house sales increased by 7.9 per cent in NSW and 0.6 per cent in Victoria. Sales fell for the quarter in Queensland (-7.0 per cent), SA (-10.2 per cent), and WA (-3.1 per cent).
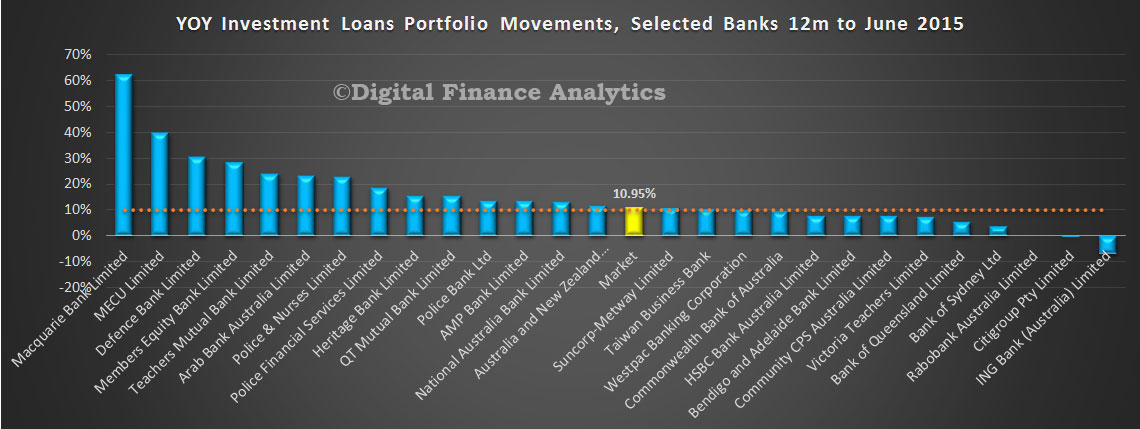
Now we have the data from ANZ, we have revised the APRA data sets for the last year, to see the true position with regards to movements in the home loans portfolios. This post revises that made Friday, (though the data is correct based on the released APRA figures.
We have adjusted the ANZ and market total lines by the changes ANZ announced late Friday. As a result, ADI market growth for investment loans is 10.95% (based on the total movements over the 12 months to June 2015). A number of players remain well above the 10% speed limit.
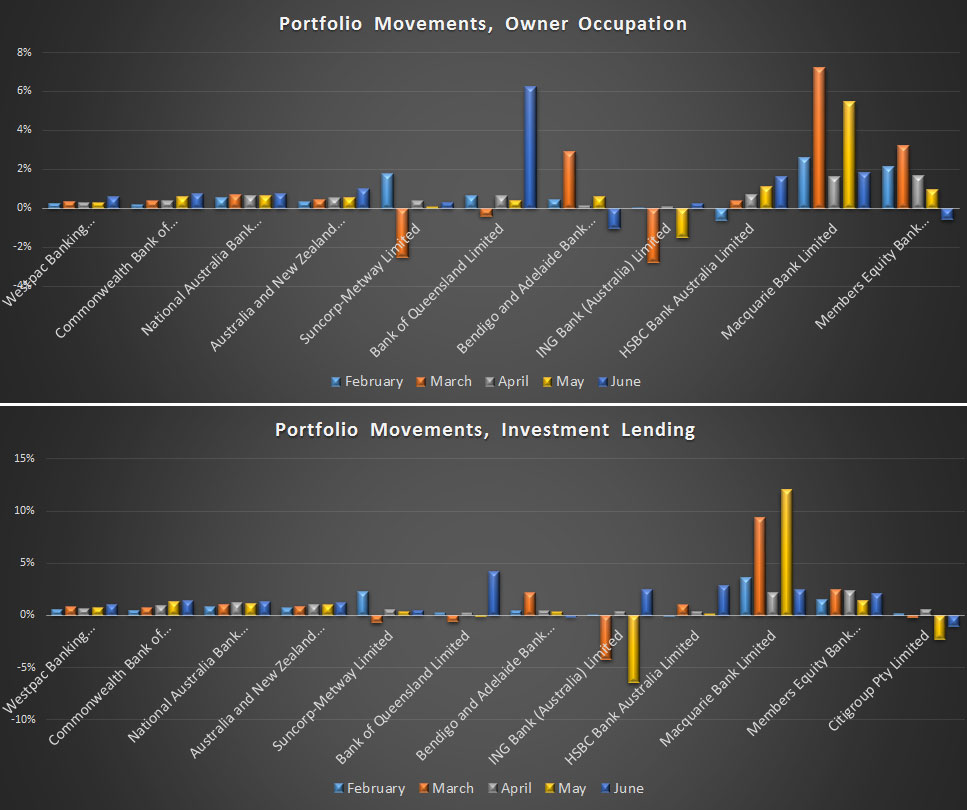
The next charts show the portfolio movements for both owner occupied and investment loans.
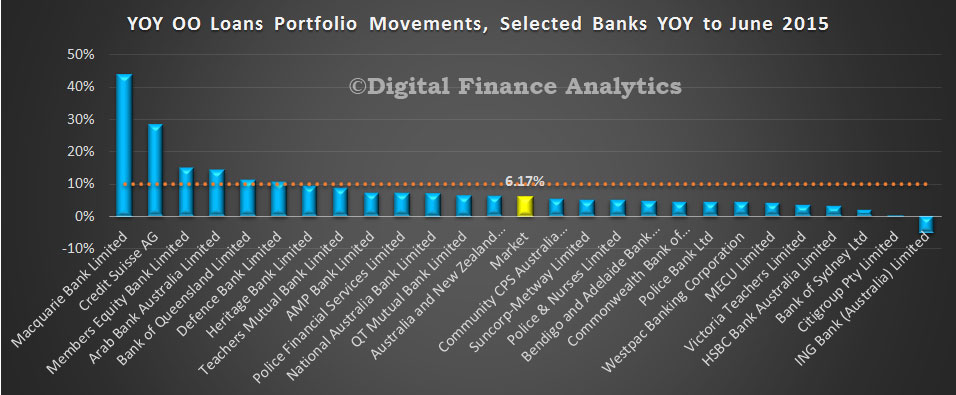
Finally, here is the revised owner occupied loans data. Annual growth 6.17%. There is no 10% speed limit from the regulator, but we put the line in for comparison purposes.
A final observation, the investment loan growth depends how you calculate it, and where you draw the numbers from. Our preferred approach is to take the growth each month, and add 12 months data together to make the 10.95%. The other approach is to take the data from June 2015, and compare it with July 2014. In that case the market growth is 10.6%. Some analysts gross up the last three months to give annualised rate of over 13%. The RBA data (which includes the non-banks) shows a 12 month growth rate of 10.4% (both original and seasonally adjusted) by summing the monthly changes, or 12.4% if you take the last 3 months data and annualise that. The conclusion is that investment loan growth rates were showing no signs of slowing to June. Lets see what happens in future months. Also, consider this. APRA imposed the speed limit at 10%, but with no explanation why 10% was a good number. DFA is of the view that the hurdle rate should be significantly lower to have any meaningful impact.