First Time Buyers Still Want Property

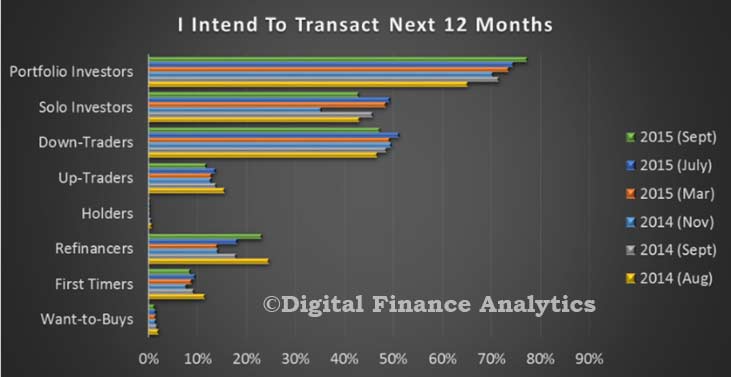
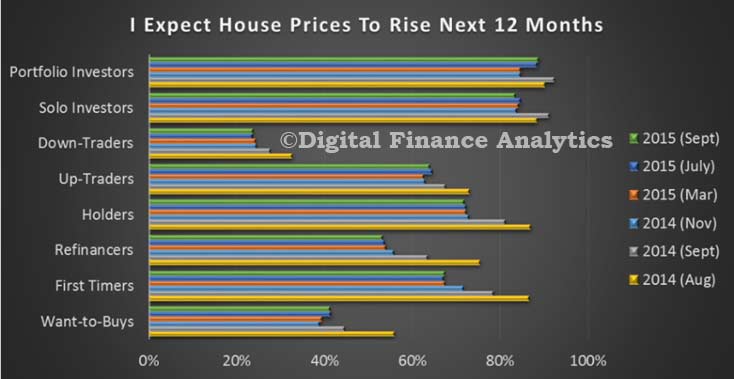
Continuing with data from the latest edition of the Property Imperative, today we look at first time buyers. Our latest survey identified about 319,000 households who are first time buyers. The majority are seeking to purchase, or have recently purchased an owner occupied property (80%), the remainder preferring an investment property. Only 9% of these households expect to transact within the next 12 months, despite 67% believing house prices are set to rise in the same term.

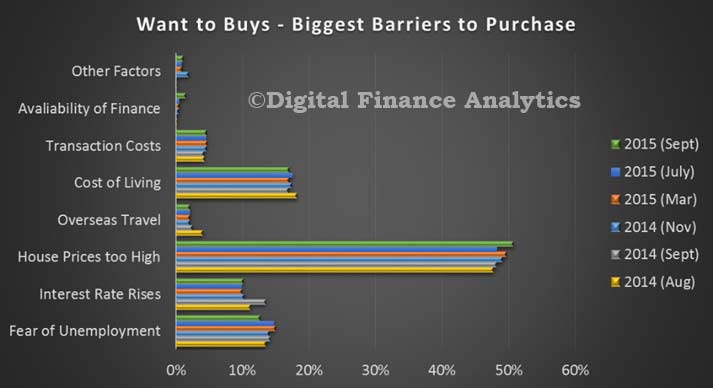
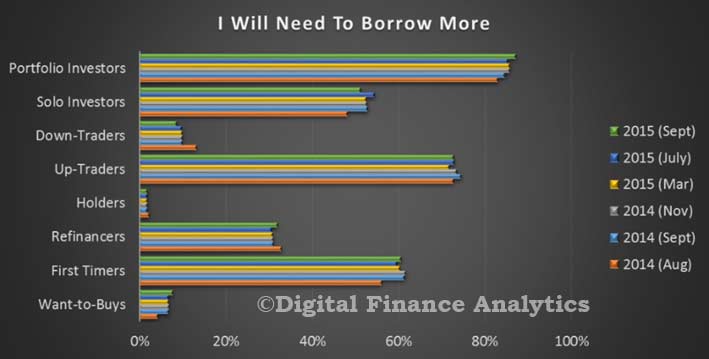
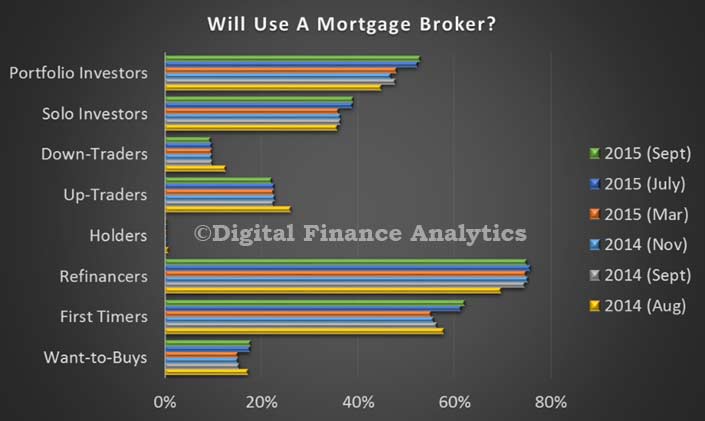
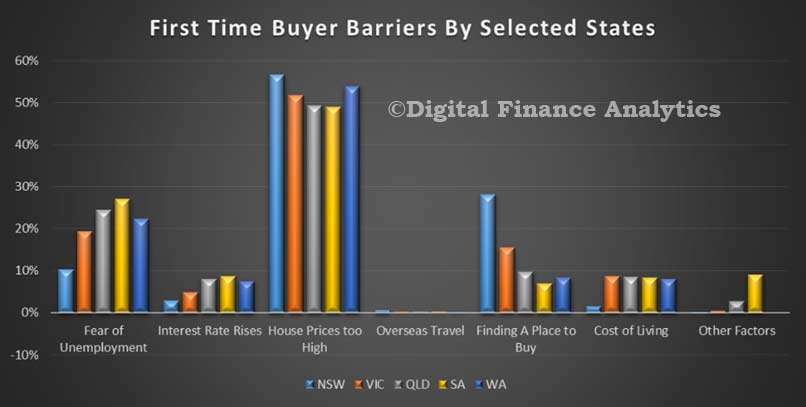
The biggest barrier to purchase include high house prices (52%), fear of unemployment (11%), finding the right property (22%) and rising costs of living (6%). In terms of financing 61% of households will need to borrow more than they can currently obtain to transact, whilst 62% of households will consider using a mortgage broker to assist with the finance arrangements.

DFA-Sept-FTB-Barriers
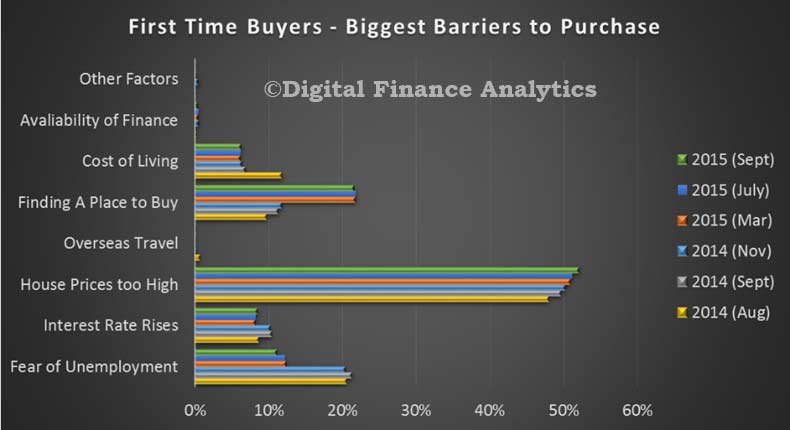
The barriers do vary by state. In NSW, first time buyers were finding it more difficult to find a suitable place to buy (28%), whereas costs of living were less significant here. In WA, fear of unemployment (22%) and high prices (54%) were the most significant barriers.

DFA-Sept-FTB-States
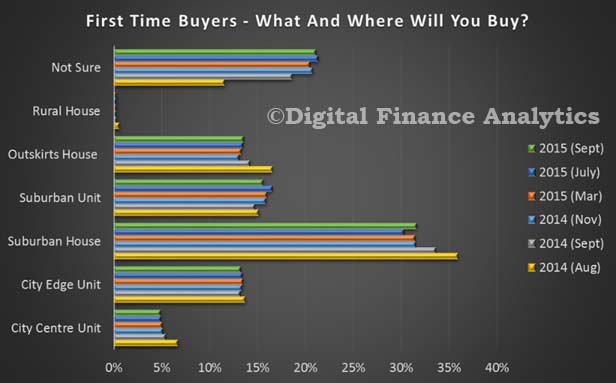
First time buyers are split between looking for a house or a unit (in Sydney more are looking for a unit). A greater proportion (21%) this time were simply not sure what to buy, or where to buy, a rise from 4% in 2013. A greater proportion of first time buyers in Sydney are likely to buy, or have bought a unit, rather than a house. In the other states, the preference for a house is stronger, though in Melbourne and Brisbane, it continues to drop. In Perth, house preferences are stronger.

DFA-Sept-FTB-Buy
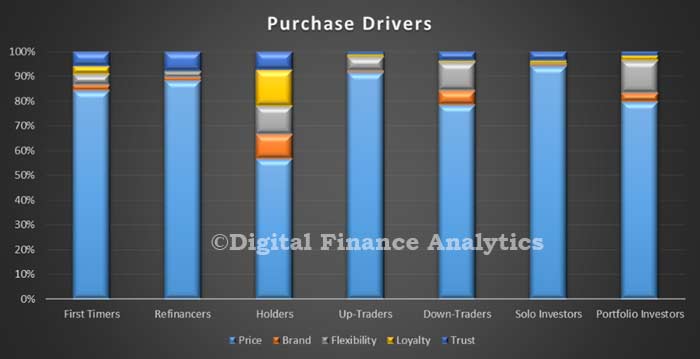
When we compared the elements which influence a buying decision, we see a stronger focus on price in 2015. Schools are important, then access to transport. We see consideration of absolute commute times to be less important now than in 2010. However, almost all elements are traded away because of high prices.

Whilst the ABS tweaked their estimates of first time buyers taking a mortgage to adjust for the decline in first owner grants, they still give an incomplete picture.

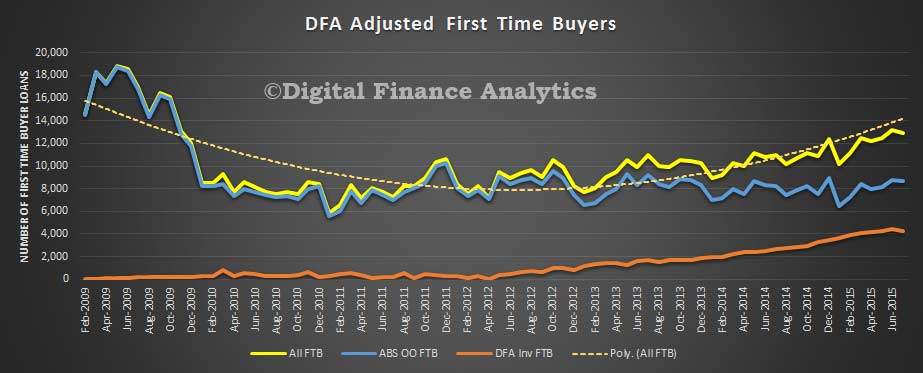
The traditional wisdom is that first time buyers are sitting out of the property markets, because prices are high, loans harder to get, and confidence is falling. However one of the most significant developments surrounding first time buyers is that many more are now going direct to the investment sector.

The original data from the ABS, shows a small fall in the month to 15.4% in July 2015 from 15.8% in June 2015. The DFA data for investor FTB also fell. The number of first time buyers are still sitting at around 12,000 a month in total, still well below the peaks in 2009. Our surveys indicate strong FTB investor appetite. The changed underwriting requirements however are having an impact.

FTB-Adjusted-July-2015There are a number of drivers to this trend. First, most first time buyers were unable to afford to purchase a property to occupy, in an area that made sense to them and were being priced out of the market. Next, many were anxious they were missing out on recent property gains, so decided to buy a less expensive property (often a unit) as an investment, thanks to negative gearing, they could afford it. They often continue to live at home meantime, hoping that the growth in capital could later be converted into a deposit for their own home – in other words, the investment property is an interim hedge into property, not a long term play. Some are also teaming up with friends to jointly purchase an investment, so spreading the costs. In fact about one third who purchased were assisted by the Bank of Mum and Dad, and would consider an investment property by accessing their superannuation for property investment purposes, a bad idea in our view.

Given the heady state of property prices at the moment, this growth in investment property by prospective first time buyers is on one hand logical, on the other quite concerning. We would also warn against increasing first time buyer incentive.

Remember, also the data refers to loans, not property transfers, and we know from our surveys that additional purchases were made without the need for a mortgage by overseas investors, and local purchases cashed up thanks to the Bank of Mum and Dad.

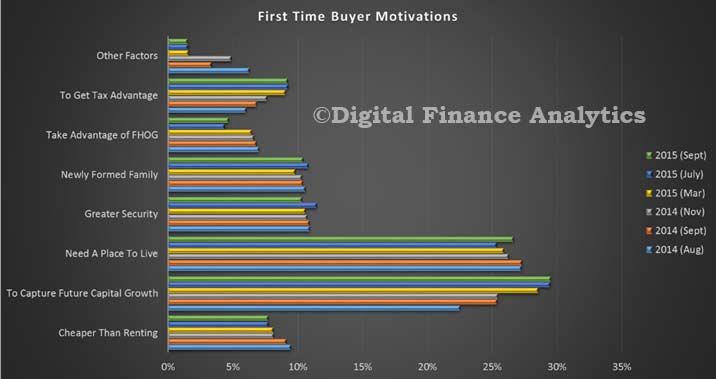
Turning to the reasons why first time buyers are going down this track, our analysis of buyer motivations draws some striking observations. We see that the prospect of potential capital gains is now the highest rated driver at 30%, whilst the desire for somewhere to live is just 27%. We see the prospect of gaining tax advantage is growing, now up to 10%, whilst the advantage of a First Home Owner Grant (FHOG) is falling away as these grants become less accessible (6%). Fewer buyers now expect to pay less than renting, whilst the prospect of greater security remains about the same.

DTA-Sept-FTB-Motivations So putting this together, we conclude that first time buyers are reacting to the current house price boom in logical ways. They are however being infected by the notion that property is about wealth building, rather than somewhere to live. This notion, which served previous generations quite well (once they were on the property escalator), may be tested if interest rates rise later, or property prices fall from their current illogical stratospheric levels. The overriding result from the survey is the first time buyers are very fearful of missing out, and that delaying potential entry into the market will simply make it less affordable later. Recent changes to underwriting standards may cramp their style, but we still expect to see a continued rise in the number of first time investor buyers.

Fixing the global financial safety net: lessons from central banking

In a speech to the David Hume Institute in Edinburgh, Minouche Shafik, Bank of England Deputy Governor for Markets and Banking, describes the global safety net for dealing with sovereign debt crises as “more of a patchwork than a safety net.” The need to fix the safety net has been brought into sharper focus by the challenges facing emerging markets: lower growth, falling commodity prices and potential spillovers from the possible exit of exceptional monetary policy in advanced economies. Drawing on lessons from central banks’ response to banks’ liquidity needs during the financial crisis, she identifies policy reforms that could reduce the systemic implications of sovereign debt crises and allow nations to cope with shocks.

“The benefits of free trade are now well established. Similarly, economic theory provides compelling arguments for the potential advantages of integrated global capital markets based on the efficient allocation of resources. But, in practice, cross-border capital flows can be fickle and flighty, with destructive effects on the real economy.” They leave nations exposed to a ‘capital stop’, in much the same way that banks can experience a run on their deposits.

Minouche concludes that the current safety net – a mix of national foreign exchange reserves, regional financing arrangements, central bank swap lines and the International Monetary Fund (IMF) – is suboptimal: fragile, fragmented, and inefficient. If we are to continue to benefit from global financial integration then we need a system that can effectively and efficiently provide liquidity insurance to fundamentally sound sovereigns in order to contain spillovers to other parts of the globe.

Drawing on the experience of central banks, she notes that more reliable provision of liquidity support has been made possible by the fact that supervision is tougher on capital and liquidity requirements, banks undergo regular stress testing, and credible resolution tools are being put in place. What would the equivalent enablers be for sovereigns? Minouche suggests:

• Better surveillance, and particularly of the vulnerabilities to sudden stops;
• Stress testing countries’ balance sheets through better debt sustainability assessments; and
• Better mechanisms for dealing with debt restructuring and reducing the risk of disorderly spillovers.

Given the “complex and messy process whereby markets and the official sector deal with sovereign debt restructurings”, how might the risk of disorderly spillovers be reduced? Three preliminary ideas are suggested:

• Using state-contingent bonds to increase risk-sharing with private sector creditors, for example GDP-linked bonds.
• Facilitating agreements on a debt restructuring in bond contracts by expanding the use of new style collective action clauses so that decisions can be taken by a majority of creditors across all bond issuances, without the need for an issuance-by-issuance vote.
• Reducing international spillovers by reviewing the preferential treatment that cross-border sovereign exposures receive in prudential regulation.

At the heart of the global safety net, Minouche suggests, needs to be a more reliably resourced IMF that has well defined arrangements for collaborating with regional financing arrangements. Unless improvements are made, it will be difficult to achieve and sustain the benefits of integrated global capital markets.

From ‘debt and deficit’ to ‘building prosperity’: what’s needed to shift the economic narrative

From The Conversation.

So, new Australian Prime Minister Malcolm Turnbull wants to have a “conversation” with the Australian people and “explain” policies in a way that respects our intelligence. Excellent. He will be better at this than Abbott, and new Treasurer Scott Morrison will be better than Joe Hockey.

Turnbull began the conversation on Sunday in announcing his new ministry. In this speech he used the term “prosperity” in one form or another (including “prosperous”) at least three times. This is interesting and welcome. We hear about “growth” and “productivity” but hardly anyone understands what they mean and why they are important. Prosperity is a term that captures those ideas in a way people can better understand. He didn’t define prosperity but let me suggest he is talking about living standards.

The best indicator of living standards is national income per person which has grown at an average rate of 2.3% over the past 40 years, but has fallen sharply in recent years. In fact the growth rate has been negative in recent years meaning living standards have actually fallen.

There are three principal drivers of living standards and they are all going in the wrong direction: labour productivity which has fallen from historic average of 2% growth to 1.4%, the terms of trade which is essentially prices the rest of the world are willing to pay for our exports and have fallen by 30% from their peak in 2007, and the share of the population in jobs which has fallen about 2% since 2005 and is set to fall by another 3% over the next few decades. The driver we can do most about on a sustained basis is labour productivity. The employed share of the population is important too but it can’t be increased forever.

In improving living standards, the new team of Turnbull and Morrison face huge challenges and unfinished business. One challenge, surprisingly and unfortunately, comes from their own principal advisers in Treasury who have completely lost the plot when it comes to thinking about how to raise living standards.

Treasury sees its mission as improving the “wellbeing” of the Australian people by which it means improving “a person’s substantive freedom to lead a life they have reason to value”. Well, that’s nice but it’s more like the advice a parent gives their child rather than the basis for measurable and achievable goals of economic policy. It leads to a vague un-prioritised and unmeasurable list of indicators including the “risks” people face in life, “complexity” of choices they face, and “sustainability” of their opportunities over time. Remember, this is the framework of the “institution with the chief responsibility for providing economic advice to government”.

So clearly Turnbull and Morrison will need to do their own thinking on how to raise living standards. They should return to the big themes that Joe Hockey tried unsuccessfully to articulate two years ago: the culture of entitlement to taxpayer handouts and the huge growth in government spending. And they need to somehow find a way of putting serious tax reform back on the agenda and also tackle industrial relations reform in the wake of the alarming revelations of the trade union Royal Commission.

The public discourse on tax reform is beginning to run off the rails. It has become about how to raise more revenue to fund rising government spending on health, aged care, disability insurance, child care and a raft of other welfare measures. Morrison needs to turn this debate around.

Higher taxes to fund more welfare is not the way to raise living standards.

Consider these observations. The Australian budget deficit has fallen as a percent of GDP from its highest level since 1970 of 4.2% in 2009-10 to 2.6% in 2014-15. But this has been due entirely to rising tax revenue rather than cuts in spending which has stayed the same as a share of GDP. Over the same period government spending in the US, U.K. and New Zealand decreased as a share of GDP. Yet GDP is growing at least as fast in these countries and their unemployment rates are lower than in Australia.

Reform myth busting

Morrison must explain that taxes have costs to living standards. A standard estimate is that for the average dollar of tax that is raised, about 20 cents is lost down the metaphorical toilet – a “deadweight loss” is the polite term. It refers to the costs in output caused by the disincentive to employ labour and capital. So an extra dollar of spending that must be financed by taxation needs to earn a 20 per cent rate of “return”, which is a high bar. Hence the challenge for Morrison is to explain that we can’t just spend and tax our way to higher living standards.

On tax reform, Morrison also needs to address head-on the myths in the public debate. The worst is the simplistic criticism that a higher GST would be inherently unfair because a given amount of GST is a higher share of a low income than of a high income. First it ignores life cycle effects – young low income people are often high income people in the future. Second it ignores the ability to compensate welfare recipients and the working poor while still leaving plenty of revenue to reduce other harmful taxes – a package that would add about 2% to living standards.

This leads to another myth – that company tax cuts are just welfare for the big end of town. Quite the opposite – the biggest winners from company tax cuts would be ordinary workers. This might be counter-intuitive but it is very widely accepted among tax experts and has a strong theoretical and empirical basis. The reason is that company tax cuts would encourage capital to move to real businesses that employ workers, which would increase employment and wages.

The next huge field of opportunity is industrial relations reform. Here Morrison will need Turnbull the lawyer and smooth talker. Based on the Royal Commission evidence, trade unions and business (both are to blame) have had their snouts in the trough at the expense of workers and taxpayers. And they will need to show, without mentioning the words “work” and “choices” in the same sentence, that in fact giving individual workers and employers the right to negotiate their own terms unfettered can drive employment and prosperity.

Author: Ross Guest, Professor of Economics and National Senior Teaching Fellow, Griffith University

Residential Real Estate Now Worth $5.76 trillion

The ABS released their data on capital city house prices today, to June 2015.  Total property is now worth $5.76 trillion, reflecting recent significant price rises in Sydney and Melbourne. The number of dwelling rose to 9.53 million, and the average price was $604,700.

The capital city residential property price indexes rose in Sydney (+8.9%), Melbourne (+4.2%), Brisbane (+0.9%), Adelaide

The price index for residential properties for the weighted average of the eight capital cities rose 4.7% in the June quarter 2015. The index rose 9.8% through the year to the June quarter 2015.

(+0.5%) and Canberra (+0.8%), was flat in Hobart (0.0%) and fell in Perth (-0.9%) and Darwin (-0.8%).

Annually, residential property prices rose in Sydney (+18.9%), Melbourne (+7.8%), Brisbane (+2.9%), Canberra (+2.8%), Adelaide (+2.7%) and Hobart (+1.5%) and fell in Darwin (-1.8%) and Perth (-1.2%).

The total value of residential dwellings in Australia was $5,761,607.2m at the end of June quarter 2015, rising $271,939.1m over the quarter.

The mean price of residential dwellings rose $26,200 to $604,700 and the number of residential dwellings rose by 38,400 to 9,528,300 in the June quarter 2015.

Over 1.3 m Households are Property Want-To Buys

Continuing our posts from DFA’s latest Property Imperative report, just released, which contains the latest data from our surveys, today we focus on the Want-To-Buys. This segment comprises households who want to buy a property, some are saving, but have not yet committed. Their aspirations are being crushed by current market conditions.

Over 1.3 million households aspire to purchase property, of which 84% are looking for owner occupied, and 15% are looking for an investment property.

At the moment 17% are actively saving, hoping to buy sometime in the future, this is lower than last year, when 28% were saving. For many, they see the savings task beyond them now because of rising prices, lower bank deposit rates, and lower incentives to enter the market.

The biggest barriers which are stopping them from purchasing, include that prices are too high (51%), the costs of living (17%) and fear of employment (13%). Only 1.3% were expecting to transact within the next 12 months, indicating that the majority are currently disenfranchised from the property market, despite the fact that 41% expect house prices to rise over the same period.

DFA-Sept---Want-to-buysThe proportion of households who are disenfranchised by high house prices continues to rise, whilst issues relating to unemployment have moderated slightly.

We also note a small rise in households unable to obtain mortgage finance, thanks to tighter underwriting standards.

Next time we will look at first time buyers.


Households Still Want Property, But Its Becoming More Challenging

Contained in the latest edition  of the Property Imperative, released today is an update on households and their attitude towards property. Over the next few days we will post some specific findings from the report. Today we look at aggregate demand.

To understand the current dynamics of the residential housing market we need to examine the behaviours of different household segments, because generic averaging across these diverse segments hides important differences. There are about 8.98 million households in Australia , and using analysis from the Australian Bureau of Statistics, and our own survey, we have segmented these households looking specifically at their property owning behaviour.

First we split the households into those which are property inactive, and those who are property active. Property inactive households were defined as those who currently rent, live with parents, or are homeless, with no plans to enter the market.

Property active households are those who own, or actively desire to own property, either as an owner occupier, or as an investor, and either own the property outright, have a mortgage or are actively looking. The analysis shows that about 26.1% percent of households are property inactive, which equates to about 2.35 million households. Examining past data, and applying the same analysis, we discovered that even correcting for population growth and migration, the property inactive proportion of the household population has been steadily increasing.

DFA-Sept-InactiveA similar fall in home ownership rates have been confirmed by others and it is suggested that the main reason for this trend is that house prices have simply grown faster than average incomes, thus making it harder to buy into the market.

DFA-Inactive-StatesThis signals an important underlying social issue, and is not being adequately addressed. Actually, we are seeing more households becoming tenants of the growing band of property investors, whilst many younger Australians are unable to buy for themselves, or are becoming property investors first. We note that in New Zealand, the Reserve Bank is consulting on changing the capital ratios for investment loans.

However, we will focus our attention on the property active household segments. To assist in our analysis we have segmented the property active segments by motivation and type. Below we outline our segments, and how they are defined.

  1. Want-to-Buys Household    s who want to buy a property, are saving, but have not yet committed
  2. First Timers Households who are buying, or have bought for the first time
  3. Refinancers Households who are restructuring their finances, but not moving house
  4. Holders Households with no plans to move or refinance
  5. Up-Traders Households looking to buy a larger place
  6. Down-Traders Households looking to buy a smaller place
  7. Solo Investors Households with a single investment property
  8. Portfolio Investors Households with a portfolio of investment property

In our survey, we also mapped these segments across owner occupied and investment property types. The chart below shows the current number of households by segment distribution, as at September 2015 .

DFA-Sept-SegmentsIn our surveys, we looked across a number of dimensions, within the segments. This included whether they were actively saving to buy, intending to transact, borrowing needs and house price expectations. We will outline findings from each of these.
Portfolio Investors are more likely to transact in the next 12 months (over 77%), then solo investors (43%), then down traders (47%) and refinancers (23%). First time buyers (9%) and want to buys were least likely to transact (9%). Overall demand for property is still very strong, but headwinds are slowing momentum.

DFA-Sept-TransactThat said, first time buyers are saving the hardest (72%), although want to buys (21%) and up traders (32%) are also saving.

DFA-Sept-SavingTurning to borrowing expectations, portfolio investors are most likely to borrow more (87%), up traders (73%), first time buyers (60%) and sole investors (51%) are also in the market.

DFA-Sept-BorrowMost segments are bullish on house prices over the next 12 months, with down traders being the least excited (24%). Investors have the strongest view of potential future growth, whilst the trends across other segments suggests a weakening of expectation, at the margin.

DFA-Sept-Huose-PricesSome segments are more likely to use a mortgage broker than others, with refinancers mostly likely to (75%), then first time buyers (55%) then investors (36%).

DFA-Sept-BrokerOne of the interesting aspects of the research is how consumers select a lender. More than ever, households do initial research online, using comparison sites, or social media before making a choice, either via a broker (who are doing well just now ), or direct with lenders. However these traditional business models are now at significant risk from digital disruption.  The key selection criteria is price, price and then price. Below is segmented data, showing the relative importance of price, brand, flexibility, loyalty and trust. Apart for holders, who are not in the market currently, on average 80% of purchasers will make their final decision on the price of the deal. Brand is largely irrelevant.

DFA-Sept-Purchase-DriversThe average new loan has grown again, to over $428,000 for a NSW non-first time buyer, according to the ABS data to July 2015 . The growth in loan size is running more slowly than house price growth (circa 13% in NSW), but significantly above average income growth.

About 10% of loans have a fixed rate (thanks to the current low RBA cash rate and expectation of lower rates to come).

The proportion of interest only loans written continues to grow, according to APRA data. The latest data to June 2015 indicates that more than 40% of new loans are interest only.

Next time we will look in more detail at some of the segment specific data.


Nab Offers Mortgage Via Brokers Frequent Flyer Point Incentive

In a sign of the highly competitive nature of home loans, NAB has announced a major frequent flyer offer for broker-introduced clients targetting owner occupied loans. Broker customers can apply between 21 September and 31 December 2015 for 250,000 NAB Velocity Frequent Flyer Points as an alternative to a $1500 cash back offer, provide they switch their main banking to NAB.

In the latest edition of the Property Imperative, released today we highlighted the intense focus on owner occupied loans as opposed to investment loans, and the various discounts and incentives on offer. The mortgage wars just stepped up another gear!

Latest DFA Report – The Property Imperative 5 – Just Released

The Property Imperative, Fifth Edition, published September 2015 is available free on request.

This report explores some of the factors in play in the Australian residential property market by looking at the activities of different household groups using our recent primary research, customer segmentation and other available data. It contains:

  • results from the DFA Household Survey to September 2015
  • a focus on underwriting standards and mortgage pricing
  • an update of the DFA Household Finance Confidence Index
  • a discussion of the impact of high house prices

Property-Imperative-5You can obtain a copy of the report, delivered via email here.

From the Introduction.

The Property Imperative is published twice each year, drawing data from our ongoing consumer surveys, research and blog. This edition dates from September 2015 and offers our latest perspectives on the ever-changing residential property sector.

We begin by describing the current state of the market by looking at the activities of different household groups using our recent primary research and other available data.

In this edition, we also look at current mortgage pricing dynamics and underwriting standards; update our household finance confidence index and discuss the impact of chronically high house prices over the longer term.

Residential property is in the cross-hairs of many players who wish to influence the economic, fiscal and social outcomes of Australia.

By way of context, the Australian residential property market of 9.53 million dwellings is currently valued at over $5.76 trillion and includes houses, semi-detached dwellings, townhouses, terrace houses, flats, units and apartments. In the past 10 years the total value has more than doubled. It is one of the most significant elements driving the economy, and as a result it is influenced by state and federal policy makers, the Reserve Bank (RBA), banking competition and regulation and other factors. Indeed the RBA is “banking” on property as a critical element in the current economic transition.

According to the RBA, as at July 2015, total housing loans were a record $1.48 trillion . There are more than 5.4 million housing loans outstanding with an average balance of about $243,000 . Approximately 61% of total loan stock is for owner occupied housing, while a record 39% is for investment purposes. Last month, more than half of new loans written were for investment purposes.

The relative proportion of investment loans leaped by nearly 2.5% to 38.9% thanks to a significant reclassification of loans by some lenders.

In addition, 39.7% of new loans issued were interest-only loans.

The RBA continues to highlight their concerns about potential excesses in the housing market . In addition Australian Prudential Regulation Authority (APRA) has been tightening regulation of the banks, in terms of supervision of lending standards, the imposition of speed limits on investment lending and has raised capital requirements for some banks . The latest RBA minutes indicates their view is these regulatory changes are slowing investment lending somewhat , though we observe that demand remains strong, and in absolute terms, borrowing rates are low.

The story of residential property is far from over!

Table of Contents:
1 Introduction 3
2 The Property Imperative – Winners and Losers 4
2.1 An Overview Of The Australian Residential Property Market 4
2.2 Home Price Trends 4
2.3 The Lending Environment 6
2.4 Bank Portfolio Analysis 9
2.5 Market Aggregate Demand 10
3 Segmentation Analysis 16
3.1 Want-to-Buys 16
3.2 First Timers 16
3.3 Refinancers 19
3.4 Holders 19
3.5 Up-Traders 20
3.6 Down-Traders 20
3.7 Solo Investors 21
3.8 Portfolio Investors 21
3.9 Super Investment Property 21
4 Special Feature – Current Mortgage Pricing Dynamics 24
4.1 Regulatory Context 24
4.2 Bank Reaction 25
4.3 Portfolio Implications 28
5 The DFA Household Finance Confidence Index 30
6 Who Benefits From High House Prices? 33
7 About DFA 35
8 Copyright and Terms of Use 36

The unfinished business facing Australia’s new treasurer

From The Conversation.

When Australia’s new treasurer walks into the office on Monday morning, a stack of unfinished business awaits. A quick scan of the Treasury website reveals four major inquiries begun in the past 18 months that are still in progress – the Financial System Inquiry, the Competition Policy Review, the Tax White Paper and the Northern Australia Insurance Premiums Taskforce.

The outcomes of these processes open up the possibility of bold decisions that would uplift the outlook for the nation’s economic growth and longer-term prosperity. It is worthwhile to delay a rush to judgement, and consider a framework and narrative that incorporates and informs all of these areas of inquiry.

The most obvious piece of pending business is the government response to the Financial System Inquiry led by David Murray over the course of 2014. The government response, which had been promised for a few months now, appeared ready to be issued this week.

Indeed, close observers have been left wondering whether there would be much “response” in the response, in light of pronouncements that have already been made. Banking regulator APRA has issued guidance on bank capital (with significant market impacts this year); the government has drafted new legislation on superannuation governance that has been released for public consultation; the decision has been made to not impose a deposit insurance scheme; ASIC’s capability and funding model are currently under review; and the RBA has conducted a payments review including interchange fees.

Off the back of these reviews, other mini-inquiries and consultations have emerged. The Assistant Treasurer Josh Frydenberg in August announced a regulatory review of the payday lending industry. The review of retirement income stream regulation that took place last year is still pending outcomes, and perhaps partly rolled into the Tax White Paper process.

The Northern Australia Insurance Taskforce is examining ways in which the government’s balance sheet can be used to reduce insurance premiums in specific regions of Australia – perhaps without the rest of the Australian community fully appreciating the knock-on impacts this could have for other policyholders. Also under-appreciated are other changes in the insurance industry, such as how the Medibank privatisation is redrawing the regulatory landscape on health insurance.

Yet, one wonders whether the two core positions in the FSI report have been lost in all of the noise: the need to enable efficient funding of the economy by removing distortions, and the ability to promote competition and innovation through appropriate policy settings.

Removing distortions and enabling competition including through innovation in the financial system are both absolutely critical; they are the engine of sustainable financial sector growth. And there is a lot of work to be done.

What does sustainable financial sector growth look like, and why is it important? What is the policy framework that surrounds it? The narrative that will explain this to the Australian community needs to be developed and communicated. Without it, the bold policy choices that are yet to be made are likely to come across as tedious, intangible and maybe just too hard.

The story is straightforward, but is not told often, or well. When we hear from politicians about our economic future, the focus is usually on the goods-producing sectors – mining, agriculture, food, specialised manufacturing. In services we focus on easily-understandable cross-border movement in people – tourism and higher education. We rarely hear boosterism applied to financial services.

Yet, financial services is the largest single industrial segment in the Australian economy by gross value added. It is the largest contributor of corporate tax to the Australian government. It is a major employer in most states, and dominant in NSW and Victoria. It is also probably the largest single services export from Australia to the rest of the world, as ACFS detailed in a recent report. Its above-average rate of productivity growth over the past decade suggests that Australia’s financial sector is innovative.

Of course, the financial services sector also plays an important role in intermediating funds that support growth and innovation through the rest of the economy. The financial services sector runs the payments system, the credit system and the capital markets system that both funds business activity and provides wealth management products for households. Financial services also manage risk through insurance.

What the government has done thus far with the FSI report is fine, but there is potential to go a lot further. The need for this can be seen in the gaps where the financial system has been found wanting: credit to small business, generation of venture capital, creation of a broader suite of retirement income products, the high cost of insurance in some sectors.

Creating supports for clusters for innovation in finance, writing legislation that would enable digital identities while protecting personal financial data, forcing greater access to and use of data so as to level the playing field for competition – these are proactive and forward looking recommendations that may not be easy but must be done. Push the financial sector into the digital age, and the rest of the economy will follow.

And then there is the infrastructure. The NBN may be on its way, but what about data storage in the cloud? This has become essential infrastructure that allows financial firms to store their data at lower cost. Enabling this functionality while protecting firms from cyber crime would be a whole-of-economy advance in Australia’s global competitive position.

A framework that removes distortions and enables competition and innovation – this speaks to the agile, innovative, creative future that Prime Minister Malcolm Turnbull articulated in his victory speech on Monday night. Build the narrative around the inquiries, and good outcomes are sure to follow.

Author: Amy Auster, Deputy Director, Australian Centre for Financial Studies

No Sovereign Credit Impact From Australia PM Change – Fitch

The change in Australia’s premiership following a Liberal party leadership vote held on Monday will not have an immediate credit impact for the sovereign, says Fitch Ratings. Frequent changes in leadership, with four prime ministers governing the country over the past five years, have made little difference in core economic policies so far. There is no sign that this latest transition will lead to deterioration in policymaking effectiveness.

Notably, there is cross-party consensus at the federal level in favour of fiscal consolidation – there is much less appetite in Australia relative to some other high-grade peers for abandoning efforts to reduce deficits. Recent leadership changes, including the vote against incumbent Tony Abbott on Monday, have been driven more by personality and social or constitutional issues as opposed to differences over economic policy.

Political volatility will, in general, only have a credit impact if it were to result in tangible economic policy changes, loss of foreign investor confidence, reduction in policymaking capacity and/or if it impaired the authorities’ ability to respond to a crisis. But in Australia’s case, there has been little to no signs that the recent frequent changes in power have had any such effects.

Beyond the leadership issues, Australia shares some of the long-term challenges of other high-grade sovereigns, including an ageing population and the need to foster productivity growth. The Australian economy is also facing immediate challenges linked to its reliance on commodity exports, particularly to China. High personal indebtedness – over 150% of disposable income – also means households are more vulnerable to higher interest rates and any substantive worsening in the job market. Incoming Prime Minister Malcolm Turnbull has placed some weight on the need to address long-term economic challenges in his public statements, although it remains to be seen whether this will lead to concrete policy changes.

Any further deterioration in Australia’s macroeconomic position may require more politically difficult policy decisions to keep fiscal consolidation on track. As such, continued political volatility, while not a significant issue thus far, could yet impair authorities’ ability to implement policies should economic conditions deteriorate further.

Turnbull, the minister for communications, defeated Abbott as leader of the Liberal party in a 54 to 44 vote by Liberal MPs on 14 September. Turnbull was sworn in as Australia’s 29th prime minister on 15 September.