Uber suffered a legal blow this week when a California judge granted class action status to a lawsuit claiming the car-hailing service treats its drivers like employees, without providing the necessary benefits.
Up to 160,000 Uber chauffeurs are now eligible to join the case of three drivers demanding the company pay for health insurance and expenses such as mileage. Some say a ruling against the company could doom the business model of the on-demand or “sharing” economy that Uber, Upwork and TaskRabbit represent.
Whatever the outcome, it’s unlikely to reverse the most radical reinvention of work since the rise of industrialization – a massive shift toward self-employment typified by on-demand service apps and enabled by technology. That’s because it’s not a trend driven solely by these tech companies.
Workers themselves, especially millennials, are increasingly unwilling to accept traditional roles as cogs in the corporate machinery being told what to do. Today, 34% of the US workforce freelances, a figure that is estimated to reach 50% by 2020. That’s up from the 31% estimated by the Government Accountability Office in a 2006 study.
Many aren’t ready for the on-demand economy that Uber represents, such as these taxi drivers in Brazil.Reuters
Rise of the gig-based economy
In place of the traditional notion of long-term employment and the benefits that came with it, app-based platforms have given birth to the gig-based economy, in which workers create a living through a patchwork of contract jobs.
Uber and Lyft connect drivers to riders. TaskRabbit helps someone who wants to remodel a kitchen or fix a broken pipe find a nearby worker with the right skills. Airbnb turns everyone into hotel proprietors, offering their rooms and flats to strangers from anywhere.
Thus far, the industries where this transformation has occurred have been fairly low-skilled, but that’s changing. Start-ups Medicast, Axiom and Eden McCallum are now targeting doctors, legal workers and consultants for short-term contract-based work.
A 2013 study estimated that almost half of US jobs are at risk of being replaced by a computer within 15 years, signaling most of us may not have a choice but to accept a more tenuous future.
Robot suit via www.shutterstock.com
The economic term referring to this transformation of how goods and services are produced is “platform capitalism,” in which an app and the engineering behind it bring together customers in neat novel economic ecosystems, cutting out traditional companies.
But is the rise of the gig economy a bad thing, as Democratic front-runner Hillary Clinton suggested in July when she promised to “crack down on bosses misclassifying workers as contractors”?
While some contend this sweeping change augurs a future of job insecurity, impermanence and inequality, others see it as the culmination of a utopia in which machines will do most of the labor and our workweeks will be short, giving us all more time for leisure and creativity.
My recent research into self-organized work practices suggests the truth lies somewhere in between. Traditional hierarchies provide a certain security, but they also curb creativity. A new economy in which we are increasingly masters of our jobs as well as our lives provides opportunities to work for things that matter to us and invent new forms of collaboration with fluid hierarchies.
Sharing into the abyss?
Critics such as essayist Evgeny Morozov or the philosopher Byung-Chul Han highlight the dark side of this “sharing economy.”
Instead of a collaborative commons, they envision the commercialization of intimate life. In this view, the likes of Uber and Airbnb are perverting the initial collaborative nature of their business models – car-sharing and couch-surfing – adding a price and transforming them from shared goods into commercial products. The unspoken assumption is that you have the choice between renting and owning, but “renting” will be the default option for the majority.
Idealists take another tack. Part of the on-demand promise is that technology makes it easier to share not only cultural products but also cars, houses, tools or even renewable energy. Add increasing automation to the picture and it invokes a society in which work is no longer the focus. Instead, people spend more of their time in creative and leisurely activities. Less drudge, more time to think.
The “New Work movement,” formed by philosopher Frithjof Bergmann in the late 1980s, envisioned such a future, while economist and social theorist Jeremy Rifkin imagines consumers and producers becoming one and the same: prosumers.
From self-employment to self-organization
Both of these extremes seem to miss the mark. In my view, the most decisive development underlying this discussion is the need for worker self-organization as the artificial wall between work and life dissolves.
My recent work has involved studying how the relationship between managers and workers has evolved, from traditional structures that are top-down, with employees doing what they’re told, to newer ones that boast self-managing teams with managers counseling them or even the complete abolition of formal hierarchies of rank.
While hierarchy guarantees a certain security and offers a lot of stability, its absence frees us to work more creatively and collaboratively. When we’re our own boss we bear more responsibility, but also more reward.
And as we increasingly self-organize alongside others, people start to experiment in various ways, from peer to peer and open source projects to social entrepreneurship initiatives, bartering circles and new forms of lending.
The toughest tension for workers will be how best to balance private and work-related demands as they are increasingly interwoven.
Avoiding the pitfalls of platform capitalism
Another risk is that we will become walled in by the platform capitalism being built by Uber and TaskRabbit but also Google, Amazon and Apple, in which companies control their respective ecosystems. Thus, our livelihoods remain dependent on them, like in the old model, just without the benefits workers have fought for many decades.
In his recent book “Postcapitalism,” Paul Mason eloquently puts it like this: “the main contradiction today is between the possibility of free, abundant goods and information; and a system of monopolies, banks and governments trying to keep things private, scarce and commercial.”
To avoid this fate, it’s essential to create sharing and on-demand platforms that follow a non-market rationale, such as through open source technologies and nonprofit foundations, to avoid profit overriding all other considerations. The development of the operating system Linux and web browser Firefox are examples of the possibility and merits of these models.
Between hell and heaven
Millennials grew up in the midst of the birth of a new human age, with all the world’s knowledge at their fingertips. As they take over the workforce, the traditional hierarchies that have long dictated work will continue to crumble.
Socialized into the participatory world of the web, millennials prefer to self-organize in a networked way using readily available communication technology, without bosses dictating goals and deadlines.
But this doesn’t mean we’ll all be contractors. Frederic Laloux and Gary Hamel have shown in their impressive research that a surprisingly broad range of companies have already acknowledged these realities. Amazon-owned online shoe retailer Zappos, computer game designer Valve and tomato-processor Morning Star, for example, have all abolished permanent managers and handed their responsibilities over to self-managing teams. Without job titles, team members flexibly adapt their roles as needed.
Mastering this new way of working takes us through different networks and identities and requires the capacity to organize oneself and others as well as to adapt to fluid hierarchies.
As such, it may be the the fulfillment of Peter Drucker’s organizational vision:
… in which every man sees himself as a “manager” and accepts for himself the full burden of what is basically managerial responsibility: responsibility for his own job and work group, for his contribution to the performance and results of the entire organization, and for the social tasks of the work community.
The Author: Bernhard Resch, Researcher in Organizational Politics at University of St.Gallen
Payday lenders have been the subject of trenchant criticism since their popularity exploded following the financial crisis. A recent documentary, “Cash in Hand: Payday Loans”, sought to counter this by giving an insider look at the industry. The show went behind-the-scenes at payday lender Uncle Buck, which possesses a 2% market share behind behemoths such as Wonga and QuickQuid, and followed the daily activities of its customer service and collections operation.
The payday lending market has changed significantly since regulation was announced last year – it appears that the industry is making real efforts to clean up its act. This being the case and in an age of alternative lending models such as peer-to-peer lending and crowdfunding, we should be cautious about automatically dismissing the use of payday loans.
With high interest rates, payday loans are short-term loans that are usually repaid on the debtor’s next payment date. The industry grew exponentially in the wake of the financial crisis and now over 1.2m loans are issued in the UK every year. As the industry has flourished, so has the appetite for their abolition by consumer groups and others, including Labour deputy leader hopeful Stella Creasy.
New rules
It is true that the industry has until recently adopted unsavoury practices such as opaque terms and conditions and illegal collection methods. But as these practices became more apparent the industry attracted the gaze of consumer groups and it was not long before regulatory intervention was the order of the day.
The industry was hit with a raft of regulatory changes at the start of 2015 after public outcry about lending and debt collection practices. In a classic case of public pressure leading to regulatory action, the Financial Conduct Authority (FCA) introduced a series of measures to protect consumers including:
A daily interest rate and fee cap of 0.8% for every £100 lent.
A total cap on the maximum any customer will pay in interest and default fees equivalent to double the amount advanced.
A cap on late payment fees of £15.
The new regulations led to many smaller industry players shutting up shop and prompted many of the industry leaders to revise their business model and their approach to customer care and debt collection.
In some US states, payday loans have been abolished, and interest caps introduced in others. This is primarily due to predatory lending practices targeted at ex-military personnel and single parents.
But the consumer profile of the payday loan customer in the UK is significantly different to customers in the US. According to IRN Research, UK payday loan borrowers are most likely to be young adults with below average incomes, using payday loans with more savvy than is popularly depicted.
In the UK, 67% have a household income of below £25,000 compared to the US where it is closer to 75%. Moreover, while payday borrowers in the US tend to be adults without bank accounts and with poor, “sub-prime” credit histories. This is not the case in the UK.
The IRN research also shows that 33% of payday loan customers have a household income exceeding the national average – 6% of users at more than £50,000 per annum. The truth is that payday loans are a money-saving mechanism for some young professionals.
For example, a £100 payday loan, operating at 0.8% daily interest, paid back in 30 days will cost significantly less than going £100 into an unauthorised overdraft. This is something Steve Hunter at Uncle Buck said in the recent show:
If you were to take out a loan for £300 you would pay back about £458 over three months. We are expensive but it’s very, very short-term. It could be a lot more if you went into your overdraft in an unauthorised way.
It is difficult to argue with this logic. An unauthorised overdraft, with Santander for example, can cost anything up to £95-a-month in fees. Choosing a payday loan in these circumstances is a rational buying decision informed by the cost of both options.
Regulation in action
Of course, the majority of people that use payday loans have household incomes below the national average. The FCA estimates that since it took over regulation of the industry, the number of loans and amount borrowed has reduced by 35%. Up to 70,000 customers have now been denied access to the market. This is a positive step forward.
With new emphasis on affordability checks, it is right that those who cannot afford to repay a short-term loan are denied from taking it out in the first place. But it is vital that those who are denied access do not turn to unregulated money lenders or other unsavoury finance streams. To this effect, efforts must continue to improve people’s financial literacy and consumer support groups need funding to cater for those who find themselves in financial difficulty.
The new regulatory terrain in this industry signals a new dawn for payday lenders. They now have an opportunity to reconstruct their reputation and operate more responsibly. As long as they adhere to the new regulations and abide by the laws of the industry, there is no reason why payday lending cannot be a useful financial tool for many.
Author: Christopher Mallon, PhD Candidate – Financial Regulation at Queen’s University Belfast
In a speech given by Greg Medcraft, Chairman, Australian Securities and Investments Commission at the 32nd annual conference of the Banking and Financial Services Law Association (Brisbane), he looked at the Financial System Inquiry from a regulator’s perspective.
Specifically, he sees three FSI recommendations as complementary. Product intervention powers would complement and reinforce the good practices and controls required by product design and distribution obligations. Where product design and distribution obligations were in place, and were effectively being complied with, there would be less need for ASIC to intervene. Adequate penalties provide a deterrent for gatekeepers against engaging in misconduct, and this in turn influences their behaviour. Gatekeepers who already have a solid culture have nothing to fear from these recommendations. For those who fall short, ASIC will continue to use the right nudge to change their behaviour. The introduction of a product intervention power, design and distribution obligation and appropriate penalties will assist ASIC in providing the right nudge.
Today I would like to talk about three particular recommendations of significance to ASIC.
1. for ASIC to have a new ‘product intervention’ power
2. to introduce a new product design and distribution obligation on product issuers, and
3. that penalties should be increased to act as a credible deterrent, and that ASIC should be able to seek disgorgement of profits gained by wrongdoing.
I would like to spend a little time now speaking about each of these recommendations in turn.
Product intervention power
Globally, regulators are looking for a broader toolkit to address market problems, including moving away from purely disclosure-based regulation. For example, the International Organization of Securities Commissions (IOSCO) has recommended that regulators look across the financial product value chain, rather than simply disclosure at the point of sale. In the United Kingdom, the Financial Conduct Authority has a product intervention power in place. A product intervention power would give ASIC a greater capacity to apply regulatory interventions in a timely and responsive way. It would allow ASIC to intervene in a range of ways where there is a risk of significant consumer detriment. ASIC would be able to undertake a range of actions, including simple ‘nudges’, right through to product bans. I know that some commentators have been worried that ASIC would use its powers to ban products – and that this would affect innovation and competition.
We think that such a power would not stifle innovation that has a positive impact on consumers. In fact, banning products would be very rare and would only occur in the most extreme circumstances. Both industry and regulators have a common interest in seeing innovation that fosters investor and financial consumer trust and confidence – innovation that helps investors, but does not harm them. Most interventions would likely fall well short of product banning. For example, we might be able to require amendments to marketing materials, or additional warnings. In more extreme cases, we might be able to require a change in the way a product is distributed or, in rare cases, ban a particular product feature. We agree that the use of intervention powers by ASIC would naturally need to have transparency, clear parameters and accountability mechanisms.
However, let me say that a ‘product intervention’ approach – that is, regulation that is not purely based on disclosure – is not new in the regulation of retail financial markets in Australia. This kind of regulation has improved investor outcomes in a wide range of markets over many years, for example: the Future of Financial Advice (FOFA) reforms, including the restriction on conflicted remuneration, and more broadly, the prohibition on unfair contract terms for financial products.
The FSI’s recommendation would mean that ASIC itself would have greater capacity to apply such non-disclosure based approaches in a timely and responsive way. This would be an alternative to waiting – sometimes many years – for legislation to address the problem.
Product design and distribution obligation
I will now turn to the recommendation to introduce a product design and distribution obligation for product issuers. For this recommendation, I want to set the context from ASIC’s perspective. There are three cornerstones of the free market-based financial system. These are: investor responsibility, gatekeeper responsibility, and the rule of law.
The ability of the free market-based system to function effectively and efficiently, and to meet investor and financial consumer needs, is greatly influenced by the real behaviour of its participants. Investor responsibility is key in our free market-based financial system. It is important that losses remain an inevitable part of this market system. ASIC will not, and cannot, be expected to prevent all consumer losses. In addition, it is important that gatekeepers take responsibility for their actions. Recently I have talked a lot about the culture of our gatekeepers. The culture of a firm can positively or negatively influence behaviour. Poor culture – such as one that is focused only on short-term gains and profit – often drives poor conduct. Conversely, good culture will drive good conduct. I see a good culture as one that puts the customer’s long term interests first.
So the FSI recommendation – that a broad, principles-based obligation be placed on financial institutions to have regard to the needs of their customers in designing and targeting their products – is a recommendation that puts the interests of the customer at its centre. In my view, the FSI’s recommendation aligns very closely with the theme of culture. Product manufacturers should design and distribute products with the best interests of the investor or financial consumer in mind. This is part of having a customer-focused culture.
In fact, the FSI has noted that the kinds of practices required by a design and distribution obligation would already be in place in many institutions that already invest in customer-focused business practices. Firms that already have a customer-focused culture would not need to significantly change their practices.
Penalties
Finally I would like to turn to the recommendation on penalties. The FSI recommended that penalties for contravening ASIC legislation should be substantially increased, and that ASIC should be able to see disgorgement of profits obtained as a result of misconduct. Comparatively, the maximum civil penalties available to us in Australia are lower than those available to other regulators internationally. And they are fixed amounts, not multiples of the financial benefit obtained from misconduct.
In order to regulate for the real behaviour of gatekeepers in the system, penalties need to be set at an appropriate level. And we need a range of penalties available, to act as a deterrent to misconduct. Penalties set at an appropriate level are critical in the ‘fear versus greed’ calculation of the potential wrongdoer. Penalties need to give market participants the right incentive to comply with the law. They should aim to deter contraventions and promote greater compliance, resulting in a more resilient financial system.
Data from the ABS looking at income and wealth, shows that the average income of high income households rose by 7 per cent between 2011-12 and 2013-14, to $2,037 per week, whist low income households have experienced an increase of around 3 per cent in average weekly household income compared with middle income households which have changed little since 2011-12.
The average income of all Australian households has risen to $998 per week in 2013–14, while average wealth remained relatively stable at $809,900. Similarly, change in average wealth was uneven across different types of households. For example, the average wealth of renting households was approximately $183,000 in 2013-14. Rising house prices contributed to an increase in the average wealth for home owners with a mortgage ($857,900) and without a mortgage (almost $1.4 million).
Most Australian households continue to have debts in 2013-14, with over 70 per cent of households servicing some form of debt, such as mortgages, car loans, student loans or credit cards. For example, the average credit card debt for all households was $2,700.
One quarter of households with debt had a total debt of three or more times their annualised disposable income. Mortgage debt was much higher
These households are considered to be at higher risk of experiencing economic hardship if they were to experience a financial shock, such as a sudden reduction in their income or if interest rates were to rise, increasing their mortgage or loan repayments.
The survey findings also allow comparisons of income and wealth across different types of households.
In 2013–14, couple families with dependent children had an average household income of $1,011 per week, which was similar to the average for all households at $998 per week.
By comparison, after adjusting for household characteristics, one parent families with dependent children had an average household income of $687 per week.
Australia’s economy grew by just 0.2% in the June quarter, below expectations of 0.4%, largely as a result of reduced mining and construction activity and a decline in exports of 3% during the quarter.
Nominal Gross Domestic Product grew by 1.8% during the year, which the Australian Bureau of Statistics said was “the weakest growth in nominal GDP since 1961-62”. Despite this, Australia has now recorded 24 straight years of growth.
The news has some analysts and economists spooked, and politicians blaming each other for the slowdown.
Treasurer Joe Hockey said:
At a time when other commodity based economies like Canada and Brazil are in recession, the Australian economy is continuing to grow at a rate that meets and sometimes beats our most recent budget forecasts.
He also said it was “factually wrong” to say it was the weakest growth since 1961.
The fact is that the economic growth we had in the last quarter was in line with expectations. Of course it bounces around from quarter to quarter, but it was in line with our overarching expectation to have two and a half per cent growth in the last financial year.
Shadow Treasurer Chris Bowen said:
Growth has flat-lined since the Abbott government’s first damaging budget last year and cost of living pressures are continuing to increase. This is the biggest quarterly decline in living standards since the global financial crisis.
This is a very weak set of figures and for the government to cast around for international comparisons to try and make it sound better is a pretty pathetic excuse.
The Treasurer says Australia is still doing better than Canada, Brazil, the US and New Zealand. How should people view these numbers in a global context? To what extent is the slowing rate of growth due to global economic headwinds, and to what extent is it due to domestic factors?
Griffith Business School Professor Fabrizio Carmignani answers:
In the past, the Australian economy has proved to be quite resilient to global economic shocks. Today we are facing what could be potentially a perfect storm.
For one thing, international commodities prices are very volatile and have resulted in a sharp contraction of Australian’s terms of trade. For another, China is going through a complicated economic phase and it is not, at this moment, the same solid anchor for the Australian economy as it might have been previously. So, it is not surprising to see that on a seasonally adjusted basis, quarterly growth in Australia has been oscillating between 0.2% and 0.3% for the last five quarters.
We owe it to some good old Keynesian stimulus on the demand side (read: government consumption and to a lesser extent public gross fixed capital formation) if we are not entering a technical recession.
The comparison with Canada, on surface, is favourable to Australia. Canada has officially entered a recession after recording two consecutive quarters of negative GDP growth in the first half of 2015. This is essentially due to low oil prices. However, according to media reports, Canada is still committed to achieving a target of annual growth of 2.5% this year, which is exactly what the Treasurer has stated for Australia. So, it seems to me that the difference between Australia and Canada here is thinner that what might appear at first sight. A fraction of a percentage point below or above the zero growth line is not really indicative of substantially different structural positions.
Both Australia and Canada are facing similar challenges in terms of diversification. The current “crisis” to me shows that these challenges are still far from being fully addressed in both countries.
Australia has had 24 years of consistent growth. How much of this can we attribute to the mining boom? And given the cyclical nature of the economy, can we expect a downturn?
Griffith University Professor Tony Makin answers:
Australia has performed relatively well compared to other OECD economies over recent decades, though did actually experience a recession during the GFC according to income and production measures of GDP.
Taking population growth into account, Australia’s economic performance since the global financial crisis has been worse than the raw GDP numbers show. On a per capita basis, national income has grown on average below one per cent per annum, less than half the almost two and a half per cent per head per annum average rate in the decade before the GFC.
The extraordinary boost to the terms of trade from the world commodity price hike, especially between 2005 and 2011, substantially raised Australia’s international purchasing power. However, GDP growth during the mining boom was actually less than during the economic reform era from the mid-1980s through to the end of the 1990s when commodity prices were fairly flat.
The main culprit for Australia’s sub-normal economic growth in recent years has not been falling commodity prices, which have undoubtedly played a role, but Australia’s underlying competitiveness problem, combined with a productivity slowdown that began from the turn of the century.
While the recent depreciation of the dollar will go some way to restoring Australia’s competitiveness and help stave off recession, genuine productivity-enhancing reform focusing on the economy’s supply side remains as important as ever for returning GDP and income per head growth to long-term average rates.
One journalist at Wednesday’s press conference said the new data showed “the weakest growth since 1961”, but the Treasurer said that was factually wrong. Who is right?
UNSW Australia Professor Richard Holden answers:
The statement that it is the slowest growth since 1961 seems, to me, to be false. We have had recessions in the 1990s and 1980s, which is two successive quarters of negative growth. And yesterday we had positive growth, so it was a slowdown but not the worst we have seen since 1961. I think the journalist’s statement doesn’t seem correct to me, on the face of it. I think the Treasurer is right.
It is possible the journalist was referring to the Australian Bureau of Statistics comment yesterday that:
GDP growth for 2014-15 was 2.4%. Nominal GDP growth was 1.8% for the 2014-15 financial year. This is the weakest growth in nominal GDP since 1961-62.
Nominal growth and growth are not quite the same thing. Nominal growth means GDP growth that is not adjusted for inflation.
But yes, yesterday’s numbers are still below projected growth. It is below market expectations. I think the Treasurer saying we have projected 2.5% annual growth this year and this is basically on target is a bit disingenuous. This is slow growth, it’s actually very troubling.
I understand the Treasurer can’t talk down the economy so his comments are understandable and he is in a difficult position. But the low rate of growth is genuine cause for concern.
I have written before about the concept of secular stagnation, which is the idea that growth of advanced economies looks like it has slowed down dramatically. The figures yesterday are further evidence of that theory.
Victoria University Senior Research Fellow Janine Dixon answers:
While it is factually correct that real GDP – the volume of production in the economy – has grown, the low growth in nominal GDP points to an underlying weakness in the economy. This is our exposure to the very large fall in commodity prices. When we translate real GDP into real income, we take into account that fact that the prices of the things we produce for export have fallen relative to the prices of the things we consume, some of which are imported. This has been a very important determinant of real incomes in the last few years.
Real net national disposable income is a better measure of our living standards than GDP. As well as adjusting for prices, we take into account the fact that some of the income generated domestically actually accrues to the rest of the world if the factors of production are foreign owned. We also deduct the value of capital that is “used up” or depreciated during the year.
Real net national disposable income per person has now fallen for 14 quarters in a row. This represents the most sustained fall in standards of living in the last 50 years.
What’s especially interesting about this period is that falling incomes have not been associated with falling output or particularly high unemployment. In the 1990-91 recession (the one we had to have) or the early 1980’s, incomes fell, but the solution to the problem was fairly clear. More than 10% of the workforce was unemployed. Fixing unemployment would boost production, incomes and living standards.
This time around, incomes are falling because commodity prices are falling. Commodity prices, set on world markets, are largely out of our hands. The labour market is much more flexible these days, and unemployment is 6%, not 10%. We are left with just one way to turn things around. In the words of Nobel laureate Paul Krugman, “Productivity isn’t everything, but in the long run it is almost everything”.
Is GDP really in line with expectations, both of the government and the market?
Griffith University Professor Ross Guest answers:
These GDP expectations are continuously being revised down as new information comes to hand.
The projected growth is lower than nearly everybody expected and everybody is having to revise downward their expectation.
What will the slowing annual growth mean for the federal budget, which had forecast growth for 2015-16 of 2.75%?
Ross Guest answers:
If growth were to remain at its current level of 2%, the budget deficit would be A$15 billion larger, in ball park terms, than the government projected. To put that in perspective, the total amount we spend on unemployment benefits is A$10 billion.
Australia living standards and the Australian government budget are being hit by a perfect storm of lower commodity prices and lower productivity growth.
Victoria University Senior Research Fellow Janine Dixon answers:
The GDP growth forecast for 2015-16 is fairly subdued at 2.75% and the budget not overly ambitious – a deficit of 2% of GDP. The trouble lies in 2016/17 and beyond, when annual GDP growth is forecast to be above 3%.
Over the next five years a couple of downside risks exist that will make it unlikely that GDP will grow this strongly, and consequently the budget’s return to surplus will be more difficult to achieve.
If the terms of trade fall further than allowed for in the budget forecasts, and if productivity growth remains weak, as it has been in recent years, real national income could be 3% lower than forecast by 2020. Roughly, this means the tax base for the government will be 3% smaller than expected. Rather than having a balanced budget by 2020, we would still be running a deficit, of around 0.75% of GDP or $12 billion in today’s terms.
An interesting BIS working paper “Higher Bank Capital Requirements and Mortgage Pricing: Evidence from the Countercyclical Capital Buffer (CCB)”, examines the impact of implementing CCB on the mortgage market in Switzerland. Does the CCB have the potential to shift lending from less resilient to more resilient banks, and from riskier to less risky borrowers? This paper looks beyond just trying to control total credit growth. They conclude that the CCB does affect the composition of mortgage supply and raises the prices of more risky loans. In fact banks try to pass on the extra capital costs of previously issued mortgages to new customers. However, it does not stop more risky lending, because the link between borrower risk characteristics (here, loan-to-value (LTV) ratios) and capital requirements is too weak to actively discourage banks from offering mortgages to high-LTV borrowers after the CCB is activated.
Macroprudential policies have recently attracted considerable attention. They aim at both strengthening the resilience of the financial system to adverse aggregate shocks and at actively limiting the build-up of financial risks in the sense of “leaning against the financial cycle”. One reason for the appeal of such policies is that, by explicitly taking a system-wide perspective, they complement macroeconomic and prudential measures in seeking to address systemic risks arising from externalities (such as joint failures and procyclicality) that are not easily internalised by financial market participants themselves. Against this background, the new Basel III regulatory standards feature the Countercyclical Capital Buffer (CCB) as a dedicated macroprudential tool designed to protect the banking sector from the detrimental effects of the financial cycle. We provide the first empirical analysis of the CCB based on data from Switzerland – which became the first country to activate such a buffer on February 13, 2013. To reinforce banks’ defenses against the build-up of systemic vulnerabilities, the activation of the CCB raised their regulatory capital requirements, thereby contributing to the sector’s overall resilience. However, little is known about the CCB’s contribution towards the second macroprudential objective: higher requirements might slow bank lending or alter the quality of loans during the boom and thereby enable policy-makers to “lean against the financial cycle”. Up to now, policy debates have focused mainly on the quantity of aggregate credit growth. We aim to shift the focus of the debate towards the quality, namely the composition of lenders and how tighter capital requirements interact with borrower risk characteristics. Does the CCB have the potential to shift lending from less resilient to more resilient banks, and from riskier to less risky borrowers? Based on our findings, our analysis advances the understanding of some mortgage supply side aspects about whether the CCB can contribute towards the second objective of macroprudential policy, the “leaning against the financial cycle”.
To answer these questions, we examine how the CCB affects the pricing of mortgages. Our unique dataset obtained from an online mortgage platform allows us to separate mortgage supply from demand: each mortgage request receives several binding offers from several different banks, and, each bank can offer mortgages to many different households with distinct borrower risk characteristics. To identify the CCB effect on mortgage supply, we exploit lagged bank balance sheet characteristics that might render a bank more sensitive to the regulatory design of the CCB. To examine whether risk-weighting schemes that link borrower risk characteristics to capital requirements do, in fact, amplify the CCB effect, we use comprehensive information as specified in the mortgage request. The procedures of the online mortgage platform warrant that banks submit independent offers that draw precisely on the same set of anonymized hard information observed by their competitors (and available to us), undistorted by any private or soft information.
Two sets of results stand out. First, the CCB affects the composition of mortgage supply. Once the activated CCB imposes higher capital requirements, capital-constrained banks with low capital cushions raise their mortgage rates relatively more than their competitors. Further, after the CCB is activated, specialized banks that operate a very mortgage-intensive business model also raise their mortgage rates to a greater degree in relative terms. In fact, the CCB applies to new mortgages as well as to the stock of all mortgages held on a bank’s balance sheet. Our results for specialized mortgage lenders thus suggest that banks try to pass on the extra capital costs of previously issued mortgages to new customers. Both insights are indicative of changes in the composition of mortgage supply. Based on the assumption that, ceteris paribus, households prefer lower mortgage rates over more expensive ones,2 we conclude that the CCB tends to shift new mortgage lending from relatively less well capitalized banks to relatively better capitalized ones, and from relatively more to relatively less mortgage-exposed banks. For these reasons, both changes in the composition of mortgage supply are broadly supportive of the second macroprudential objective in that they tend to allocate new mortgage lending to banks that are more resilient.
Our second set of core findings incorporates the borrower side and the effectiveness of common risk-weighting schemes that translate borrower risk into bank capital requirements. We find that banks generally claim extra compensation for granting riskier mortgages (ie, by charging higher mortgage rates). However, these risk-weighting schemes do not appear to amplify the effect of the CCB on mortgage rates or mortgage creation. Apparently, the link between borrower risk characteristics (here, loan-to-value (LTV) ratios) and capital requirements is too weak to actively discourage banks from offering mortgages to high-LTV borrowers after the CCB is activated.
Our paper contributes to the literature in three different respects. First, our empirical setup allows us to advance the understanding of the effects of the CCB as a macroprudential policy tool, particularly in the context of Basel III. More generally, our insights also contribute to a better understanding of how higher capital requirements impact the pricing of loans to private households. Second, our dataset allows us to disentangle mortgage supply from mortgage demand. By merging bank-level information with the respective offers, we can attribute changes in the composition of mortgage supply to distinct bank balance sheet characteristics that shape a bank’s pricing of mortgages. These dimensions of our data set our approach apart from standard analyses based on mortgage contracts, which have a blind spot with respect to the spectrum of all offered (but non-concluded) rates. Third, our analysis informs the debate on the effectiveness of risk-weighting schemes, a standard concept in bank regulation.
Note that BIS Working Papers are written by members of the Monetary and Economic Department of the Bank for International Settlements, and from time to time by other economists, and are published by the Bank. The papers are on subjects of topical interest and are technical in character. The views expressed in them are those of their authors and not necessarily the views of the BIS.
The less volatile trend estimate for Australian retail turnover rose 0.2 per cent in July 2015 following a 0.3 per cent rise in June 2015. The trend estimate rose 4.4 per cent compared to July 2014.
In seasonally adjusted terms there were rises in clothing, footwear and personal accessory retailing (2.9 per cent), department stores (1.3 per cent) and cafes, restaurants and takeaway food services (0.3 per cent). Food retailing (0.0 per cent) was relatively unchanged. There were falls in household goods retailing (-1.9 per cent) and other retailing (-0.6 per cent) following rises in both industries in June.
In seasonally adjusted terms there were rises in Queensland (0.3 per cent), Western Australia (0.3 per cent) and the Northern Territory (0.1 per cent). Tasmania was relatively unchanged (0.0 per cent). There were falls in New South Wales (-0.2 per cent), South Australia (-0.8 per cent), Victoria (-0.2 per cent) and the Australian Capital Territory (-0.2 per cent).
Online retail turnover contributed 3.1 per cent to total retail turnover in original terms.
When French academic and economist Thomas Piketty wrote a 700-page book about social inequality few would have expected it to become a bestseller.
Puzzled reviewers attempted to pin what merited the huge popularity it received. The popular Occupy movement? Moral support for improving human welfare? A gifted writer amongst academics?
Now, another inequality book, also with a red and black cover, has arrived in bookstores. At a much-shorter 384 pages, it’s written by economist Anthony Atkinson, who has been working on the topic of inequality for 50 years. Can lightning strike twice? Inequality, the sequel?
There is good news for those who liked Piketty’s book but didn’t manage to finish it. You can save yourself (and your summer reading list reputation) by just going to page 158 of Atkinson’s book where in one humble paragraph he gives you the answer at the end of Piketty’s universe: r > g.
More importantly, he translates it. The key mechanism governing the distribution of wealth is the difference between the rate of return on capital which is the r, and the rate of growth of the economy which is g. Even better news – you can buy the t-shirt.
Harvard University Press
Inequality: What can be done goes beyond Capital in the 21st Century by offering answers. Answers addressed hopefully to those who are minded to and can do something. A prescription for fixing the ailing patient.
Rather like the prosecution in a court action, the book starts by setting out the case exposing inequality: the evidence. The arguments that follow put aside reasons for action, and instead set out a factual “action to do list”.
The first answers are in part two. It turns out there are already common pills available that could just be done better, progressive taxes and transfers. He adds a call for smaller wage differentials within firms – yes, CEOs could give more back to their workers and slightly less to themselves.
Part three addresses the raised hackles part two always gets, the arguments against the excuses for inaction are given. This is a very valuable rebuttal primer for those that will need to make their case, again and again. Rather like Marie Antoinette, the cake often gets mentioned by opponents objecting dreadfully to the medicines Atkinson puts forward (they plead there will be a shrinking economic cake, but in this case the peasants don’t even get to eat it).
The best part is the eight-page climax: a concise bullet point list. Just right for action-minded readers.
But, what about Australian readers, do we need this medicine? Is Australia a fair society? Go to the index: Australia is listed. Spoiler alert: Australian inequality has risen since the 1980s.
My subtle gripe with the “what to do” answers: even if you get into government and do try to fix things by working through Atkinson’s list, you will need to read another book about “how to successfully do it”, especially if you try the transfers aspect. Something like “How to run a government so that citizens benefit and taxpayers don’t go crazy” by Michael Barber.
Playing devil’s advocate –- if these are the answers, then those minded to could use Atkinson’s list to deliver more inequality, by playing the record in reverse.
Because economics relies on a benevolent leader, the benevolent visible hand of government makes the economy fairer using policy that is in the public interest. A fly in the ointment is when public interest isn’t served, perhaps for re-election motives.
Helpfully, Atkinson’s list diagnoses their sound bytes and the inequality delivered.
Beware reductions of the top tax rate that deliver more inequality (but serve silver spoon lobbyists). Atkinson’s prognosis is progressive income tax rates with a marginal top rate of 65%, and broadening of the tax base.
Atkinson seems tuned in to the politics. “Heavy lifting” he says, falls to all levels of government, not just national!
Beware central bankers pleading efficiency (same old cake argument). Atkinson emphasises that distribution links GDP to citizens’ real life experiences.
Firstly, take action! Your choices can change things.
Atkinson’s manifesto argues countries still need investment in health, education and training. Explicit targets for unemployment reduction. A “Public Investment Authority” with a sovereign wealth fund that builds State net worth beyond taxes by investing in property and companies. A substantial child benefit amount paid to all children, but which can be taxed as income. “Social insurance”, with raised amounts and extended coverage – essentially a system of government transfers financed by contributions from employers, employees and government, protecting for economic hazards such unemployment, disability, injury and sickness, or old age.
Other suggestions include a capital endowment paid to all on adulthood (a grant of money that can be invested that gives a minimum inheritance to all). A progressive property tax based on regular valuations. Progressive lifetime capital taxes, with a progressive tax regime applied to inheritances and gifts received during a citizen’s life.
A cynical guess at what readers thought Piketty said that made a bestseller with new audiences? Capital (stocks, shares, real estate), will grow faster than income from earnings. An investment mantra on where your money will grow!
Author: Genevieve Knight, Senior Research Fellow, National Institute of Labour Studies at Flinders University
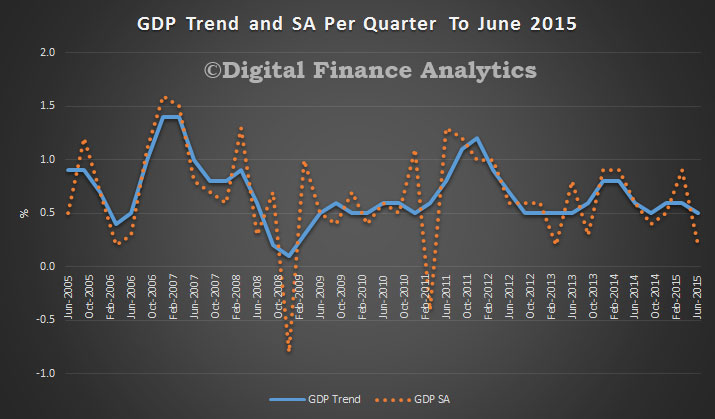
The ABS released their data today showing that in the June 2015 quarter national accounts, growth in the Australian economy slowing to 0.2% in seasonally adjusted chain volume terms and 2% over the past year. It was 0.5% in trend terms, our preferred measure (given recent statistical volatility), making an annual rate of 2.2%.
The ABS showed that reduced Mining and Construction activity, coupled with a decline in Exports were the main factors to the slowdown in economic growth. Positive contributions came from Domestic final demand, and the Financial, Transport and Health industries. Mining production fell significantly this quarter (-3.0%), although it is still positive through the year with growth at 2.1%. The decline in Mining production coincides with the fall in Exports. Net exports detracted 0.6 percentage points from GDP growth in the quarter, through the year they added 1.1 percentage points to GDP growth. This quarter continues to see the decline in mining related construction (Engineering construction -0.8%), which is reflected in the decline in Construction Gross value added (-0.6%).
There was positive growth in Domestic final demand with Household final consumption growing 0.5% this quarter and 2.5% through the year. Government final consumption had growth of 2.2% for the quarter and 4.0% through the year. Public gross fixed capital formation was up 4.0% for the June 2015 quarter, but remains subdued through the year with growth at 0.4%.
According to FitchRatings latest in their Global Perspectives series, policy responses to sharp corrections in financial markets should be expected as the Chinese government adheres to a core principle of maintaining stability.
Much Western criticism of Chinese policy responses to the equity market sell-off as clumsy and ineffective misreads critical points on China. Common views expressed are that Chinese officials don’t fully understand how markets operate, are manipulating the market, or have not yet developed policy channels and tools that are sufficiently sophisticated and adept to affect the market.
Stability a Higher Priority than Market Principle
The easiest misconception to take issue with is that intervention by Chinese policymakers confirms a lack of market insight. Even casual observers of China in recent decades would recognise the increased role of foreign firms and private innovation and the diminished role of the state. State enterprises retain a dominant role in critical areas of the economy, but private enterprise and market-based solutions have been vital to the country’s rapid industrialisation and development.
But the Chinese authorities’ deep aversion to instability – broadly defined, including financial instability – means there are limits to their embrace of market-based principles. Although the equity market is small from a macroeconomic perspective, a period of free-fall would sit uncomfortably with a government that does not hide its desire to retain and control the status quo in so many other areas.
In this context, recent equity market interventions were less about denying market principles than about confirming a stronger preference for stability, and for the state to have a primary role in providing it. The preference for stability would have been better placed had it come prior to the equity bubble inflating, but the government actually had an active role last year in encouraging investment in the market. This provided even stronger motivation to intervene during the market correction.
Collective Policymaking and Possibly More Debt
Even if public opinion could be swayed, creditors may take the view that there is still the need for significant policy change in Greece, and that debt relief would simply address the consequences of previous shortcomings, not the root causes. Greece still needs to undertake major reforms to deliver sustainable public finances and more robust economic growth, and creditors may be reluctant to surrender the ongoing conditionality provided by support programmes that could be discontinued if there were wholesale debt forgiveness. The risk would be that Greek imbalances re-emerge, eventually threatening the viability of the eurozone again.The various policy responses to the decline in the equity market have two familiar features – they involve a large number of participants and there is likely to be a resulting increase in debt.
The “national team” of public institutions involved in providing direct and indirect support to the equity markets has been portrayed by some observers as disjointed and ineffectual, primarily because there were several initiatives announced to which there was little or no market response. In addition, it has been argued that with so many institutions involved, including the Ministry of Finance and the People’s Bank of China (PBOC), none took a clear lead or stood out as having the credibility or authority to single-handedly sway the markets in the way that the Federal Reserve and European Central Bank were able to during episodes of stress in their markets.
But this misses the point that China’s patchwork of financial supervision and regulation is consistent with a deliberately diffused policy framework. This arrangement is in place not because a consensus-driven approach to decision-making is favoured – in fact, in some cases responsibilities are overlapping and initiatives at cross-purposes. Instead, policy diffusion is intended to ensure that state organisations operate collectively under the ultimate guidance of the country’s political leaders. As such, China’s authorities are unlikely to conclude from criticisms of the “national team” that they need a Greenspan or a Draghi to personify economic influence and authority. It is equally unlikely that there will be a regulatory overhaul to raise one institution to a coordinating “super-regulator”, as has been proposed by some foreign observers.
Just as the equity market was egged higher during its upswing in part by increases in debt – specifically via margin and peer-to-peer lending – elements of the policy responses to the downturn are also likely to raise debt levels. In July the China Securities Regulatory Commission (CSRC) relaxed some margin lending requirements of brokers, reversing a trend towards tightening earlier this year. The CSRC is also reported to have extended credit of RNB260bn to brokers, with funding from the bond market, banks and liquidity provided by the PBOC. Additionally, the China Banking Regulatory Commission has allowed banks to take a more flexible approach to corporate loans collateralised by equities, and has encouraged them to lend to listed companies engaged in stock buy-backs and to the CSRC.
The specific equity market initiatives that may increase debt should not be interpreted as a change in policy direction, as one of the authorities’ overriding objectives remains a reduction of indebtedness in the economy. The risks of potential solvency problems at current debt levels have been central to the acceptance and adoption of lower economic growth targets. But, as with other immediate policy challenges in China, the authorities see a further build-up in debt as a reliable – and presumably short-term – solution.