NZ Official Cash Rate unchanged at 2.25 percent

The Reserve Bank NZ today left the Official Cash Rate unchanged at 2.25 percent.

The outlook for global growth has deteriorated over recent months due to weaker growth in China and other emerging markets.  Prices for some commodities, including oil, have picked up but remain weak.

Monetary conditions are extremely accommodative internationally, with considerable quantitative easing and negative policy rates in some countries.  Financial market volatility has eased in recent weeks, but markets continue to watch closely the policy settings of major central banks.

Domestically, the economy is being supported by strong inward migration, construction activity, tourism, and accommodative monetary policy.  Dairy export prices have improved slightly, but are below break-even levels for most farmers.

The exchange rate remains higher than appropriate given New Zealand’s low commodity export prices.  A lower New Zealand dollar is desirable to boost tradables inflation and assist the tradables sector.

There are some indications that house price inflation in Auckland may be picking up.  House prices remain at very high levels and additional housing supply is needed.  Housing market pressures are building in some other regions.

There are many uncertainties around the outlook.  Internationally, these relate to the prospects for global growth, particularly around China, and the outlook for global financial markets.  The main domestic risks relate to weakness in the dairy sector, the decline in inflation expectations, the possibility of continued high net immigration, and pressures in the housing market.

Headline inflation remains low, mostly due to low fuel and other import prices.  Annual core inflation remains within the target range.  Long-term inflation expectations are well-anchored at 2 percent.  However, as we have previously noted, there has been a material decline in shorter-term expectations.

We expect inflation to strengthen as the effects of low oil prices drop out and as capacity pressures gradually build.  Monetary policy will continue to be accommodative.  Further policy easing may be required to ensure that future average inflation settles near the middle of the target range.  We will continue to watch closely the emerging flow of economic data.

The way Australia taxes housing is manifestly unfair

From The Conversation.

When politicians talk about tax and fairness, it’s easy for them to point out undeserved loopholes benefiting the wealthy, or multinational companies. But the elephant in the room is the difference between those who own and those who rent (or have recently bought and have huge mortgages) the house they live in.

The tax advantages of housing offend against justice on every count: they place financial stresses on the poor, they are unequal, and the increase in price is not deserved.

Owner-occupied houses are exempt from income and capital gains tax, and from social welfare means tests. Negative gearing gives investment properties a tax advantage, which is exacerbated by discounts on rates of capital gains tax. Rent assistance given to those on social security (currently a maximum of A$130 per week) is not sufficient to compensate for the difference.

The high price of housing is created by tax inequalities and by supply and demand imbalances created by government failure. At the same time, the government has encouraged banks to borrow hundreds of billions offshore to fund greater mortgage debt – pushing prices higher. Foreign depositors are faced with a low 10% withholding tax (reduced from 15%), and have not been subject to adequate money laundering controls.

And there is not much social benefit in higher house prices to counteract the costs to non-homeowners. Higher prices have not led to a significant increase in supply over time; people do not spend the increase, nor use it much to fund their retirement.

Defining ‘justice’

The word justice is used so widely, it needs some definition. While “fairness” is applied more widely, justice can be used to incorporate four sometimes conflicting objectives. Justice seeks, as much as possible to:

  • Contribute to economic equality
  • Give each person their just deserts
  • Meet people’s essential needs
  • Allow for personal liberty by not interfering in people’s lives.

Such a model of justice can be used to evaluate tax systems.

For those concerned that justice comes at a cost to efficiency and economic growth – there is considerable evidence to show that the relationship, where it exists, is positive. Giving people their just deserts provides the material incentives so beloved of economists. Evidence from a broad group of countries shows little overall relationship between income inequality and rates of growth and investment. Fairer taxes lead to greater compliance with tax laws. Research has found a significant increase in Australian tax morale between 1981 and 1995, which was explained by reforms that people saw as making the system more just.

Clouded by politics

Amid the ongoing debate about tax reform during the last year, many had hoped for some meaningful changes in the coming federal budget.

Instead, the current debate on the tax system, and more recently negative gearing, is concerned with perceptions of political acceptability.

This was also typified by the dismissal of any change to the taxation of housing in the Re:think tax discussion paper:

“Given the central importance of the home for Australian families, there is a strong consensus that it would not be appropriate to tax either the imputed rent on owner-occupied housing or capital gains derived from it.”

“Strong consensus”, whatever that means, is not a good reason if it involves injustice. The argument works the other way: given the central importance of the home, and its place in income and assets, it is essential for housing to be included in our tax and welfare systems. Let’s be the land of the fair go, even if we have to give up some personal advantages.

Reform options

Addressing the issue is complicated politically in that around 70% of voters own their houses, and a significant minority have borrowed heavily to get into the market in recent times. If prices drop, they will suffer through no fault of their own, as would the banking industry. With more than two million shareholders, banks are also strong politically.

The Henry tax review did, however, recommend a transition from stamp duties to a land tax, a significant increase in rental assistance and the removal (albeit with a high threshold) of the exemption of owner occupied homes from the means test for pensions.

The greater efficiency, and justice, of land taxes means that they have fairly widespread support from informed commentators. Taxes on property currently raise A$29 billion annually for the states and another A$14 billion for local governments in Australia. If land accounts for 50% of the value of residential housing, the additional revenue would be of the order of A$75 billion. Another A$40 billion might be possible if commercial land was also be included.

Removing capital gains discounts and taxing imputed rents should also be considered. Research released in 1994 found the latter would be both efficient and more equitable in Australia. The advantage of this is that such a system allows for the tax deductibility of mortgage repayments, so would provide compensation for the minority that had recently bought into the housing market. A higher withholding tax on international deposits would also reduce the availability of funds to push up assets, and encourage local businesses by removing some of the artificial support for the currency.

Housing accounts for more than 60% of the value of total assets held by Australians. Translated into imputed rent it amounts to about A$150 billion annually, or 20% of the gross personal income of those who own their homes. If taxed at marginal rates of tax, imputed rents would add about a third to current personal tax of A$190 billion annually.

This article is a summary of a paper “The justice of 2016 Australian tax and redistribution” to appear in the St Mark’s Review.

Author: Anthony Asher, Associate Professor, UNSW Australia

ANZ Offers Apple Pay In Australia

The first major Australian bank to offer Apple Pay, ANZ, today announced it will offer the service to its five million customers in Australia.

ANZ customers in Australia are now able to use Apple Pay to make quick and secure purchases wherever contactless payments are accepted with either an ANZ Visa debit or credit card or an ANZ American Express credit card.

ANZ Chief Executive Officer Shayne Elliott said: “The introduction of Apple Pay is a significant milestone in our strategy to use digital technology to provide our customers with a superior experience and will be a watershed moment in the adoption of mobile payments in Australia.

“I’m proud we’re the first major Australian bank to offer Apple Pay and we are confident the convenience, security and privacy will be well received by our customers.

“With the high adoption rates of contactless payments in Australia, our customers will be world leaders in their ability to use their mobiles to make the vast bulk of essential payments,” Mr Elliott said.

More than 60% of all card transactions in Australia are now contactless and accepted across in excess of 70% contactless merchant payment terminals.

Security and privacy is at the core of Apple Pay, so when used with a credit or debit card, the actual card numbers are not stored on the device, nor on Apple servers. Instead, a unique Device Account Number is assigned, encrypted and securely stored in the Secure Element of the device. Each transaction is authorised with a one-time unique dynamic security code.

Apple Pay is easy to set up and users will continue to receive all of the rewards and benefits offered by credit and debit cards.

In stores, Apple Pay works with iPhone SE, iPhone 6s, iPhone 6s Plus, iPhone 6, iPhone 6 Plus and Apple Watch.

Online shopping in apps accepting Apple Pay is as simple as the touch of a finger with Touch ID, so there’s no need to manually fill out lengthy account forms or repeatedly type in shipping and billing information. When paying for goods and services within apps, Apple Pay is compatible with iPhone 6 and later, as well as iPad Air 2, iPad mini 3 and iPad Pro.

Personal insolvency increased 1.5% in the March quarter 2016

The Australian Financial Security Authority (AFSA) released regional personal insolvency statistics for the March quarter 2016.

The number of debtors who entered a personal insolvency increased 1.5% in the March quarter 2016 compared to the December quarter 2015. The increase was driven by Queensland and Western Australia. The number of debtors who entered a personal insolvency in Queensland in the March quarter 2016 rose 5.1% compared to the December quarter 2015. The number of debtors in Western Australia in the March quarter 2016 rose 10.9% compared to the December quarter 2015.

New South Wales

·         Greater Sydney

    • In the March quarter 2016 compared to the December quarter 2015:
      • the number of debtors fell 4.3%; the main contributors to the fall were Blacktown, Campbelltown and Bankstown
      • the number of debtors who entered a business related personal insolvency fell 10.4%; the main contributors to the fall were Wyong and Cronulla – Miranda – Caringbah.

·         Rest of NSW

    • In the March quarter 2016 compared to the December quarter 2015:
      • the number of debtors fell 2.9%; the main contributors to the fall were Coffs Harbour and Wagga Wagga
      • the number of debtors who entered a business related personal insolvency rose 13.2%; the main contributors to the rise were Coffs Harbour and Newcastle.

Victoria

·         Greater Melbourne

    • In the March quarter 2016 compared to the December quarter 2015:
      • the number of debtors rose 7.6%; the main contributor to the rise was Cardinia
      • the number of debtors who entered a business related personal insolvency fell 10.9%; the main contributors to the fall were Melton – Bacchus Marsh, Casey – South and Frankston.

·         Rest of Vic

    • In the March quarter 2016 compared to the December quarter 2015:
      • the number of debtors fell 7.9%; the main contributors to the fall were Bendigo and Ballarat
      • the number of debtors who entered a business related personal insolvency fell 38.2%; the main contributor to the fall was Bendigo.

Queensland

·         Greater Brisbane

    • In the March quarter 2016 compared to the December quarter 2015:
      • the number of debtors increased 2.3%; the main contributors to the increase were Ipswich Hinterland and Browns Plains
      • the number of debtors who entered a business related personal insolvency fell 6.1%; the main contributor to the fall was Holland Park – Yeronga.

·         Rest of Qld

    • In the March quarter 2016 compared to the December quarter 2015:
      • the number of debtors increased 7.8%; the main contributor to the increase was Townsville
      • the number of debtors who entered a business related personal insolvency was stable at 262 debtors.

South Australia

·         Greater Adelaide

    • In the March quarter 2016 compared to the December quarter 2015:
      • the number of debtors increased 0.3%; the main contributors to the rise were Salisbury and Adelaide Hills
      • the number of debtors who entered a business related personal insolvency fell 5.5%; the main contributor to the fall was Tea Tree Gully.

·         Rest of SA

    • In the March quarter 2016 compared to the December quarter 2015:
      • the number of debtors fell 10.2%; the main contributors to the fall were Fleurieu – Kangaroo Island, Limestone Coast and Eyre Peninsula and South West
      • the number of debtors who entered a business related personal insolvency rose 21.4%.

Western Australia

·         Greater Perth

    • In the March quarter 2016 compared to the December quarter 2015:
      • the number of debtors rose 13.1%; the main contributors to the increase were Rockingham and Wanneroo
      • the number of debtors who entered a business related personal insolvency fell 12.2%; the main contributors to the fall were Stirling, Mandurah and Joondalup.

·         Rest of WA

    • In the March quarter 2016 compared to the December quarter 2015:
      • the number of debtors increased 1.3%; the main contributor to the rise was Mid West
      • the number of debtors who entered a business related personal insolvency fell 23.5%.

Tasmania

  • In the March quarter 2016 compared to the December quarter 2015:
    • the number of debtors increased 11.5% in Greater Hobart; the main contributor to the rise was Hobart – North East
    • the number of debtors fell 14.9% in rest of Tas; the main contributors to the fall were Launceston and Devonport
    • the number of debtors who entered a business related personal insolvency in Tasmania fell 24.1%.

Northern Territory

  • In the March quarter 2016 compared to the December quarter 2015:
    • the number of debtors fell 16.1% in Greater Darwin; the main contributor to the fall was Darwin Suburbs
    • the number of debtors fell 52.2% in rest of NT; the main contributor to the fall was Alice Springs
    • the number of debtors who entered a business related personal insolvency in Northern Territory fell 28.6%.

Australian Capital Territory

  • In the March quarter 2016 compared to the December quarter 2015:
    • the number of debtors rose 8.5%; the main contributor to the increase was Gungahlin
    • the number of debtors who entered a business related personal insolvency rose 50.0%.

Personal insolvency in Australia: number of debtors per state/territory

https://www.afsa.gov.au/resources/statistics/regional-statistics/regional-statistics-images/march-quarter-2016/personal-insolvency-in-australia-number-of-debtors-per-state-territory


Where To For Perth Home Prices?

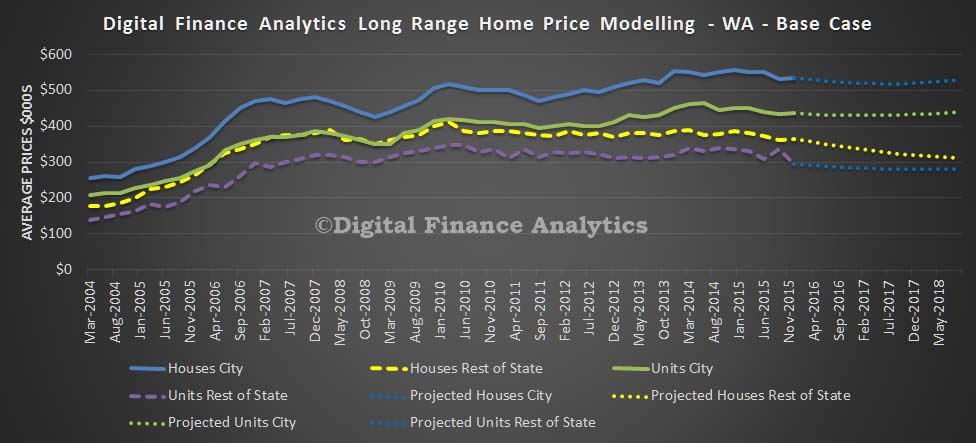
We continue our series of home price modelling by state. Today we look at WA. You can read about our modelling and scenarios.

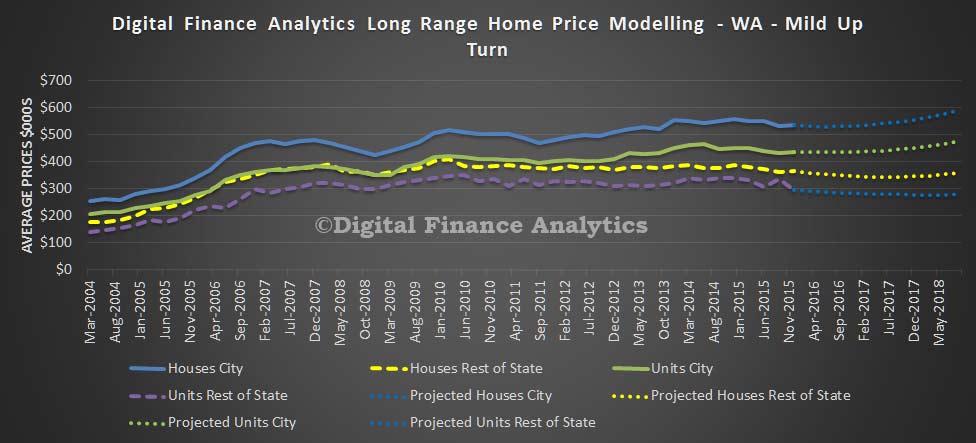
In our base case to mid 2018, we expect to see the average house price in Perth fall by 1.4% to $528,000 and the average unit price in Perth rise by 0.7% to $438,000. In the regional areas, the average house price will fall by 14.6% to $312,000 and units will fall 5.3% to $279,000.

WA-April-2016---BaseIf economic activity  picks up to mid 2018, we expect to see the average house price in Perth rise by 10.1% to $589,000 and the average unit price in Perth rise by 9.5% to $477,000. In the regional areas, the average house price will fall by 2.3% to $357,000 and units will fall 5.6% to $279,500.

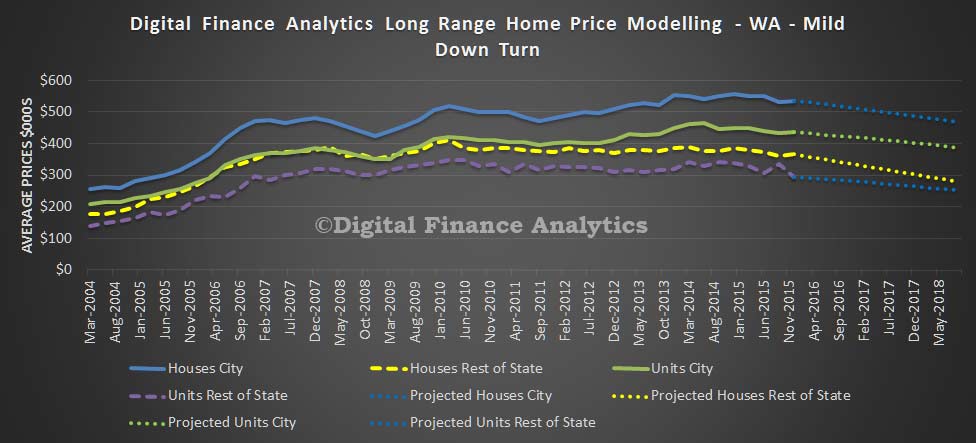
WA-April-2016---UpIf economic activity slows to mid 2018, we expect to see the average house price in Perth fall by 12.6% to $467,000 and the average unit price in Perth fall by 11.2% to $386,000. In the regional areas, the average house price will fall by 23.6% to $279,000 and units will fall 14.8% to $251,000.

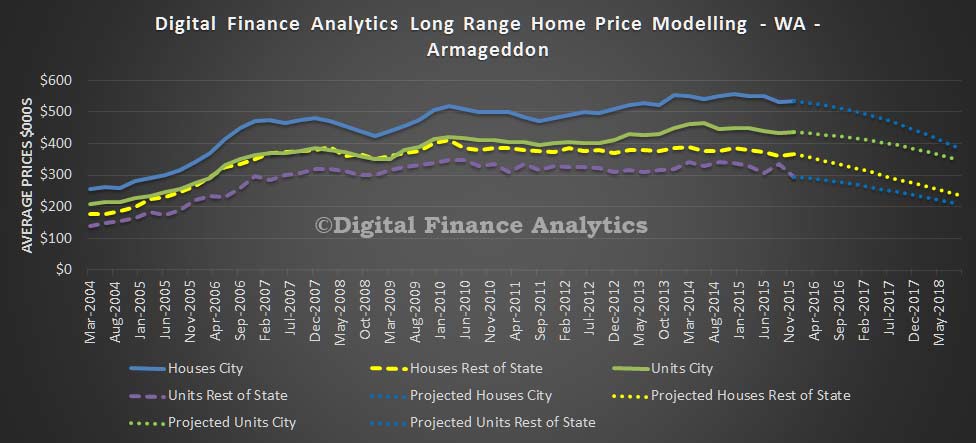
WA-April-2016---DownIf economic activity falls significantly to mid 2018, we expect to see the average house price in Perth fall by 27.9% to $386,000 and the average unit price in Perth fall by 20.1% to $347,000. In the regional areas, the average house price will fall by 35.0% to $237,000 and units will fall 29.4% to $208,000.

WA-April-2016---SevereThis shows the WA market is quite fragile, despite considerable construction momentum, and interest from first time buyers. The modelling is designed to show relative sensitivity rather than making absolute predictions.


Consumer Price Index falls 0.2 per cent

The Consumer Price Index (CPI) fell 0.2 per cent in the March quarter 2016 according to latest figures from the Australian Bureau of Statistics (ABS).

This follows a rise of 0.4 per cent in the December quarter 2015.

The CPI rose 1.3 per cent through the year to the March quarter 2016, following a rise of 1.7 per cent through the year to the December quarter 2015.

The fall in the CPI this quarter was broad based, with six out of the eleven CPI groups recording a fall for the quarter.

The most significant fall occurred in transport (–2.5 per cent), due to automotive fuel (–10.0 per cent) falling for the third consecutive quarter.

Recreation and culture (–1.0 per cent) was the second most significant contributor, with falls in both international holiday travel and accommodation (–2.0 per cent) and domestic holiday travel and accommodation (–1.9 per cent).

Food and non–alcoholic beverages (–0.2 per cent) also fell this quarter, with fruit (–11.1 per cent) providing the most significant contribution.

These falls were partially offset by rises in secondary education (+4.6 per cent), medical and hospital services (+1.6 per cent) and pharmaceutical products (+4.8 per cent).

Where To With Brisbane Home Prices?

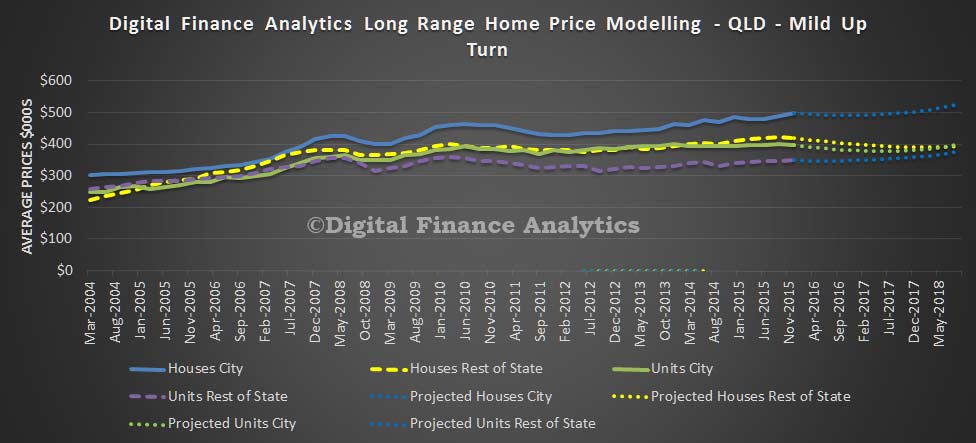
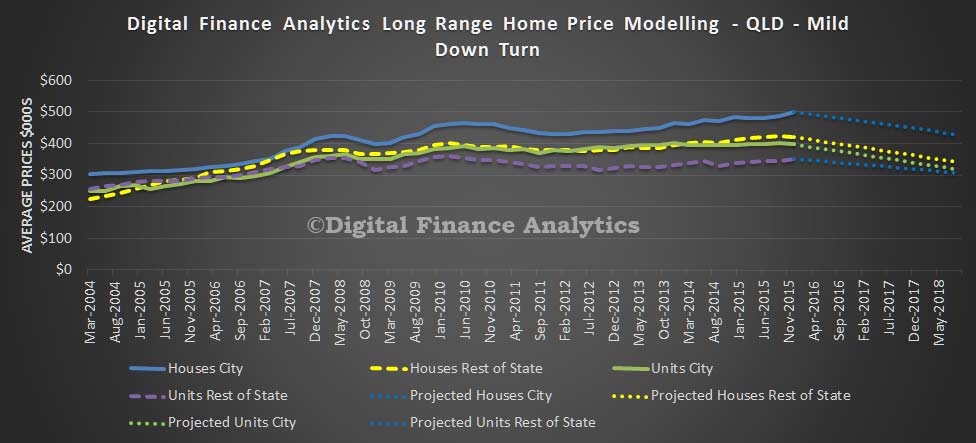
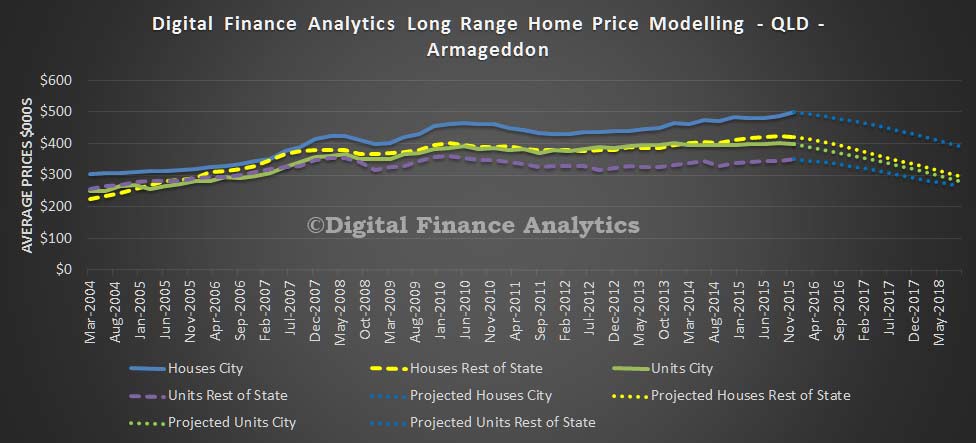
Continuing our modelling of future home prices, as described in our earlier post, today we look at QLD and run the analysis against our various scenarios.

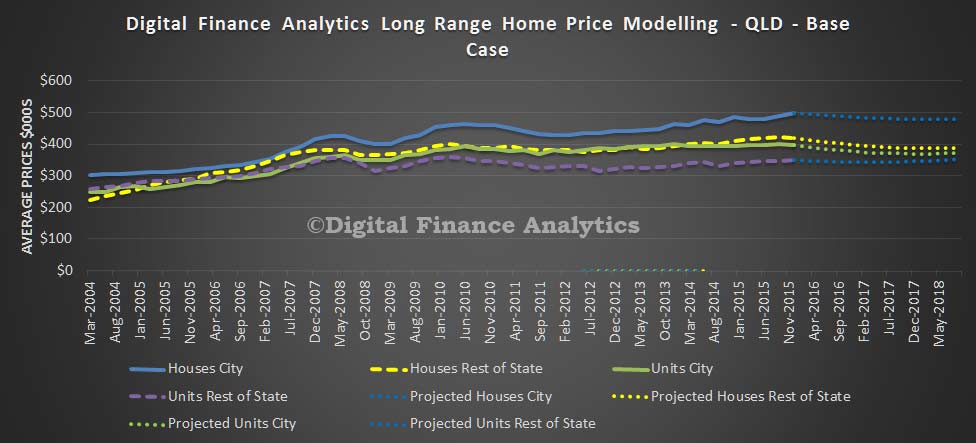
In our base case to mid 2018, we expect to see the average house price in Brisbane fall by 3.9% to $481,000 and the average unit price in Brisbane fall by 6.2% to $372,000. In the regional areas, the average house price will fall by 7.6% to $388,000 and units will rise 0.7% to $353,000.

QLD-Based-Apr-2016If economic activity picks up to mid 2018, we expect to see the average house price in Brisbane rise by 5.3% to $526,000 and the average unit price in Brisbane rise by 0.6% to $399,000. In the regional areas, the average house price will fall by 5.9% to $395,000 and units will rise 7.9% to $378,000.

QLD-Up-Apr-2016If economic activity slows to mid 2018, we expect to see the average house price in Brisbane fall by 14.6% to $427,000 and the average unit price in Brisbane fall by 20.1% to $317,000. In the regional areas, the average house price will fall by 18.9% to $340,000 and units will fall 12.4% to $307,000.

QLD-Down-Apr-2016Finally, if economic activity falls significantly to mid 2018, we expect to see the average house price in Brisbane fall by 21.7% to $391,000 and the average unit price in Brisbane fall by 29.5% to $280,000. In the regional areas, the average house price will fall by 29.2% to $297,000 and units will fall 24.6% to $264,000.

QLD-Fall-Apr-2016Essentially, regional areas in QLD are more exposed to economic down turns than Brisbane. Also, investment property purchases are a large proportion of transactions, and these are very sensitive to economic variables. Whilst this modelling will be wrong, it does give an indication of relative sensitives.

Tomorrow we will look at Western Australia.


Grattan Institute Defends Negative Gearing Reform

Long overdue changes to negative gearing and capital gains tax would save the Commonwealth Government about $5.3 billion a year, according to a new Grattan Institute report.

Hot property: negative gearing and capital gains tax reform shows that the interaction of a fifty per cent capital gains tax discount with negative gearing distorts investment decisions, makes housing markets more volatile and reduces home ownership.

The two measures in combination allow investors to reduce and defer personal income tax, at an annual cost of $11.7 billion to the public purse. Other taxes, which often drag more on the economy than a capital gains tax does, must be higher as a result.

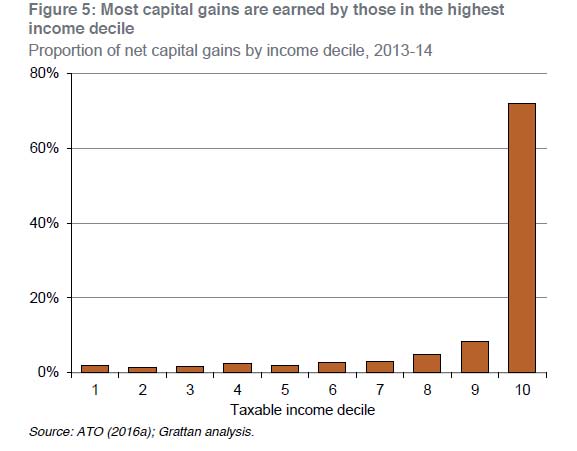
And like most tax concessions, these tax breaks largely benefit the wealthy.

Gtattan-NegativeThe report recommends that the capital gains tax discount should be reduced from 50 to 25 per cent, and that negatively geared investors should no longer be allowed to deduct losses on their investments from labour income.

A smaller discount would save about $3.7 billion a year, while the change to negative gearing would raise $2 billion a year in the short term, falling to $1.6 billion as losses start to be written off against positive investment income.

The reforms would provide relief to the Budget in tough times and slightly improve housing affordability with little impact on how much people save, says Grattan CEO and report co-author John Daley.

‘We estimate property prices would be up to two per cent lower under these reforms than they would be otherwise,’ Mr Daley says.

‘Contrary to urban myth, rents won’t change much, nor will housing markets collapse. The effects on property prices would be small compared to factors such as interest rates and the supply of land.’

The report recommends phasing in the reforms, to make them easier to sell and to prevent a rush of investors selling property before the changes come into force.

While other proposals, such as restricting negative gearing to new properties or limiting the dollar value of deductions, would improve the current regime, they nevertheless leave too many problems in place and introduce unnecessary distortions.

‘These two sensible reforms won’t hurt private savings much but will save the government a lot of money,’ Mr Daley says.

Read the report

Negative Gearing IS Off The Budget Table

From Business Insider.

Australian prime minister Malcolm Turnbull has taken negative changes off the table for the May budget.

The announcement was made at a doorstop in Sydney this morning by Turnbull and treasurer Scott Morrison who noted that the federal government “had the common sense to leave the system as it is”.

They criticised Labor’s “reckless change, reckless housing tax” that would lead to homes being devalued and less investment.

“Labor’s housing tax plan will deliver a reckless trifecta of lower home values, higher rents and less investment,” said Turnbull. “The key to improving housing affordability is more houses, more dwellings.”

“Labor is taking a sledgehammer to the ambitions of mums and dads who want to invest — whether it’s established houses and apartments, commercial property, shares in listed companies, or shares in their own business,” he said.

The announcement confirms comments made earlier this morning by government minister Michaelia Cash.

“We have made a determination that based on where the housing market in Australia is at the moment, and it is unfortunately looking at prices dropping, we will be making no changes to negative gearing,” Cash told Sky News.

“We are going to back the Australian people every step of the way and not impose a tax.”

Shadow treasurer Chris Bowen said that the Turnbull government was determined to run “a great big scare campaign” noting that “the level of first home buyers is at its lowest, the number of investors buying is at its highest”.

Mortgage Delinquencies Higher – S&P

From Business Insider.

The mortgage arrears rate for Australian home owners is the highest it’s been in more than a year the latest Standard & Poor’s (S&P) Rating Services Mortgage Performance Index (SPIN) shows. That’s the fourth consecutive month in which arrears have risen and S&P said that the increase was across all loan types.

The SPIN is a measure of arrears in Australian residential mortgage-backed securities (RMBS)- effectively bonds issued by banks, and other lenders, in the Australian market – which are supported by the underlying cash flows of a pool of home loans. It’s not the whole market, but because of APRA rules around the performance of these securities they can be taken as representative of the entire Australian national home loan book.

So the good news is that only around 1.11% of prime RMBS were in arrears as of February 29, SPIN showed. That was up from 1.07% in January and well off the low of 0.91% in September last year.

S&P said that a large part of the result is seasonal.

“Some of the increase reflects a decline in outstanding loan balances, there is also a seasonal component at play,” S&P said noting that “arrears typically increase in January and February, reflecting the effects of Christmas spending, holidays, and January sale periods”.

S&P also said “Low doc” loans and non-conforming loans also rose to 4.55% and 4.91% respectively while by lender type the data showed that the rise was across all lenders.

“Regional banks recorded the highest arrears of all originator types, reaching 2.15% in February, up from 2.04% a month earlier. The nonbank financial institutions meanwhile recorded the lowest arrears of all originator types, at 0.76%, up from 0.75% in January”.

The uptick in regional bank loans no doubt reflects the mortgage stress highlighted by the Reserve Bank in its Financial Stability Review earlier this month.

The RBA said that while “overall stress in banks’ household loan portfolios remain low… an exception to this general theme is that regions heavily reliant on the mining sector have experienced large falls in housing prices and deteriorations in credit performance”.

Overall Australia still has very low arrears and Australian consumers have large mortgage offset buffers, as well as many borrowers being well ahead of scheduled payments. But the trend is your friend as they say. Or in this case maybe not.