ANZ has announced a statutory profit after tax for the half year ended 31 March 2016 of $2.7 billion down 22% and a cash profit of $2.8 billion down 24%, following a $717 million net charge primarily related to initiatives to re-position the Group for stronger profit before provisions growth in the future. The new CEO is clearing the decks!
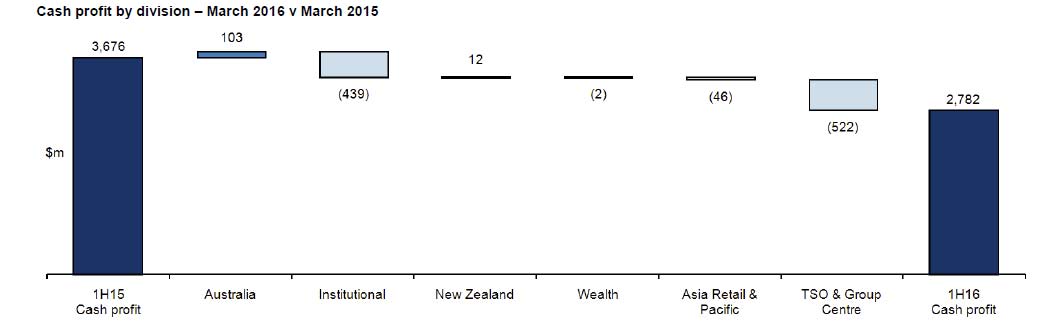
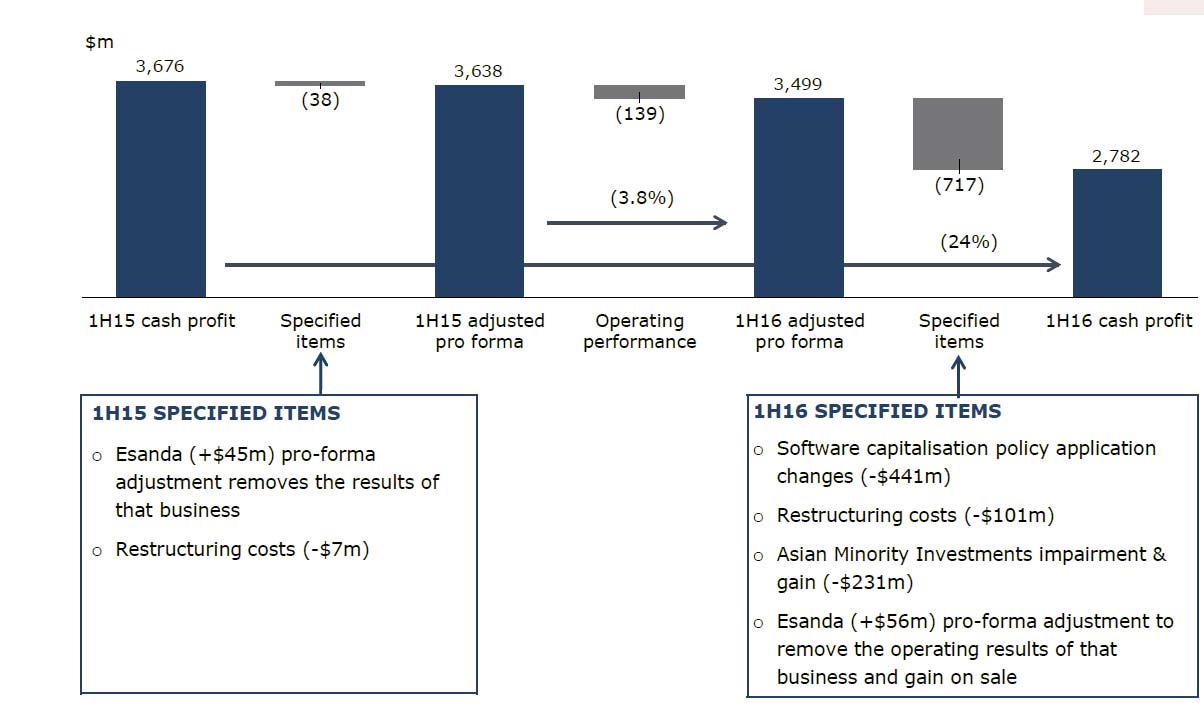 The main hits came from the Institutional Bank and Specific Items as part of the banks refocus under the new CEO. Specific items are (on an after tax basis): an accounting change to the application of the Group’s software capitalisation policy ($441 million), impairment of the Group’s investment in AmBank ($260 million), a net gain in relation to Bank of Tianjin ($29 million) and Group restructuring expenses ($101 million), as well as the Esanda dealer finance sale ($56 million).
 Excluding these Specified Items, allowing for better comparison with previous periods, adjusted pro-forma cash profit was $3.5 billion down 4% and profit before provisions was up 5%. Operating profit was $3,499m which was flat compared with 2H15, and down 4% from 1H15 ($3,676m).
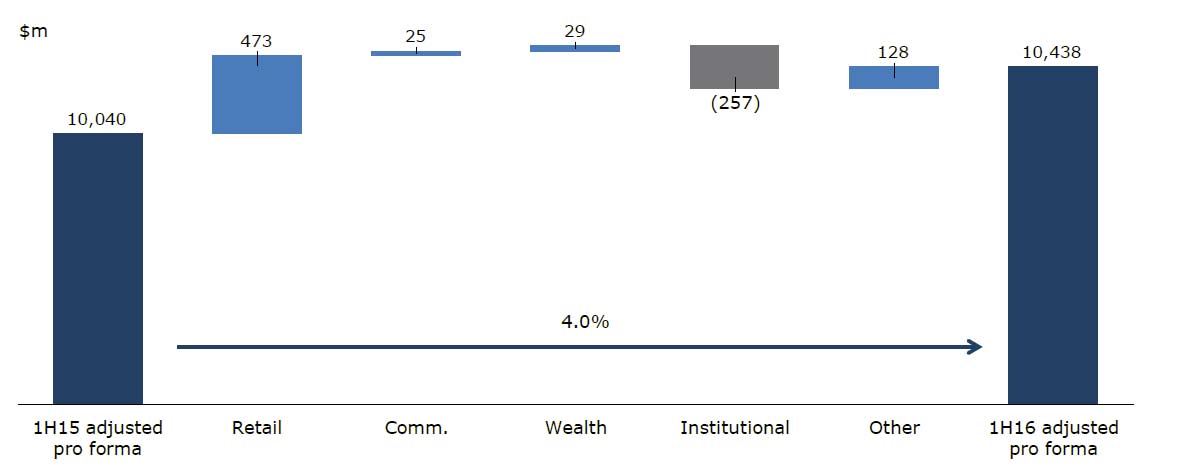
Operating income lifted 4% from 1H15, to $10,438m, or 2% compared with 2H15. The main fall was in the Institutional bank.
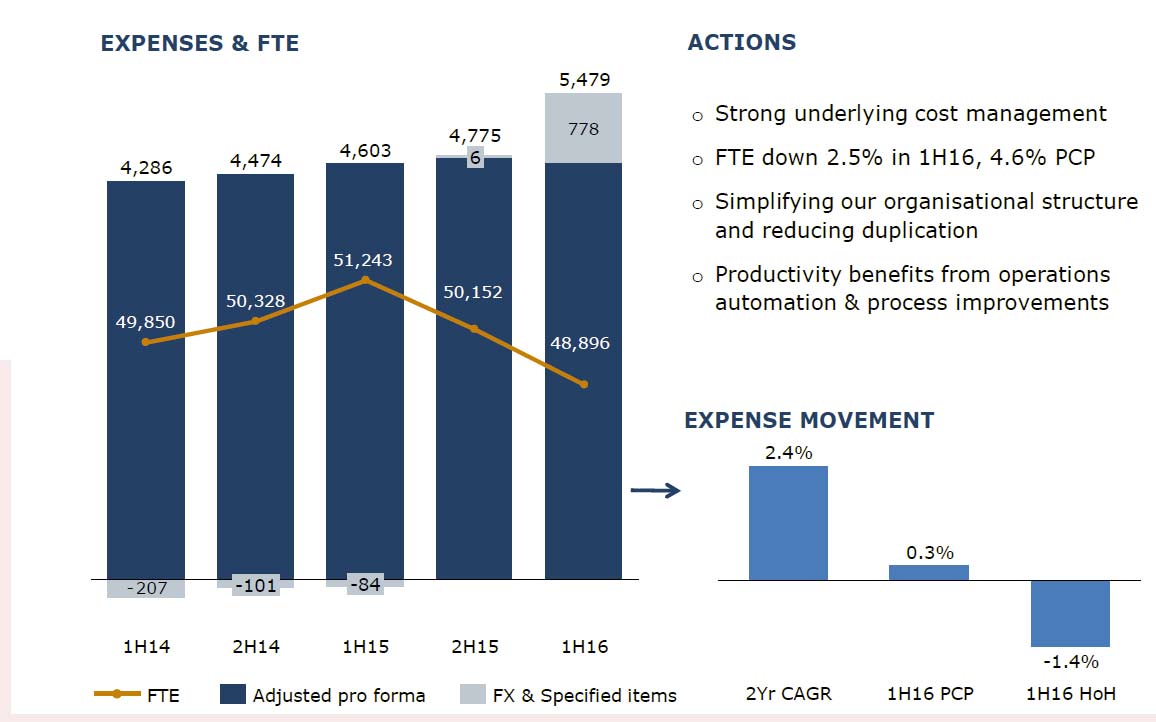
Operating expenses fell on a restated basis, to $4,701m, down 1%, but is 3% higher compared with 1H15 ($4,572m). Expenses should fall further as the business is simplified.
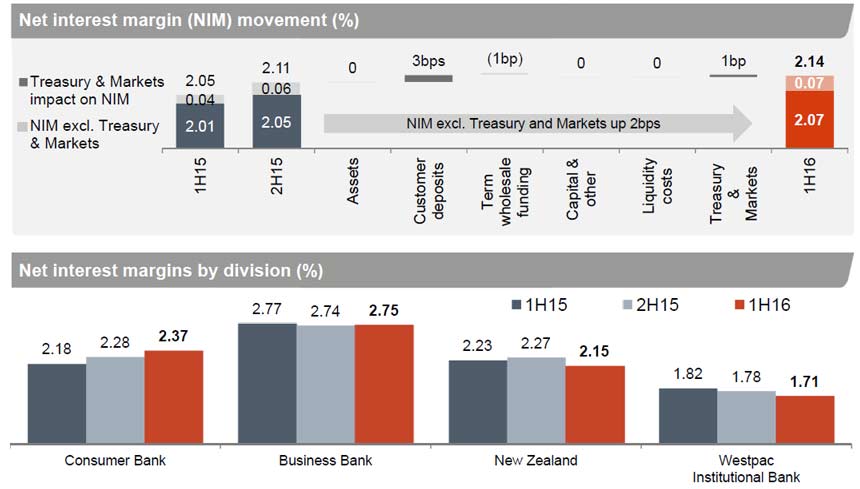
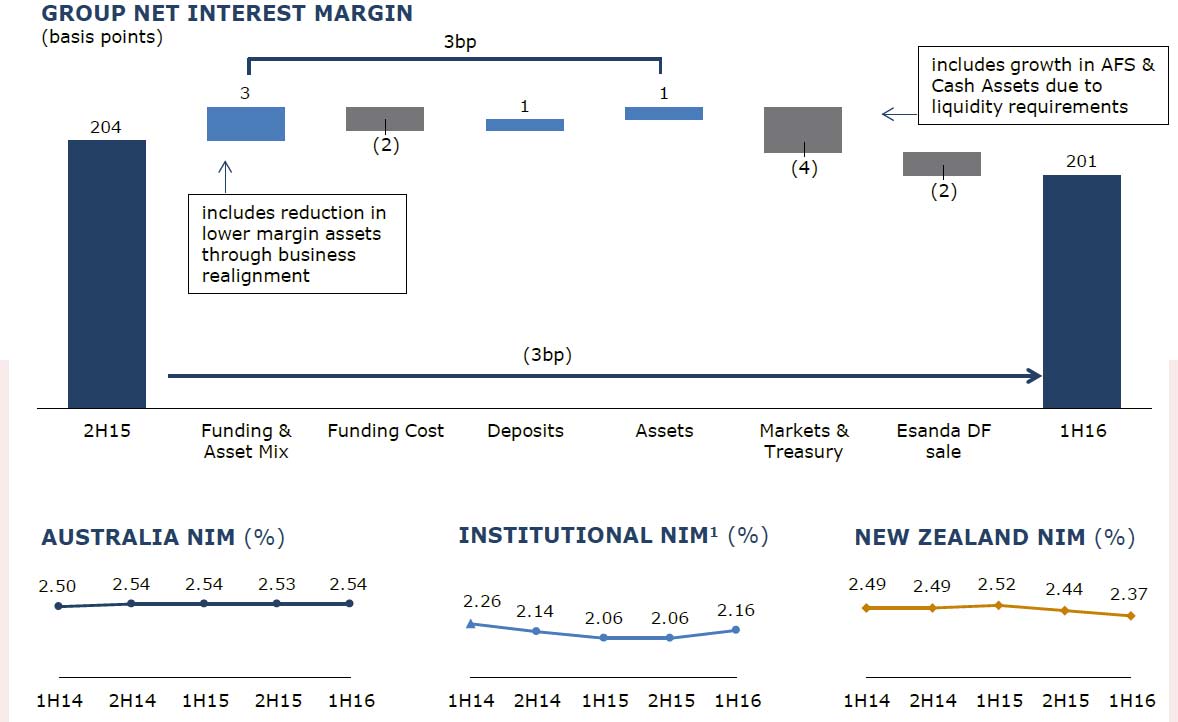
 The group net interest margin fell by 3 basis points, thanks to falls in New Zealand. NIM in Australia rose slightly.
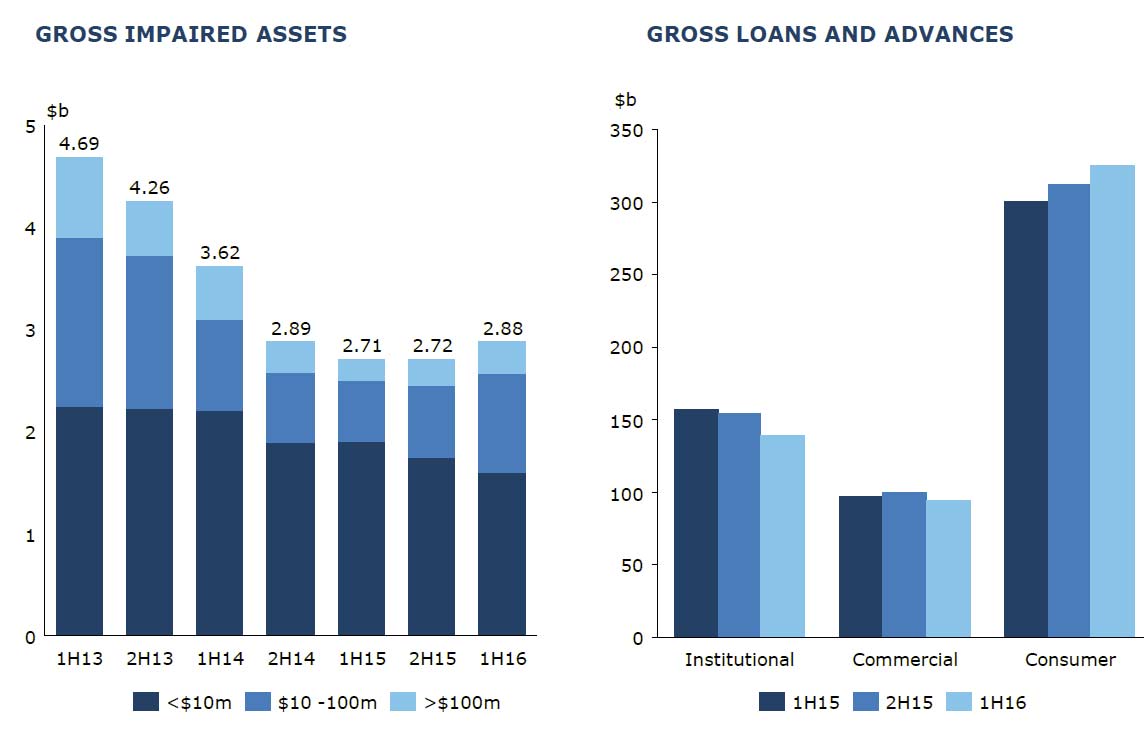
 The total provision charge of $918 million ($892 million individual provision charge $26 million collective provision charge) is consistent with ANZ’s ASX disclosure of 24 March and equates to a 32 basis point loss rate. The loss rate is trending towards the long term average from historically low levels. Gross impaired assets were $2.9 billion up 6%, with new impaired assets flat compared to the prior half.
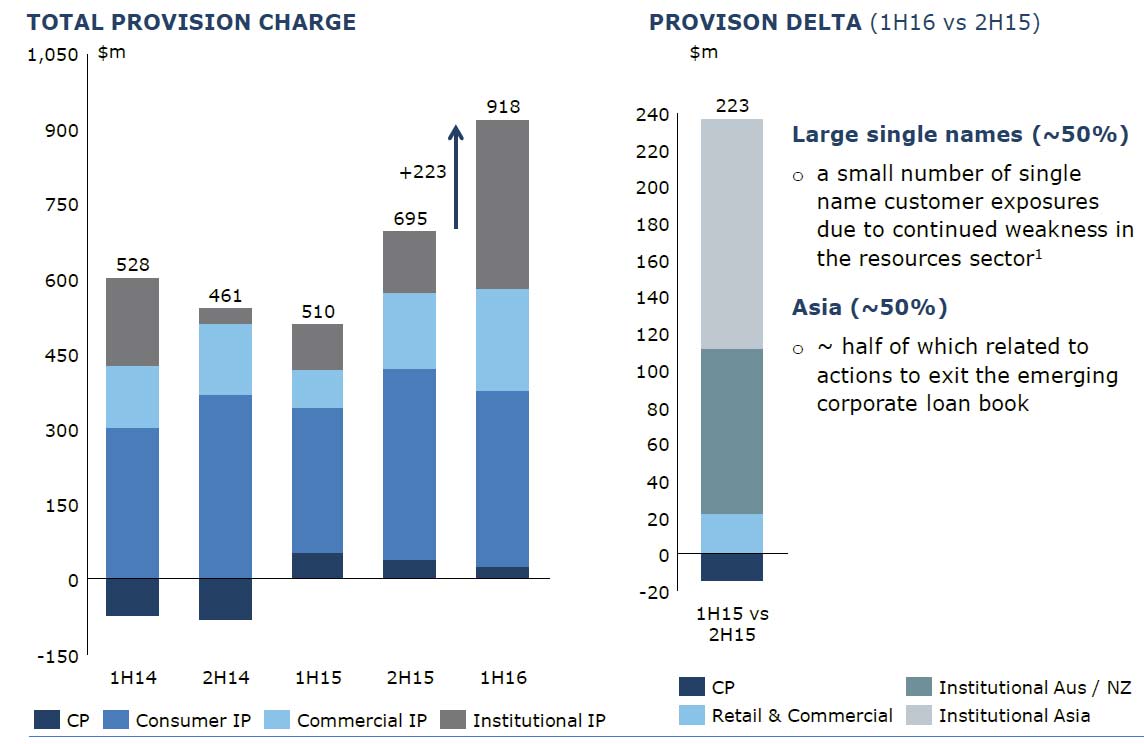 Consumer loan impairment rose, whilst institutional and commercial were lower.
 On a cash basis, the return on equity fell from 13.3% (2H15) to 9.7% in 1H16. On an adjusted basis, it fell from 13.2% to 12.2%.
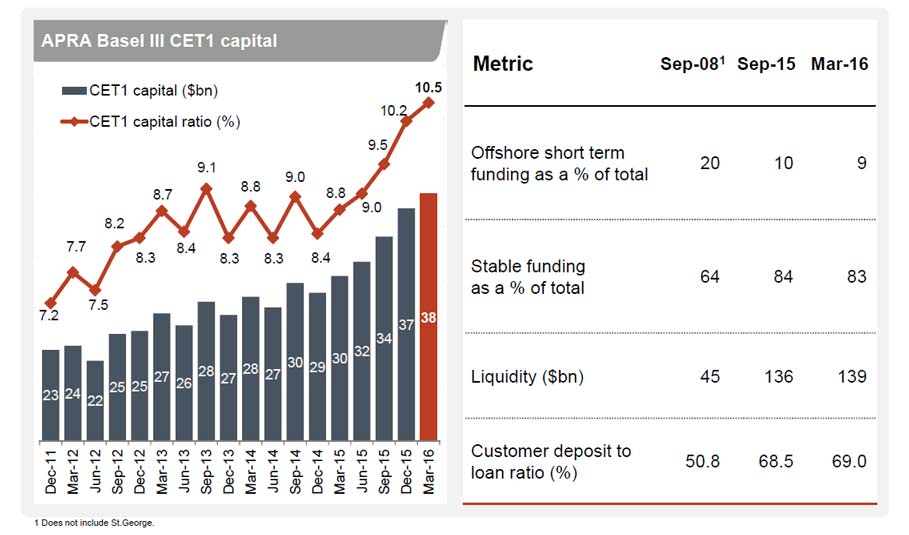
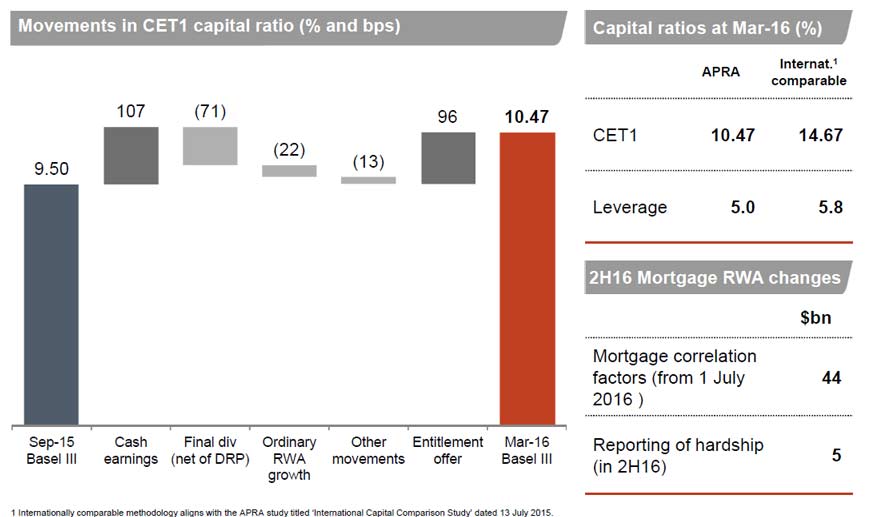
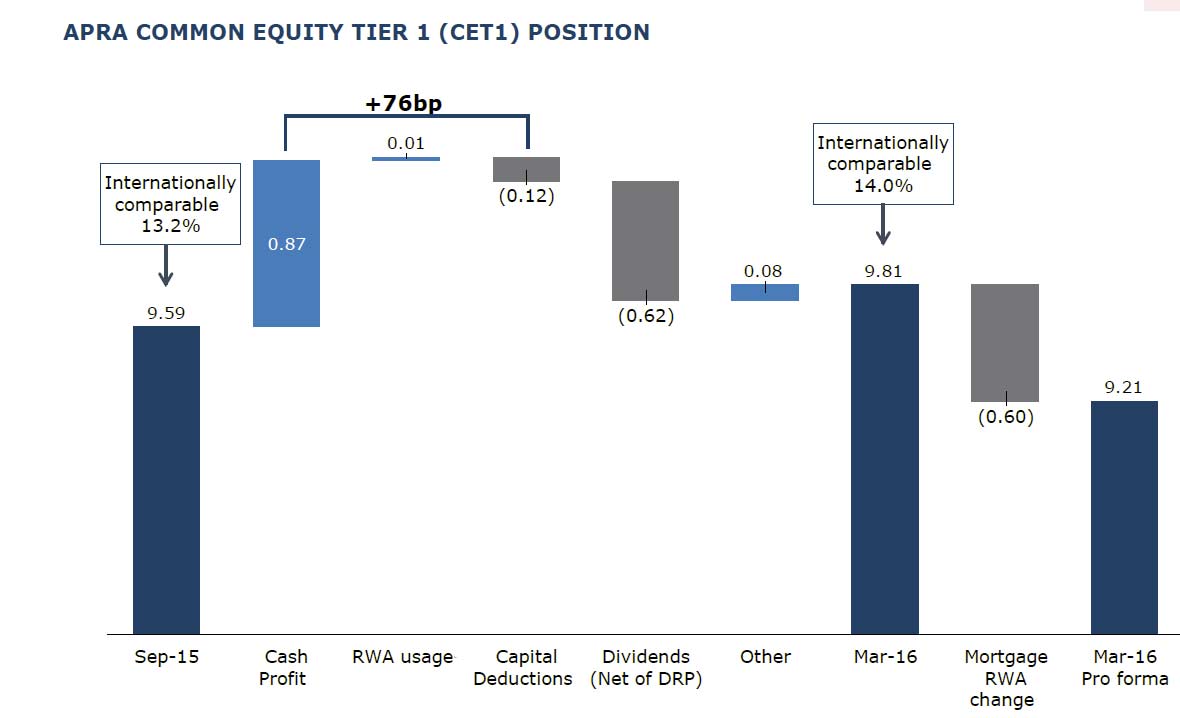
Common equity tier 1 ratio is up, the international comparable Basel 3 ratio is 14.0% (up from 13.2% 2H15). Using the stricter APRA calculation, the ratio went from 9.59% to 9.81%. Significantly though when the IRB capital floor moves to 25%, from 1 July 2016, the ratio will fall to 9.21%.
 The Interim Dividend of 80 cents per share fully franked is down 7% reflecting a move to gradually consolidate ANZ’s dividend payout ratio within its historic range of 60-65% of annual cash profit. The dividend payout ratio during the half of 84% primarily reflects the impact of specified items. On an adjusted pro-forma basis the ratio is 67%.
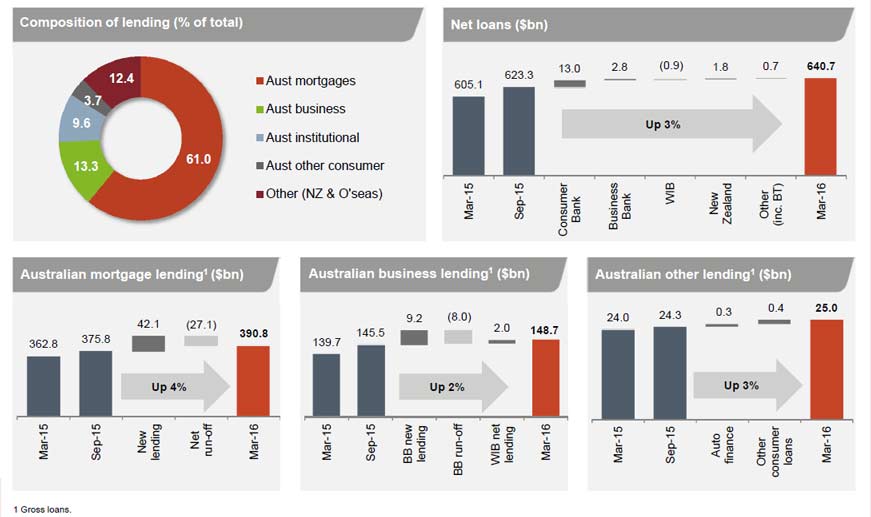
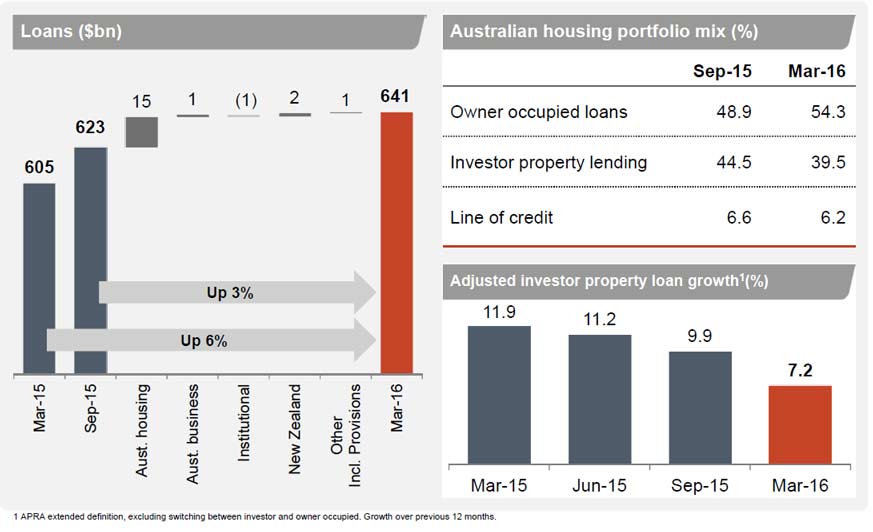
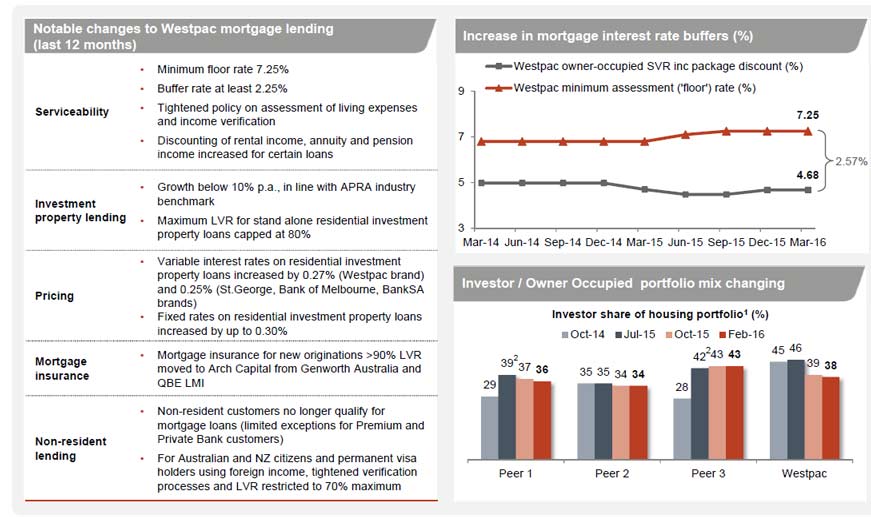
Looking in more detail at the Australian operations, with a focus on the mortgage book, home loan flows have been strong, with an 11% uplift from 1H15. ANZ has improved its share. 68% of flow were owner occupied loans (up from 57% IH15), and 53% of flow came via the broker channel. The total portfolio comprises of 48% via brokers, up slightly from 1H15. There has been a focus on growing share specifically in NSW.
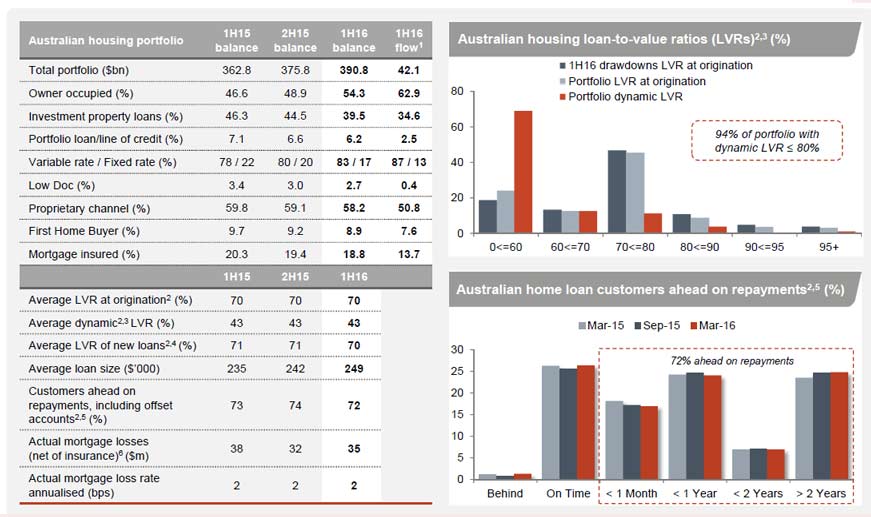
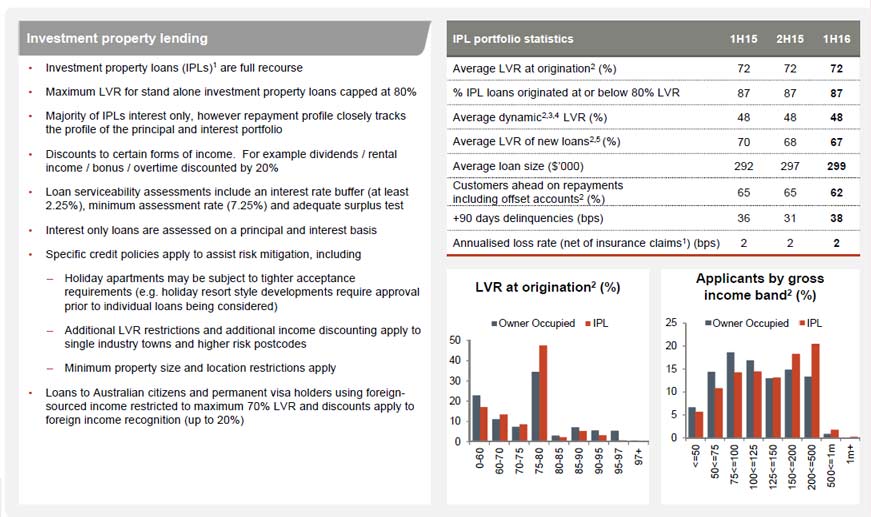
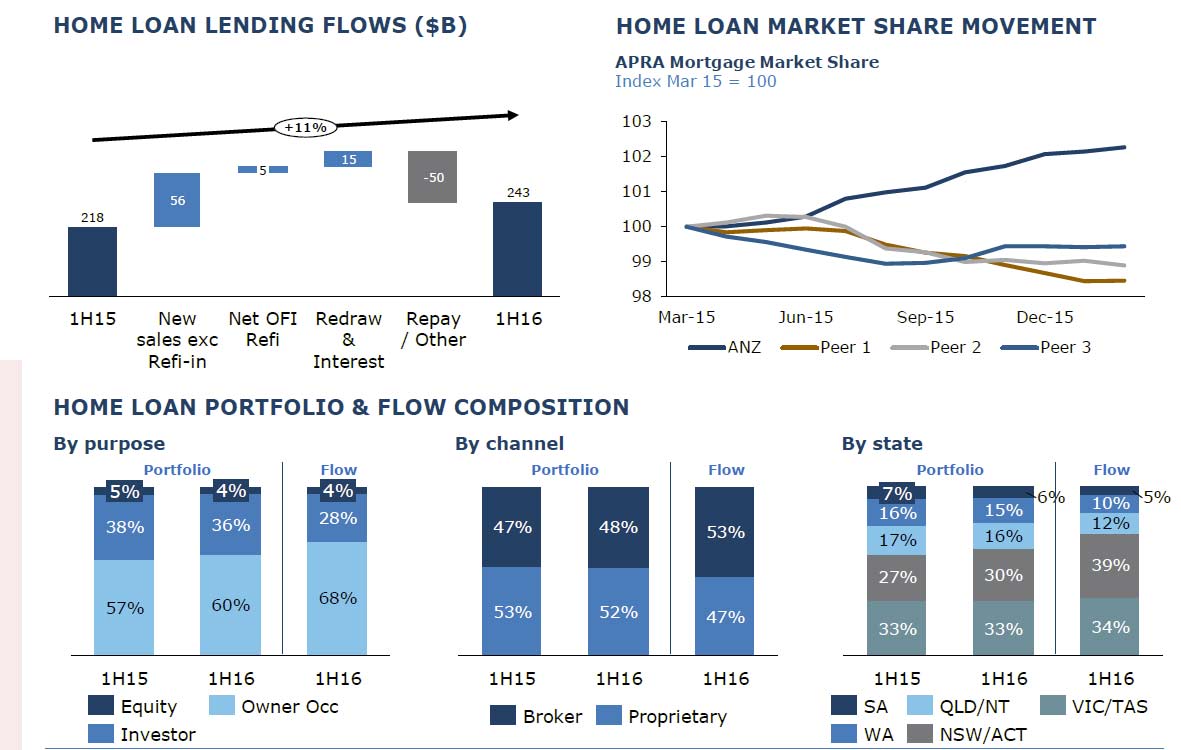 Mortgage growth means that 43% of total group lending in home loan related, up from 39% in 1H15. LVR at origination, at 71% has not changed. Investment loans in the portfolio fell from 40% to 37% , whilst offset balances, and interest only loans rose. There was a reduction in households paying ahead, from 43% to 40%. The absolute home loan loss rate remains low.
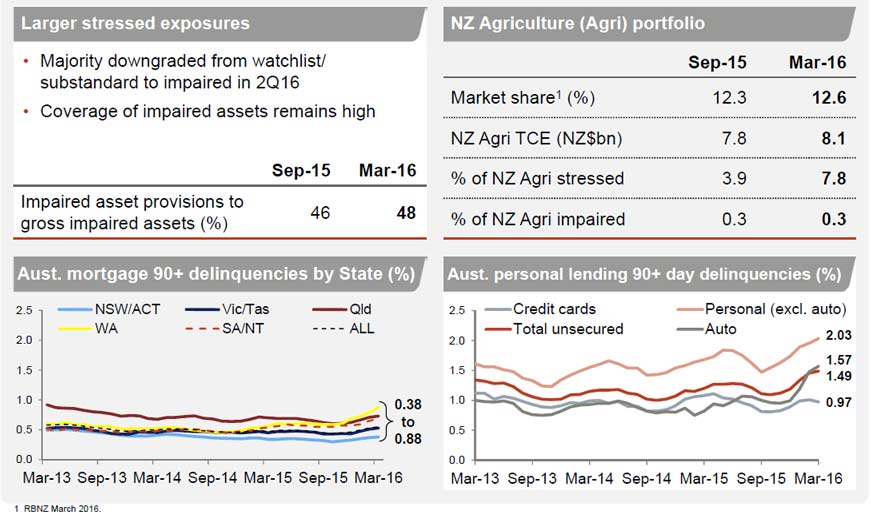
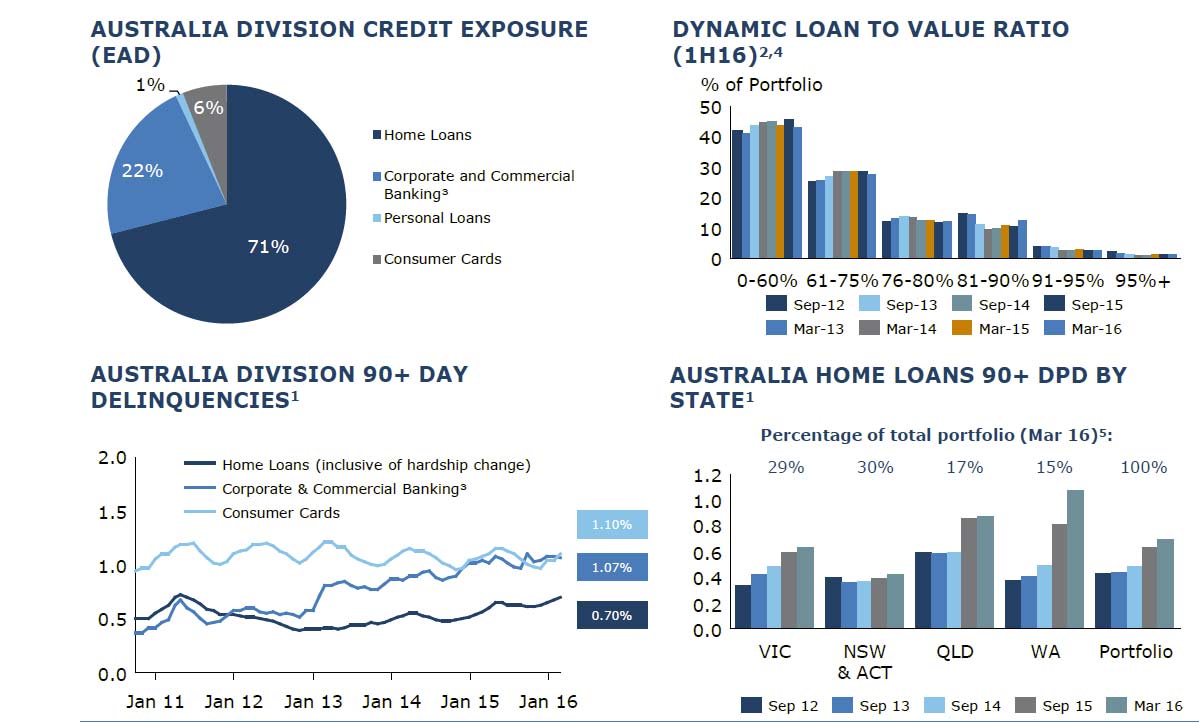
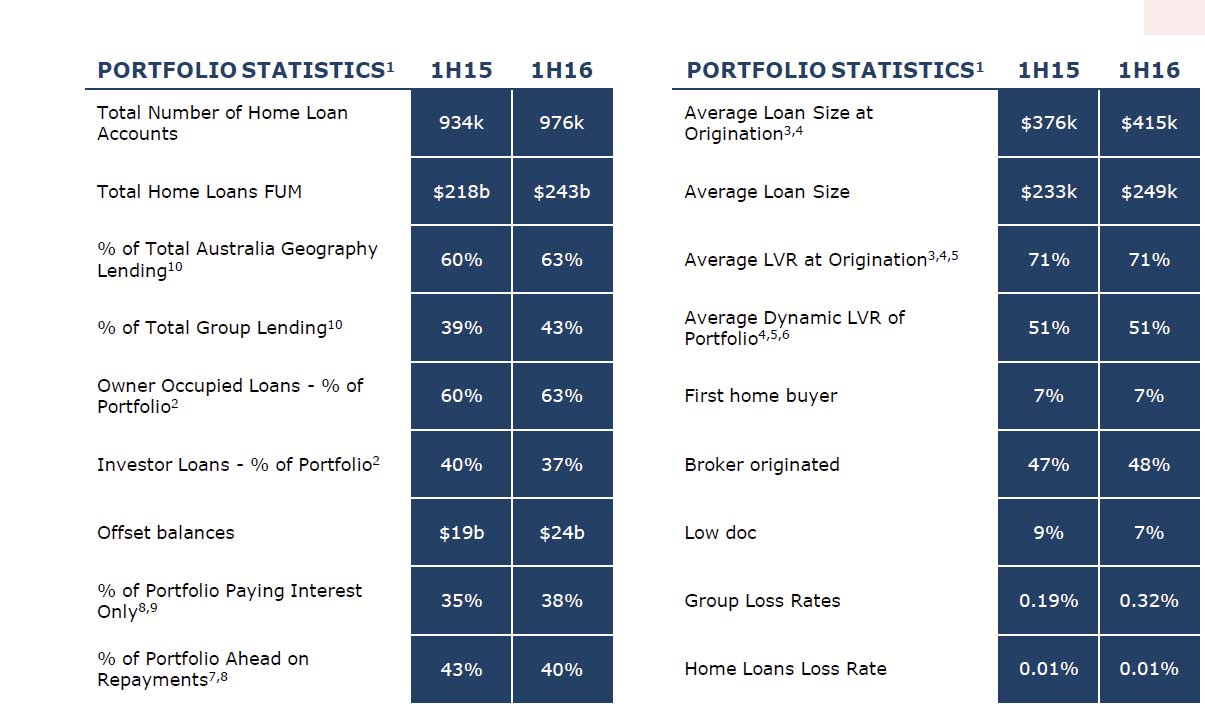 However, looking at credit risk in the book, 71% is home loan related. There is a fall in high LVR lending (in response to regulatory intervention). 90 day delinquencies for home loans in Australia is rising a little, but is low at 0.70%. Losses are higher in the corporate sector. We also see a rise in delinquencies in WA and QLD, as the mining down turn bites harder.
 So, in summary, and looking beyond the noise of the restructure, underlying revenue and profit is in line with expectations, and the losses had been flagged previously. However, we see the same stresses in the Australian mortgage book – where more eggs are being placed. Any fall off of growth in mortgage lending, or rise in delinquencies will have a significant impact down the track. That said, the “stick to you knitting” strategy, with less focus on the more complex and risky Asian dimensions makes sense.