UBS: mortgage brokers a $2.4bn waste of money

From Mortgage Professional Australia.

Broker commissions are “an illustration of excesses built into the financial system” according to a damning report on brokers by UBS.

Yesterday the global investment bank sent out an analyst note entitled ‘Are Mortgage Brokers Overpaid?’ which argued that broker commissions, which they state exceeded $2.4bn in 2015, should be cut.

UBS analysts Jonathan Mott and Rachel Bentvelzen wrote that “Average commissions are now $4,600 per mortgage, which we believe is disproportionate for advice provided on a simple, commoditised, single product, particularly when compared to the fees charged by Financial Advisors for ‘simple’ financial advice ($200 to $700).”

Broker commissions add 16bp per annum to the interest rate of every single mortgage customer, whether broker originated or not, the analysts claim. They note that commissions accounted for 23% of the costs in the major banks’ personal/consumer divisions in 2015. They do however note mortgage broker costs are not commonly disclosed by the banks.

The report warns that “we expect the banks to negotiate materially lower fee-for-service mortgage commissions in coming months”. They suggest that the advice for mortgages could be provided by robo-advice and the savings could be passed onto brokers “which could help offset anticipated repricing for the Bank Levy.”

Fiery response from the industry

“This report is garbage” responded FBAA executive director Peter White when asked for comment. White questioned the $4,600 figure used by UBS, saying the average commission was more like $2,500-$3,500 a deal. Whilst noting that banks did have the power to renegotiate commissions, White argued ASIC’s recent Review of Mortgage Broker Remuneration identified no reason for such a change.

Brokers should not be concerned by the report, according to White, who said that any changes to commissions would be at most ‘tweaking’.

MFAA CEO Mike Felton claimed UBS’ calculations had a fatal flaw: “Unfortunately, this report’s key finding is wrong. UBS has taken the 2015 upfront commissions plus the 2015 trail commissions (which includes commissions on all loans written by brokers in past years), and divided them by only the number of mortgages written in 2015. This has given them a commission per mortgage that is about double what it actually is in the year of acquisition.”

“We are extremely disappointed that a reputable organisation would issue a report like this without ensuring that the data they’re working with is correct.”

Felton also warned that UBS had misinterpreted the findings of ASIC’s review, which UBS took to show risks posed by brokers but the MFAA saw as showing no evidence of systematic harm caused by brokers.

Banks voting with their feet

Commissions are already under review by the banks, following the publication of the Sedgwick Review. Consequently, all major and several non-major banks have now committed to decoupling commissions from loan size by 2020. Sedgwick did not, however, recommend necessarily reducing commissions.

UBS’ report comes on the same day that HSBC revealed it is re-entering the broker channel in partnership with Aussie Home Loans, a move Aussie CEO James Symond claimed was “a vote of confidence in mortgage broking, considering the ASIC report, Sedgwick Report, bank levies.”

Symond added that “HSBC is such a prestigious, prominent, global player and for them to be jumping into the mortgage broking marketplace is not to be underestimated in terms of the confidence they have in the industry.”

UBS’ numbers

  • Total broker commissions in 2015: $2.4bn
  • 18% increase in broker commissions since FY2012
  • $4,623 – average commission per mortgage
  • 22.6% of banks’ personal consumer costs down to commissions
  • 16bp total cost of mortgage broker commission for every mortgage

Two pictures of rental housing stress and vulnerability zero in on areas of need

From The Conversation.

Two new tools for measuring and visualising problems in our rental housing system are in the media this week. They have similar names – the Rental Affordability Index (RAI) and the Rental Vulnerability Index (RVI) – but use different methods to offer distinct but complementary perspectives. Together they reveal that almost nowhere in our capital cities can low-income households – and those on average incomes in Sydney – afford the median rent. Mapping rental vulnerability reveals households in regional areas are struggling too.

The RAI is a project of National Shelter, the peak housing NGO, and SGS Economics and Planning. It gives us a bird’s-eye view of rental housing costs over most of Australia. It does this by showing how affordable the median rent (the midpoint of all rents) is – or isn’t – relative to incomes in each postcode.

An alternative approach considers where and in what proportion renters are actually in stress. We might also consider a range of other factors that indicate where and in what proportion renters are vulnerable to problems in accessing and keeping decent, secure housing. This is the approach we’ve taken with the RVI.

What does the RAI tell us?

Affordability is a relative concept – it is about costs relative to incomes. The RAI considers median rents higher than 30% of a household’s income to be unaffordable. The index shows other grades either side of this benchmark (very affordable, very unaffordable) too.

The Rental Affordability Index web tool zoomed in on Queensland. SGS Economics and Planning

This is consistent with a widely used benchmark in housing policy, often known as the “30/40 rule”: housing costs should not exceed 30% of income for households in the lowest 40% of incomes.

The rationale is that when low-income households have to spend more than that on housing, they start to go without other things – meals, health care, outings – that they reasonably ought to have. For this reason, low-income households in unaffordable housing are said to be in “housing stress” or “rental stress”.

The RAI looks at median rents, not the rents individual households are paying. This means it doesn’t tell us where or how many households are actually in rental stress. But it does indicate where renters face different degrees of pressure, in terms of either rents or constraints on the size, quality or location of dwellings.

So, looking at the affordability of median rents for a number of typical low-income households – single and couple pensioners, single people on benefits, single-parent part-time workers – the RAI shows that almost nowhere in Australia’s capital cities is the median rent affordable for them.

The RAI also applies the 30% benchmark higher up the income scale. Even for average-income renters, all Sydney postcodes – except for Mt Druitt and in the Blue Mountains – have median rents that are unaffordable or worse.

Of the capitals, Sydney’s affordability problems are deepest and spread furthest, but much of Melbourne and Brisbane is unaffordable to average renters too. Outside the capitals, most of the regions are affordable.

The quick takeaway from this perspective would be support for policies to increase the supply of affordable rental housing, particularly in our capital cities. These measures would include:

  • building more social housing
  • changing planning rules to allow more residential development
  • using inclusionary zoning to ensure a proportion of new development is kept as affordable rental
  • making greater use of land tax, including on owner-occupied housing, to ensure land owners don’t speculatively sit on development opportunities.

What does the RVI tell us?

For a different perspective, the City Futures Research Centre produced the Rental Vulnerability Index (RVI) for Tenants Queensland. This shows (only for Queensland, at this stage) a range of “housing system” and “personal” factors that we know, based on a wider body of research on housing and legal needs, indicate vulnerability to housing problems.

The housing system indicators include: rental stress, availability of rental housing that is affordable on local incomes, social housing and marginal tenures such as boarding houses, as well as personal indicators including unemployment, low education, disability, single-parent households and both young and elderly renters.

As well as mapping each of these indicators, the RVI uses principal component analysis. This enables us to look across the indicators to see where they cluster together as a generalised “rental vulnerability”.

The Rental Vulnerability Index web tool. City Futures Research Centre

Mapping this out we see that rental vulnerability in Queensland is highest in the regions. In particular, it is high around Bundaberg, Fraser Coast and Gympie, with a band of vulnerability skirting the regions west and south of Brisbane. Cairns also has several highly vulnerable postcodes.

These places have high rates of unemployment, disability, low education and older people in rental housing. They also have high incidence of rental stress – even though median rents are low compared to Brisbane.

By contrast, Brisbane generally scores quite low on rental vulnerability. This isn’t because there aren’t any vulnerable households there – there are. But their presence is masked by renter households who are doing well in terms of income, employment, education and other indicators.

There is a substantial body of research on the “suburbanisation of disadvantage”. This is the phenomenon of high housing costs pushing out, and shutting out, low-income and otherwise disadvantaged households from city centres. The RVI indicates that this process, at least in Queensland, is extending into a “regionalisation of disadvantage”.

So what can we do about this?

The takeaway from this? Housing problems are multidimensional and extend beyond the capital cities.

Regional areas have a pressing need for services – such as tenants advice services – that give vulnerable households material assistance in dealing with housing problems.

But more than that, we need to build up the economic and social capital of these places – so that they offer greater opportunities for the vulnerable households who are concentrated there – just as we need policies to increase affordable housing opportunities in our cities.

Authors: Chris Martin, Research Fellow, City Housing, UNSW; Laurence Troy, Research Fellow – City Futures Research Centre, UNSW

Data confirms houses near jobs are too expensive

From The Conversation.

Australia’s capital cities are getting more and more units, that are largely concentrated and come with a hefty price tag, a new report shows. And while these areas also have lots of jobs, the high price for houses means many on low incomes won’t be able to access that employment.

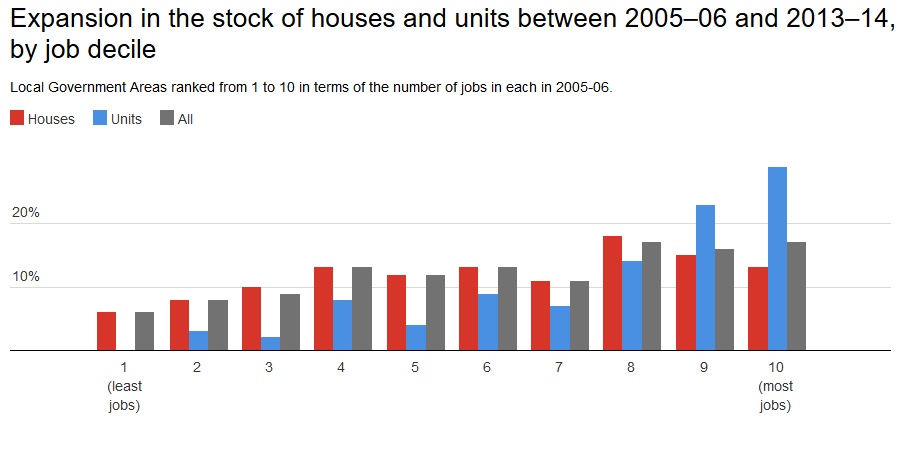
Between 2006 and 2014, more than 50% of new units were built in the 20% of local government areas with the highest number of jobs.

When compared internationally, it would seem that Australian housing supply has not been as weak as is widely believed. However, the report points to some stark differences in housing supply patterns, emerging across Australia’s capital cities.

In Sydney, Perth and Brisbane, new housing supply has lagged slightly behind population growth. In the other capital cities, housing supply actually outpaced population growth between 2006 and 2014.

Housing supply and house prices

The issue of housing affordability has traditionally been pitched in terms of supply failing to keep pace with growing demand, and house prices rising in response to the imbalance.

Yet, house price inflation has surged even in metropolitan areas where housing supply exceeds population growth. The evidence suggests a complex relationship between supply, population growth and price that is shaped by both supply and demand-side factors.

As prices and rents rise, housing costs continue to eat up larger shares of household incomes, particularly in moderate and low-income groups.

The study shows 80% of new unit approvals were located in the top 20% of local government areas with the highest unit prices. This is while 80% of new house approvals were in the top 40% of local government areas with the highest house prices.

There is very little new supply in areas where house prices are lower, where households on low to moderate incomes can afford to live.

Affordable housing, cities and productivity

The lack of affordable housing in the vicinity of employment centres can pose threats to the productivity of our cities. If suburban residents are forced into longer commutes to access employment in the CBD, it can reduce productivity.

A potential consequence is that low-paid workers are deterred from seeking jobs in CBDs. This would then cause certain skills to become unavailable, and businesses to be less efficient, because they cannot quickly fill vacancies with suitable applicants.

Our data shows new units have grown by 30% in areas which have the most jobs, between 2005-06 and 2013-14. In contrast to this new units have only grown by 2.5% in areas with less jobs.

It would appear that unit approvals are concentrated in areas with abundant job opportunities. So productivity could improve, as congestion eases, and commute times lowered, if (and it’s a big if) these dwellings were affordable to those wishing to take advantage of these job opportunities.

New housing supply has grown at a pace that matches population growth rates, at the national level. However, there is plenty of variation across the capital cities.

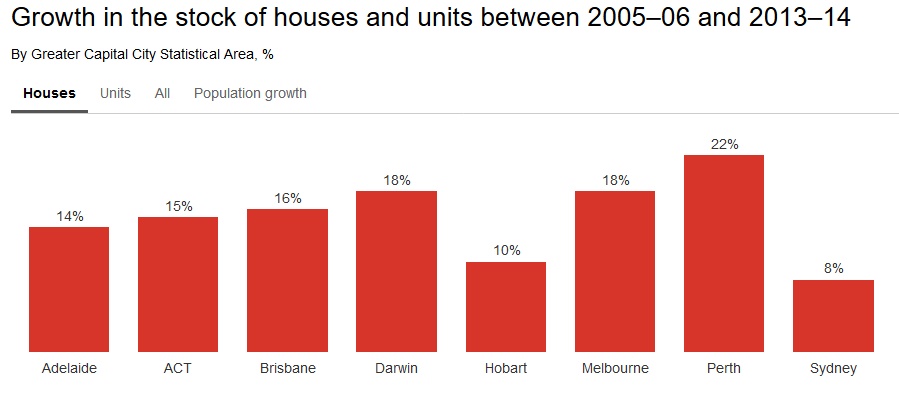
The strongest growth in the number of units has been in the territories (though this is from a low base), followed by Melbourne and Brisbane. However, the strongest growth in the number of houses has been in Perth, at around 22%.

Sydney has experienced much lower growth in its number of houses, at less than 10%. This reflects the very different patterns of development in the two cities.

In Perth, Brisbane and Sydney, increases in the supply of housing didn’t keep pace with population growth during, between 2006 and 2014. However, the drivers of this shortfall are varied.

Perth’s population grew very strongly over the period that we studied. The roughly one-quarter increase in population would stretch the capacity of most housing construction sectors.

However, even though Sydney’s population growth (at 14%) is below the average across all capital cities, its housing supply failed to match this growth. These outcomes highlight the different demand and supply side factors operating across states.

We currently have a national housing policy narrative that is dominated by a consensus view that higher levels of housing supply are the solution to housing affordability problems. While increased supply will always help take steam out of pressured markets, our study suggests a more nuanced approach is needed to the supply side, while not ignoring the demand side pressures.

It’s important that we identify those barriers to expanding affordable housing supply that have been impeded in the majority of our cities, especially for low income households.

Authors: Rachel Ong, Deputy Director, Bankwest Curtin Economics Centre, Curtin University; Christopher Phelps, Research assistant, Curtin University; Gavin Wood, Professor of Housing, RMIT University; Steven Rowley, Director, Australian Housing and Urban Research Institute, Curtin Research Centre, Curtin University

Bowen pledges to block ScoMo’s main housing measure

From The New Daily.

Shadow Treasurer Chris Bowen has slammed as “highly objectionable” the Turnbull government’s budget measure to allow young Australians to save for a deposit inside their super funds.

In his budget reply speech on Wednesday, Mr Bowen said most of the measures in the government’s “sham” affordability package were “ineffective”, but he took issue with what has been dubbed the ‘First Home Super Saver Scheme‘.

He confirmed Labor would vote against the “badly designed and ill thought out” proposal if and when it comes before Parliament.

Mr Bowen’s primary concern seemed to be that extra contributions from mortgage savers would be lumped together with compulsory contributions from employers.

“How voluntary contributions will be kept separate from compulsory contributions in the event of a downturn, where balances can contract, is beyond me. They can’t be.”

The budget papers say the scheme will allow first home buyers to salary sacrifice up to $15,000 a year, up to a maximum balance of $30,000, with a tax on contributions and earnings of only 15 per cent. When withdrawing the money to pay for a deposit, the lump sum will be counted as personal taxable income, but the tax rate on the money will be discounted by 30 percentage points.

The government has promised that whatever money a would-be home buyer salary sacrifices into super would be quarantined from losses. The Shadow Treasurer seemed to doubt this is even possible, let alone prudent.

Industry Super Australia has warned the scheme will hurt returns by requiring funds to “maintain more liquid asset allocations to deal with unpredictable withdrawals”. This means funds may have to invest more in cash and short-maturity securities, which carry lower returns.

Mr Bowen also said the scheme would breach the very same ‘sole purpose’ test the government is trying to legislate, which would clarify that super savings are intended to provide income in retirement to substitute or supplement the age pension.

“The
whole idea of an objective is to have a benchmark against which changes to superannuation can be judged. Yet the government’s first proposed legislative change since announcing their preferred objective would undermine the goal of providing income in retirement.”

The Shadow Treasurer also disputed that super saver accounts would do anything to boost affordability.

“We know the government dabbled with all sorts of harebrained ideas to allow access to superannuation. The eventual model they settled on, allowing voluntary contributions to be withdrawn by first home buyers, will not make a difference for the vast majority of first home buyers,” he said.

“Without negative gearing and supply side reform, if it has any impact at all, it will simply drive up house prices. It is badly designed and ill thought out.”

Mr Bowen also ridiculed the government’s optimistic predictions for almost doubled wage growth by 2020-21, after the Australian Bureau of Statistics revealed that wages have continued to stagnate.

Lending Finance In March Still About Housing

The ABS released their lending finance statistics for March 2017.  We see the problem again of not enough productive commercial lending, as banks chase property lenders. Revolving commercial credit did rise.

Overall trend finance flow in trend terms rose 1.3% to $70 billion, up $691 million. Within that, the total value of owner occupied housing commitments excluding alterations and additions rose 0.1% in trend terms, to $20.1 billion, up $26 million; and the seasonally adjusted series rose 0.9%.

The trend series for the value of total commercial finance commitments fell 0.3% to $42.3 billion, down $142 million. Fixed lending commitments fell 1.4% down $461 million to $33.5 billion, while revolving credit commitments rose 3.8%, up $319 million to $8.8 billion.

The seasonally adjusted series for the value of total commercial finance commitments rose 13.0%. Revolving credit commitments rose 36.8% and fixed lending commitments rose 7.1%.

Within the fixed commercial lending category, lending for investment housing fell 0.3%, down $44 million to $13.2 billion, whilst lending for other commercial purposes fell 2%, down $416 million to $20.3 billion. 39% of fixed commercial lending was for investment housing and this continues to climb.  Most of the investment in housing was in Sydney and Melbourne.

Once again the rise unproductive investment housing lending does not support true growth, and continues to create more pressure on home prices.

The trend series for the value of total personal finance commitments fell 1.3%. Fixed lending commitments fell 1.7% and revolving credit commitments fell 0.7%.

The seasonally adjusted series for the value of total personal finance commitments fell 1.7%. Fixed lending commitments fell 3.2%, while revolving credit commitments rose 0.8%.

The trend series for the value of total lease finance commitments rose 1.3% in March 2017 and the seasonally adjusted series fell 13.0%, following a fall of 32.1% in February 2017.

Net Wages Fell To March 2017

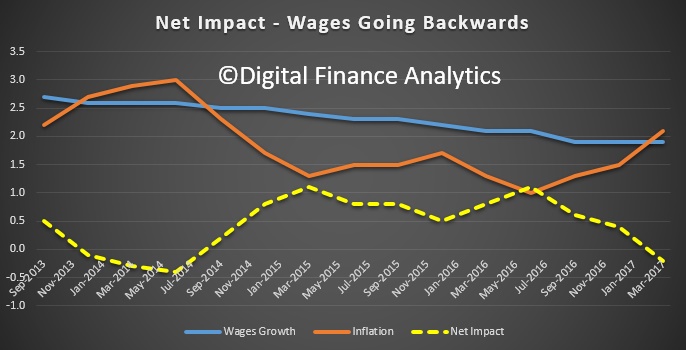
The pincer movement of higher inflation and lower wage growth now means that average wages are falling in real terms, especially for employees in the private sector where wage growth is anemic.  Not good for those with mortgages as rates rise flow though.

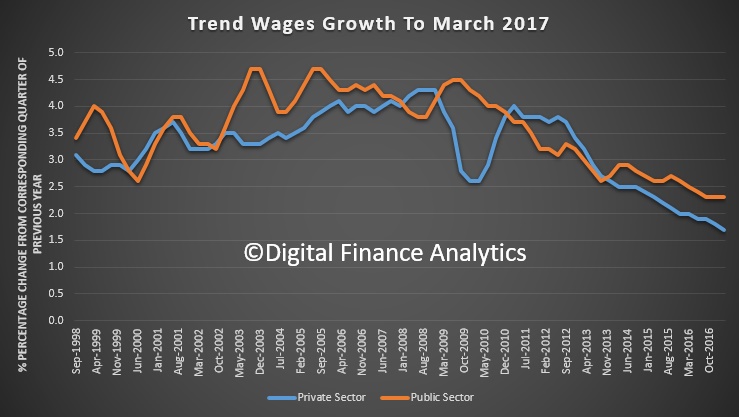
The ABS says the seasonally adjusted Wage Price Index (WPI) rose 0.5 per cent in March quarter 2017 and 1.9 per cent over the year, according to figures released today by the Australian Bureau of Statistics (ABS).

The WPI, seasonally adjusted, has recorded quarterly wages growth in the range of 0.4 to 0.6 per cent for the last 12 quarters (from June quarter 2014).

Seasonally adjusted, private sector wages rose 1.8 per cent and public sector wages grew 2.4 per cent through the year to March quarter 2017.

In original terms, through the year wage growth to the March quarter 2017 ranged from 0.6 per cent for the mining industry to 2.3 per cent for public administration and safety, education and training, and health care and social assistance industries.

Western Australia recorded the lowest through the year wage growth of 1.2 per cent and Tasmania the highest of 2.3 per cent.

HSBC to offer loans through Aussie

From Australian broker.

HSBC has announced a return to the Australian mortgage broking space after a 10-year absence, partnering with Aussie Home Loans.

Alice Del Vecchio, Head of Mortgages and Third Party Distribution, HSBC Australia said,“We’re excited to partner with Aussie. Aussie has a strong network of brokers and is a well regarded member of the broking industry.

“Our mortgage book has grown significantly over the past few years and now we’re ready to stretch it beyond the geography of our branch network with mortgage brokers. HSBC has a range of competitive products that we believe will be well-received by customers and brokers,” she added.

Chief Executive of Aussie, Mr James Symond said “Our link with the HSBC brand in Australia brings together two leading brands focused on delivering greater competition to the home loan market, backed by premium customer service.

“Our HSBC partnership will now provide Aussie’s customers with a greater choice of mortgage products, while giving our brokers access to consumers attracted to the strong HSBC offering, the majority of whom are high-net worth”, he added.”

Benefit payments rise dramatically ahead of July 1 super changes

AMP says SMSF trustees looking to take advantage of the current rules around non-concessional caps have significantly increased benefit payments, according to the latest SuperConcepts SMSF Investment  Patterns Survey.

In the March 2017 quarter the average benefit payment increased significantly from $16,256 to $27,900.

Overall contribution levels also continued to rise in Q1, increasing from $8,548 to $9,138.  This continues the trend established in Q4 of last year which saw contributions increase by 181  per cent following the Government’s confirmation that the proposed Super changes will come into effect on July  1, 2017. The rise, however, is a reversal of the historical trend where Q1 has always been the lowest quarter each year.

SuperConcepts Executive  Manager Technical & Strategic Solutions Phil La  Greca said the findings clearly demonstrated that SMSF  trustees were looking to maximise current non-concessional contribution rules.

The current $180,000 after-tax contributions cap, and the three-year  $540,000 bring-forward rule remain until 30  June 2017.

Commenting  on the new trend to emerge around benefit payments,  which almost doubled  mainly through the  increase in lump sum withdrawals,  Mr  La Greca said:

“Trustees are implementing withdraw and re-contribution strategies to take advantage of the window of opportunity before July 1. Strategies include making non-concessional contributions  into an accumulation account, starting  a new 100 per cent  tax free pension and making contributions to a  spouse to try  and  equalise member balances and  maximise access to the $1.6 million pension transfer  balance cap for both persons.”

During prior quarters the split of lump sum withdrawals versus pension payments tended to be around 20 per cent versus 80 per cent. In the first quarter of 2017 the split shifted to 40 per cent versus 60 per cent.

Asset allocations largely remained unchanged as SMSF trustees and their advisers focus on dealing with the opportunities around the upcoming changes.

The quarterly SuperConcepts SMSF Investment Patterns  Survey covers approximately 2,750 funds, a sample of SMSFs administered by Multiport (part of the SuperConcepts group)  and the investments they held at 31 March 2016.  The assets of the funds surveyed represent approximately  $3.2 billion.


APRA’s non-bank oversight may curb mortgage risks

From Australian Broker.

Broader powers by the Australian Prudential Regulation Authority (APRA) to oversee the non-bank sector will have a positive effect on the residential mortgage market, said analysts from global ratings agency Moody’s.

The measures, announced in last week’s Federal Budget, could see APRA regulating lending by non-bank financial institutions.

This policy, if passed by the Australian government, would help curb riskier mortgage lending in the non-bank sector and thereby reduce any risks found in Australian residential mortgage back securities (RMBS).

“Non-bank lenders have significantly increased their origination of riskier housing investments and interest only mortgages over the past two years, a period over which APRA has introduced measures aimed at limiting growth of such loans by banks and other authorised deposit-taking institutions (ADIs),” analysts wrote in an article for Moody’s Credit Outlook.

“APRA currently regulates banks and other ADIs, but does not regulate lending by non-bank financial institutions. Instead, regulatory oversight of the non-bank sector is presently the responsibility of the Australian Securities and Investments Commission, which enforces responsible lending but does not have the power to implement macro-prudential policy measures.”

By extending APRA’s powers into the non-bank sector, the regulator would be able to set specific limits and ensure loan quality remains comparable to that of banks and other ADIs, Moody’s said. These broader powers would fall on top of the regulator’s March 2017 policy to monitor warehouse facilities that banks use to fund non-bank lenders.

In 2016, housing investment loans issued by non-bank lenders make up for 36% of all mortgages found in Australian RMBS, a large increase from the 16% found in 2015.

In a similar manner, interest-only loans accounted for 46% of all mortgages banking RMBS by the non-banks in 2016, compared to 21% in 2015.

Non-bank lenders write 6% of the total housing loans in Australia.

The bank levy’s critics are selling Australia short

From The New Daily.

The ‘bank levy’ that is causing such a political storm in Canberra may not be great policy in itself, but it will still be overwhelmingly good for Australia.

To understand why, it’s first necessary to ignore the silver-tongued protests of former Queensland premier Anna Bligh, now head of the Australian Bankers’ Association, and former Treasury secretary Ken Henry, now chairman of National Australia Bank.

They are using years of expertise developed on the public payroll to defend bank shareholders.

And don’t give much credence to CBA boss Ian Narev’s simplistic claim that “basically all Australians” are bank shareholders.

More than a fifth of the big four banks’ shareholders are foreign investors, and many middle- and lower-income Australians have superannuation holdings too puny to make them significant shareholders of anything.

A $100,000 super account, for instance, would likely have about $6000 in bank shares. The dividend earnings on those shares before tax would be about $300. And those earnings would, according to Treasury estimates, be reduced by 4 or 5 per cent – well under $20 a year.

Bloated banks

In Australia, banks have grown to a ridiculous size and make profits many times those of our biggest employers, Wesfarmers and Woolworths.

But it is not ‘market forces’ that have made them that way. They have grown much more than other sectors of the economy thanks to two levels of support from the federal government.

The first is the implicit guarantee provided by the government for the banks’ liabilities.

That guarantee swung into action during the GFC and became explicit, but it is always there – and the banks, and the institutions that lend to them, know it.

That means the big banks can borrow more cheaply. Even with the bank levy in place, they’ll still only be paying back a third of the benefit they receive from that guarantee.

Tax distortion

The second reason banks are so profitable is a simple matter of scale.

If property investors were not offered such generous tax concessions via negative gearing and the capital gains tax discount, they would not be able to borrow as much money to bid up property prices.

If they were unable to bid up prices, owner-occupiers would not have to borrow such large sums either – there would be fewer dollars chasing each available property.

And if those twin tax breaks were reduced, the banks’ mortgage books, and therefore profits, would be smaller.

Mr Henry himself argued to reform the housing tax breaks back in 2010 – but then he was employed by taxpayers, not a bank.

A political bind

The problem for Treasurer Scott Morrison is that the tax lurks that drive this bloated system disproportionately advantage voters in Liberal-held electorates, as a report released by the Australia Institute on Tuesday shows.

The think tank’s league table, showing the annual CGT refund averaged across all taxpayers in an electorate, is dominated by top Liberal seats.

Nationwide, the average claimed by taxpayers in Nationals seats is just $146, in Labor seats $297 and Liberal seats $672.

And therein lies the problem. The obvious and most effective way to reduce the credit bubble and bring banks back to the relative size and profitability seen in other developed countries is to reduce those concessions.

But as the Coalition can’t do that for political reasons, it is instead reclaiming some of the banks’ huge profits to shore up the federal budget.

It’s second-best policy, but it will at least help counteract the effect of not considering the first-best policy.

That said, the levy on the five biggest banks will collect $6.2 billion over four years – pretty small beer considering the government also plans to phase their corporate tax rate down from 30 per cent to 25 per cent over the next few years.

The question then will be whether people like Ms Bligh and Mr Henry complain with equal vehemence that banks again have it too easy.