The ‘jobs growth’ myth leading us to breaking point

From The New Daily.

When the ratings agency S&P Global downgraded its outlook for the Australian economy earlier this week, it would have caught many people by surprise.

That hasn’t been the story coming out of Canberra in recent months. Treasurer Scott Morrison put on a sterling display of optimism during budget week, telling us that not only were lots of jobs being created, but the tax revenue flowing from those jobs would help bring the budget back to surplus.

Sadly, S&P has the more accurate picture. As noted on Wednesday, it sees our economy as “very high risk” due to “strong growth in private sector debt and residential property prices in the past four years”.

But the housing bubble is only half the story. Times have changed from the years when a large mortgage would quickly get easier to service as inflation eroded the real value of the debt.

Now, other forces of erosion are at work. Number-crunching last week’s jobs data from the Bureau of Statistics shows that it’s not debts that are eroding, but the number of hours of work available in the economy.

When the Treasurer quotes the jobs data, he tends to focus on the ‘seasonally adjusted’ unemployment rate, which fell from 5.8 to 5.7 per cent in April – the more reliable ‘trend’ figure remains stuck at 5.8 per cent.

But it’s what is happening behind those figures that is worrying.

First, there’s the ongoing trend towards part-time work. In the past year, the 49,300 full-time jobs created were easily eclipsed by 102,800 part-time jobs.

The growth rate for part-time jobs is three times that for full-time jobs, and if that trend continues over the next year, many heavily indebted households will start to reach breaking point.

The debt problem

Australia now has a middle strata of homeowners, between renters and those who’ve paid off their mortgages, who are carrying historically high levels of debt.

Not only are their debts not being significantly eroded by inflation, but the purchase price of homes in most cities continues to climb, loading up new generations of home buyers with even bigger debts.

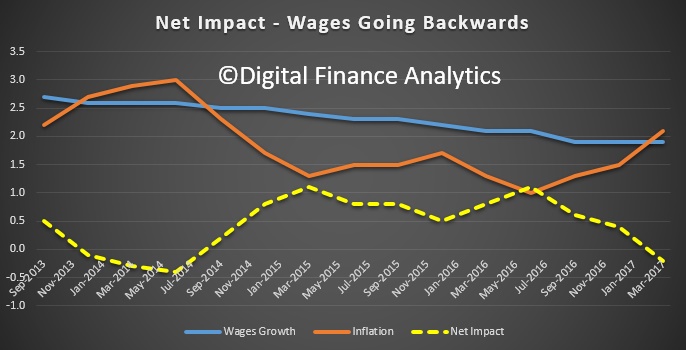
That’s what S&P is concerned about. Mortgage holders are also struggling with two other trends – below-inflation wages growth, and the fall in hours worked revealed by the ABS last week.

While for an individual, having a part-time job is a lot better than none at all, for many families the problem of having one or even two breadwinners wanting more hours is growing.

This is what you need

Australia’s population is growing at a rapid annual rate of 1.4 per cent.

The workforce doesn’t grow quite that quickly due to the ageing population profile, but it’s not far behind – 1.36 per cent in the past year according to the ABS.

If workers’ hours had remained constant on average, the total hours worked would have risen by 22.5 million in the past year to reflect the expanding workforce.

What we saw last week was a fall of two million hours in the month of April, and growth over the year at half the level it should be – 10.4 million hours.

Those figures say a lot more about how the economy is progressing than simple ‘jobs’ figures, but even the job figures fell behind.

There have been 152,100 jobs created in the past year (to April), but the workforce has grown by 172,400 people in the same period. That is, more people than jobs available.

Household debt, meanwhile, continues its march higher. The average household debt is 190 per cent of disposable income, according to the RBA.

It’s important to remember, too, that most of that debt is concentrated in the one-third of households which have a mortgage.

That’s the slice of middle Australia for whom celebrations over a ‘fall in unemployment’ will make no sense.

RBA figures show that one third of mortgage-holders has less than a one-month buffer in the household finances before they fall into arrears.

That’s a risk for them, but also for the economy.

S&P is only telling us what the economists in the Department of Treasury already know, but the politicians aren’t keen to say.

Bank-owned super funds earn less than term deposits

From The New Daily.

The bank-owned superannuation fund sector has performed so poorly that putting your money in term deposits over 10 years would have earned a better return than retail funds, according to new research from Industry Super Australia.

That is despite the funds including growth assets like shares, property and private equity in their asset portfolios.

Not-for-profit industry and other super funds outperformed retail funds by almost 2 percentage points a year, the study found.

Over 10 years, retail funds returned an average of 3.3 per cent a year, compared to industry super’s 5.1 per cent.

That outperformance makes a huge difference to your account. If you had $50,000 in a retail fund at the start of the period and you made no additional contributions, it would have grown by 38.3 per cent to a total of $69,170.

If you had the same balance in an industry fund, it would have grown by 64.4 per cent to $82,220. Double the starting balance and you’d have $164,440 in your industry fund compared with $138,340 in a retail fund.

The reason for the difference is the profit model, Industry Funds Australia CEO David Whiteley said.

“Consistent outperformance by industry super funds over bank-owned super funds reflects the differences between for-profit and not-for-profit business models, which over the last two decades have seen significantly different member outcomes.”

The ISA report also looked at the dollar value to fund members of the outperformance of industry funds and the underperformance of retail funds. The industry funds returned their members an extra $42.91 billion in outperformance above the median of all super funds over 10 years.

The retail funds, meanwhile, cost their members $25.42 billion by underperforming the industry median.

Interestingly, the industry funds returned more to their members through outperforming the median despite having a smaller asset base. The latest figures from APRA (Australian Prudential Regulation Authority) show that retail funds had $579.9 billion in assets while industry funds have $517.9 billion.

The outperformance of industry funds showed up in other ways. Three-quarters of bank-owned super fund assets were in funds listed in the lowest 25 per cent of return tables, and 94 per cent of them performed below the median.

For industry funds, the situation is reversed. Three-quarters of all industry funds were in the top performance quartile, and 91 per cent of them performed above the median.

The underperformance of retail funds happens regardless of size. Larger funds only reported higher returns in the not-for-profit sector, meaning the for-profit fee model undermined any advantage members might have got from economies of scale.

The five largest public-offer funds owned by the banks and AMP, each with more than $30 billion in assets, performed well below the median, the research found.

Matt Linden, public affairs director for Industry Super Australia, said “the performance of the system is being weighed down by bank funds”.

While bank funds underperformed, they have managed to hold their membership.

“Lots of people are disengaged with super and are not financially literate,” Mr Linden said.

“Maybe the bank-owned funds are exploiting this disengagement for their benefit.”

Industry Super Australia CEO David Whiteley said the for-profit model “sits very uneasily” with both the interests of members and the “social policy objectives” of compulsory super.

“It is now time for the banks to disclose the profit from compulsory super and for the regulator to investigate the chronic underperformance of bank owned super funds.”

* The New Daily is owned by a group of industry super funds

Hong Kong Tightens Mortgage Lending Standards

Another country takes steps to cool their housing market.

Moody’s reports that changes to lending standards by the Hong Kong Monetary Authority (HKMA) will reduce the risks in the Hong Kong housing market which has been buoyant in recent years.

Current elevated property prices pose latent risks to the banking system and make banks increasingly vulnerable to a property price decline. According to Hong Kong’s Rating and Valuation department, residential property prices in the territory have risen for 12 consecutive months since March 2016. Average residential prices rose 4.0% in March 2017 from the end of 2016 and were 4.5% above the previous peak in September 2015.

Hong Kong’s housing affordability is among the lowest in the world, with a price-to-income ratio of more than 20x. The household debt-to-GDP ratio is also at a historical high (see Exhibit 3), raising the specter of a substantial rise in household debt-servicing burden as interest rates rise.

One mitigating factor for these risks is that Hong Kong banks maintain very low loan-to-value (LTV) ratios. The average LTV ratio for new mortgage loans was 51% in March 2017. The new measures will help banks build up more buffers against potential property prices decline.

The measures are credit positive for Hong Kong banks and enhance their resilience in a potential property downturn. The new measures target non-first-time home buyers and borrowers whose income is mainly derived from outside of Hong Kong (see Exhibit 1). These measures will temper credit demands from property investors with high leverage and limit the growth of residential mortgages loans, which increased in March to record year-on-year growth of 5.3%, compared with 4.2% year-on-year growth in December 2016.

Hong Kong banks’ intense competition in the mortgage business has squeezed their interest margins. Pricing for most mortgages has come down to Hong Kong Interbank Offered Rate (HIBOR) plus 1.28% from HIBOR plus 1.7% 18 months ago. HKMA’s requirement to raise the risk weight for new residential mortgage loans to 25% from 15% should deter banks from competing for mortgage business through further price cuts.

Worth reflecting on the fact that Australia’s household debt to GDP ratio is 123, significantly higher than Hong Kong, once again highlighting the issues we have locally!


Investors are exploiting returns on debt financing to muscle out home buyers

From The Conversation.

Investors have played an increasingly important role in the Australian housing market in recent years. Our new research shows the actual return rate for housing investors almost doubled a layman’s expectation. Experienced investors are taking advantage of the knowledge gap and might continue to price out other housing buyers.

The sharp increase in investor credit in recent years could be partly attributed to the strong growth of housing prices, particularly in Sydney and Melbourne. However, the reported capital gains might not have fully reflected investors’ actual returns as the impact of debt financing in property investment has been neglected.

Since housing investors typically use large amounts of debt to fund their investment, using the return on equity (after adjusting for debt financing) more accurately reflects their actual return.

In recent years, regulators such as the Australian Prudential Regulation Authority and lenders have implemented measures to moderate the growth of investor lending. Despite these efforts, investors have come back into the housing market since the second half of 2016.

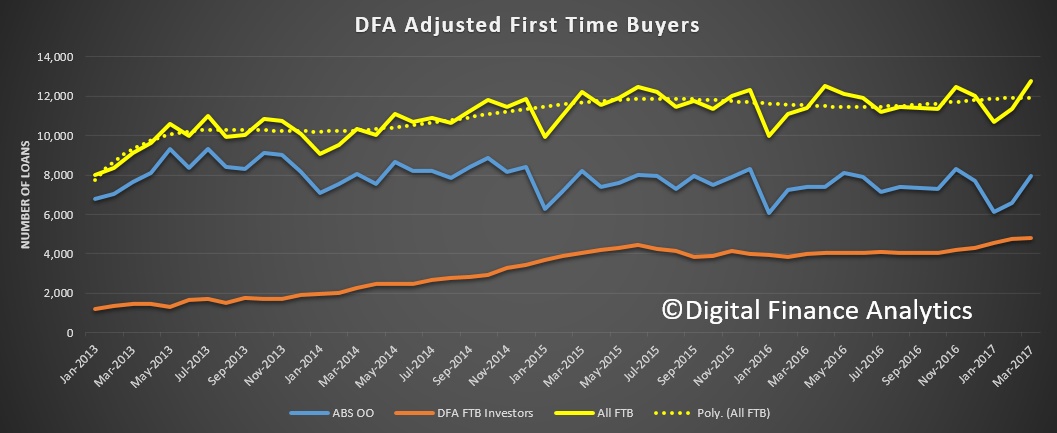
Proportion of housing investment loans

ABS, Housing Finance, Australia: February 2017

Higher returns come with greater risk

Our research sampled properties in 14 suburbs across Sydney, using the Property Investors Alliance database. The results provide some empirical evidence to demonstrate the housing return on equity with debt financing is significantly higher, at an annual return of nearly 14% per year, than the housing return on property without debt financing of about 7% per year.

This could explain the increasing proportion of investment loans in the housing market. The knowledge of investors’ advantage should also be used to inform the ongoing debate about regulating investment housing loans to enhance housing affordability for first home buyers in particular.

It is important to highlight the effect of debt financing on decisions to invest in housing. The results clearly show the enhanced returns are likely to have an acute impact.

At the same time, a higher risk level as a result of the use of debt financing has also been documented. This highlights that housing investors should closely manage their exposure to financial risk from using debt financing by using a prudential risk-management tool.

Returns and risk on housing portfolios: 2009-2015

Author provided

Explaining the increased rate of return

We used an assumption of 20% equity to demonstrate the impact of debt financing, which is in line with the current deposit requirement from major banks. Here’s an example to demonstrate the effect of debt financing.

Say an investor buys a house for A$1 million. The investor provides a 20% deposit ($200,000); therefore $800,000 was borrowed. The investor took an “interest-only” loan with an interest rate of 5% per year – so the interest cost is $40,000 per year. The investor also receives a net rental income of $30,000 in Year 1.

A year later, the investor decides to sell the property for $1.1 million (its value having increased by 10% over the year). The traditional performance analysis of property (without debt financing) would show the return on this housing investment is 13%: ($1,100,000-1,000,000+$30,000)/$1,000,000 = 13%.

Given the housing investor used debt financing, 13% is not the actual return for the investor. The investor’s actual return on equity for the investor is 45%: ($300,000-$200,000)+($30,000-$40,000)/$200,000 = 45%.

Property returns vs equity returns

Author provided

Experienced investors exploit their advantage

Overall, the results suggest the actual return rate for housing investors is significantly higher than the layman might expect from the major housing index providers.

The documented returns may not be applicable, however, to owner occupiers who are also using debt financing, via mortgages, to buy their property. There are two main reasons for this:

  • owner occupiers mainly use their houses for their own residency purposes, so no rental income will be generated to offset the mortgage repayment; and
  • housing investors are able to sell their properties whenever they want to realise gains in value, while owner occupiers do not have that flexibility.

Importantly, experienced housing investors, in the current low interest rate environment, have realised the benefits of debt financing and taken advantage of the knowledge gap to exploit the higher returns available to them.

These findings also highlight the need for an innovative product to assist home buyers to enter the housing market.

Author: Chyi Lin Lee , Associate Professor of Property, Western Sydney University

Westpac Sells 19% Of BT Investment Management

Consistent with this strategy to prioritise investment and capital management, Westpac Group has announced a fully-underwritten offer of 60 million shares (approximately 19% of BTIM’s shares on issue) to institutional investors domiciled in Australia and other relevant jurisdictions.

Following completion of the offer, Westpac’s ownership in BTIM will reduce from 29% to 10%. Westpac intends, subject to favourable market conditions, to sell its remaining 10% shareholding in BTIM in the future.

Completion of the offer is expected to add approximately 10 basis points to Westpac’s Common Equity Tier 1 capital ratio.

While BTIM will remain a strategic partner, following the selldown some changes in the arrangements between Westpac, BT Financial Group and BTIM will occur over time.

We estimate the post-tax profit on sale will add around A$100 million, or more than 1% of the banks FY17 earnings.

Are Banks In China In Trouble?

From Zero Hedge.

That’s not supposed to happen…

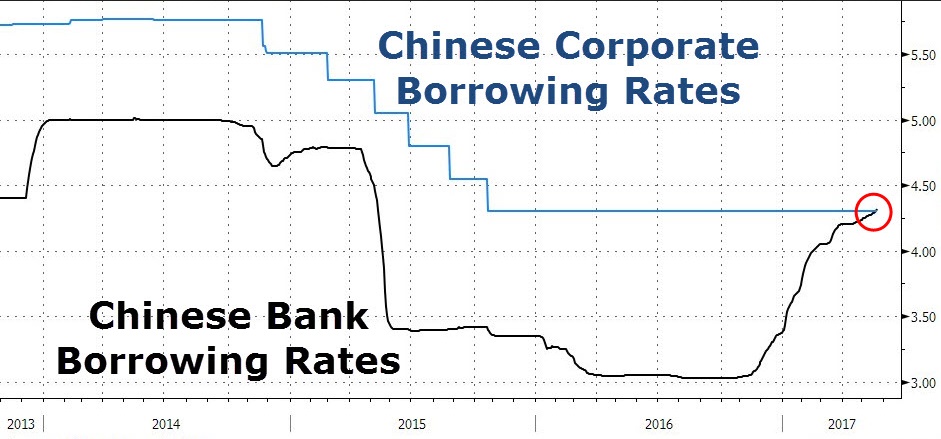
With the crackdown on financial system leverage underway, Chinese banks (and securities firms) are in big trouble. As we noted previously, China’s bond curve is inverted, yields are surging, and Chinese regulatory decisions shutting down various shadow-banking pipelines has crushed securities firms’ stocks. However, as Bloomberg points out, as China’s deleveraging efforts cut into banks’ profit margins, rising base funding costs and interbank credit risk concerns have pushed banks’ cost of borrowing beyond the rate they charge customers for loans for the first time in history.

As the chart above shows, the one-year Shanghai Interbank Offered Rate has exceeded the Loan Prime Rate, the first time this has happened since the latter was introduced in 2013.

“This is probably just the beginning” and interbank funding costs will rise further amid the drive to reduce leverage, said Xu Hanfei, chief fixed-income analyst at China Merchants Securities Co. in Shanghai.

Personal Insolvencies On The Rise

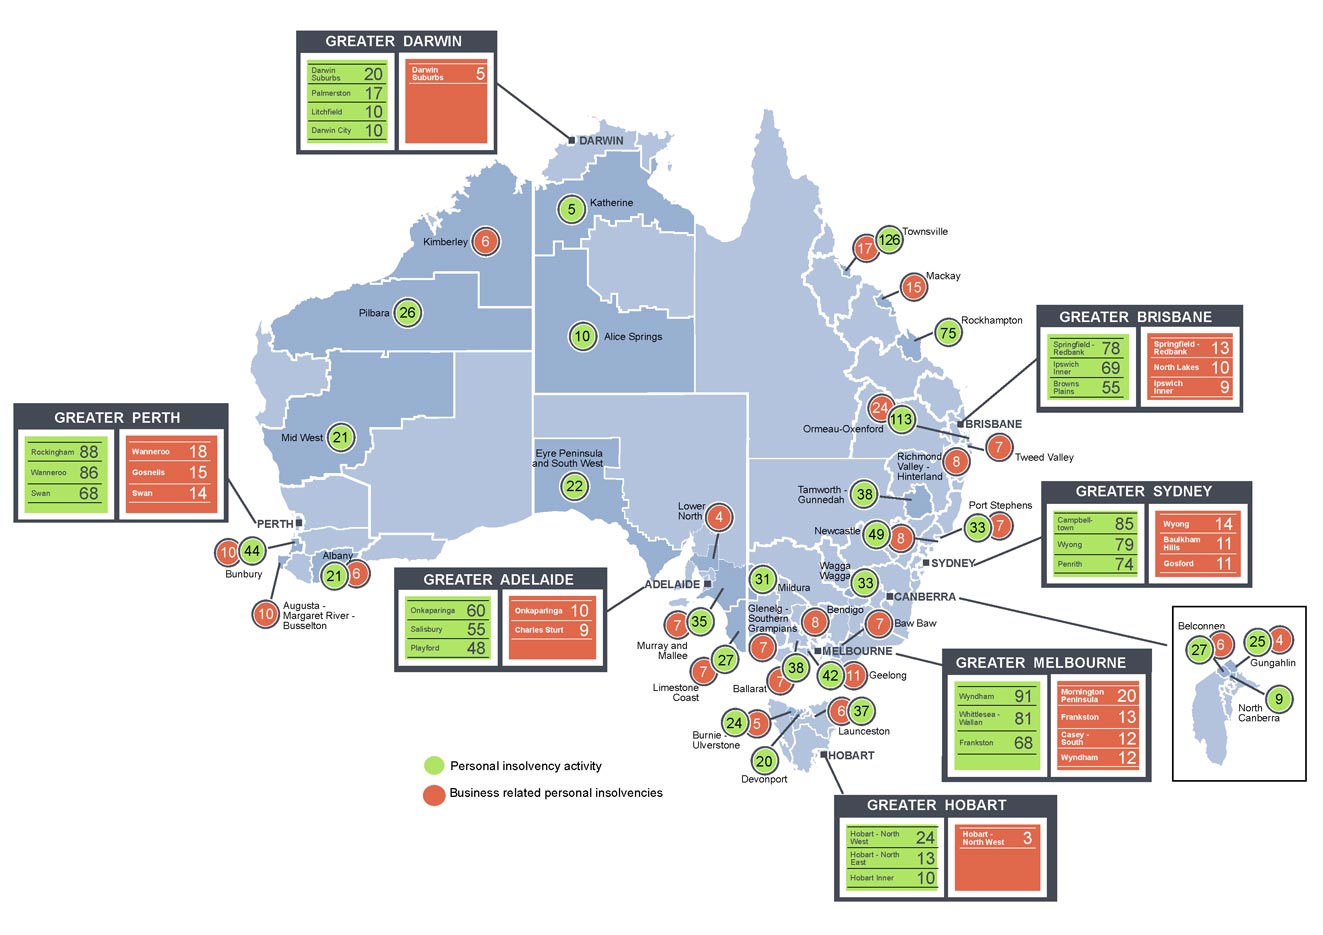
The Australian Financial Security Authority (AFSA) released regional personal insolvency statistics for the March quarter 2017. Looking across the regions, again we see signs of people in financial difficulty.  This data will feed into our updated mortgage stress modelling to be published in early June.

New South Wales

  • Greater Sydney
    • In the March quarter 2017 compared to the December quarter 2016:
      • the number of debtors rose 11.0%; the main contributor to the increase was Wyong
      • the number of debtors who entered a business related personal insolvency rose 8.6%; the main contributors to the increase were Wyong and Penrith.
  • Rest of NSW
    • In the March quarter 2017 compared to the December quarter 2016:
      • the number of debtors rose 1.9%; the main contributor to the increase was Lachlan Valley
      • the number of debtors who entered a business related personal insolvency fell 10.7%; the main contributor to the fall was Coffs Harbour.

Australian Capital Territory

  • In the March quarter 2017 compared to the December quarter 2016:
    • the number of debtors rose 26.9%; the main contributor to the increase was Belconnen
    • the number of debtors who entered a business related personal insolvency rose 84.6% (from 13 debtors to 24).

Victoria

  • Greater Melbourne
    • In the March quarter 2017 compared to the December quarter 2016:
      • the number of debtors rose 13.4%; the main contributor to the increase was Whittlesea – Wallan
      • the number of debtors who entered a business related personal insolvency rose by 5.7%; the main contributor to the increase was Mornington Peninsula.
  • Rest of Vic
    • In the March quarter 2017 compared to the December quarter 2016:
      • the number of debtors rose 10.8%; the main contributor to the increase was Glenelg – Southern Grampians
      • the number of debtors who entered a business related personal insolvency rose 8.3%; the main contributor to the increase was Bendigo.

Queensland

  • Greater Brisbane
    • In the March quarter 2017 compared to the December quarter 2016:
      • the number of debtors rose 19.3%; the main contributor to the increase was Ipswich Inner
      • the number of debtors who entered a business related personal insolvency rose 13.9%; the main contributor to the increase was Springfield – Redbank.
  • Rest of Qld
    • In the March quarter 2017 compared to the December quarter 2016:
      • the number of debtors rose 9.4%; the main contributor to the increase was Caloundra
      • the number of debtors who entered a business related personal insolvency fell 2.1%; the main contributor to the fall was Rockhampton.

South Australia

  • Greater Adelaide
    • In the March quarter 2017 compared to the December quarter 2016:
      • the number of debtors rose 12.6%; the main contributor to the increase was Marion
      • the number of debtors who entered a business related personal insolvency rose 9.8%.
  • Rest of SA
    • In the March quarter 2017 compared to the December quarter 2016:
      • the number of debtors rose 51.0%; the main contributor to the increase was Murray and Mallee
      • there were 25 debtors who entered a business related personal insolvency in the March quarter 2017, a rise from 12 in the December quarter 2016.

Northern Territory

  • The number of debtors rose 18.8% in Greater Darwin in the March quarter 2017 compared to the December quarter 2016
  • There were 18 debtors in rest of NT in the March quarter 2017, a fall from 20 in the December quarter 2016
  • There were 13 debtors who entered a business related personal insolvency in Northern Territory, a fall from 16 in the December quarter 2016.

Western Australia

  • Greater Perth
    • In the March quarter 2017 compared to the December quarter 2016:
      • the number of debtors rose 11.6%; the main contributor to the increase was Cockburn
      • the number of debtors who entered a business related personal insolvency was unchanged at 155 debtors.
  • Rest of WA
    • In the March quarter 2017 compared to the December quarter 2016:
      • the number of debtors rose 5.3%; the main contributor to the increase was Albany
      • the number of debtors who entered a business related personal insolvency rose 9.1%; the main contributor to the increase was Bunbury.

Tasmania

  • In the March quarter 2017 compared to the December quarter 2016:
    • the number of debtors who entered a personal insolvency in Greater Hobart fell 7.2%; the main contributor to the fall was Brighton
    • the number of debtors rose 35.5% in rest of Tas; the main contributor to the rise was Launceston

the number of debtors who entered a business related personal insolvency in Tasmania was unchanged at 28 debtors.

Construction Work Falls In March Quarter

The ABS preliminary trend data shows a fall overall of 6.8% compared with a year ago to $46.2 billion. Within that residential construction fell 1%, non-residential construction fell 3.5% and engineering fell 12.4%. The trend for total building work was down 1.1% in the March quarter.

In fact only the public sector non-residential construction held momentum. In other words, it is government spending which is holding the number up, whilst private sector investment is falling.

Within the residential data new houses and other residential both fell.

Once again the lack of business investment is taking its toll. With housing coming off, growth looks more uncertain, and only Government spending on infrastructure can it seems can save the day (but at what cost?)

Non major eases lending policy for FHBs

From Australian Broker.

Teachers Mutual Bank (TMB) and its divisions UniBank and Firefighters Mutual Bank have announced softer lending policy guidelines for first home buyers.

Effective from 18 May, the lender has made changes with regards to genuine savings requirements which reflect recent policy changes by Genworth, the bank’s LMI provider.

“Where deposit funds/savings have not been held for the minimum term of three months and satisfactory rental payment history is used to mitigate the genuine savings requirement, the First Home Owner Grant (FHOG) may be accepted to contribute to the 5% savings/deposit requirement,” the bank said in a broker note.

This follows from new underwriting guidelines from Genworth, effective from 16 May, which include the FHOG as an acceptable source if true ‘genuine savings’ cannot be found. All funds required to complete the loan application – deposits plus settlement disbursements minus the grant – must be shown at time of the mortgage application.

Genworth’s new conditions place responsibility on the lender to ensure the borrower is eligible to receive a FHOG at the time of the application.

“We are pleased that the changes proposed will further support first homebuyers realise their dream of homeownership,” TMB said.

Major bank branch undercutting broker rates

From The Adviser.

The Adviser has learned that CBA could be actively targeting home loan customers that were introduced by brokers with the promise of a better rate should they refinance via a branch.

Despite the bank telling The Adviser earlier this week that it is once again accepting new refinance applications for investment home loans with P&I repayments through broker channels (following a hiatus on new investor refinance applications in February), concerns that some of the major banks are favouring their branch networks over the broker channel are rising.

Adding to the speculation, a source speaking to The Adviser said that he was actively targeted to refinance his home loan during an application for a credit card at a North Sydney branch of the Commonwealth Bank of Australia (CBA).

During the assessment process the source was surprised to hear that the branch could give him a “lower rate than his broker” if he refinanced his home loan directly with CBA.

The loan was originally written by an Aussie broker.

When asked how the branch was able to do this, the representative at the bank told the CBA-customer that he had been told by his manager to refinance broker-originated loans where possible.

The Adviser can confirm that a representative at the Walker Street branch in North Sydney said that they could give a CBA customer a ‘better deal’ than a broker on a refinance loan.

When asked by The Adviser whether CBA is looking to reduce its mortgage flows through the broker channel, a Commonwealth Bank spokesperson said: “Commonwealth Bank is committed to consistently delivering the best customer outcomes for home buyers, and mortgage brokers are an important part of how we meet the home buying needs of customers.”

Proprietary channels a ‘strategic priority’ for CBA

However, the bank has been open in its preference to boost the proprietary channel, telling The Adviser in February that it was a “strategic priority”.

Following the 2017 half year results announcement in February (which showed a 4 per cent drop in broker market share over the six months to December 2016), The Adviser asked CEO Ian Narev whether the bank was moving away from the broker channel.

Mr Narev said that while the broker network “provides a really important proposition that customers like and want” and will be a “critical part of the group strategy”, the “preference” was for customers to go through the proprietary channel.

He said: “[O]ur preference is always going to be, as you can imagine — for all sorts of reasons — to service as many of our customers through our own channels as we possibly can. That’s a strategic priority for us.”

Mr Narev told The Adviser that the increase in loans being written directly through the bank was due to the fact that it had “upgraded and put more lenders in the branches — people who are able to have lending specific conversations with customers”.

He added: “We’ve been able to provide more analytics to support those lenders and others in the branch and we’ve really invested in the branch proposition and as a result of that we’ve seen our own share of the proprietary channel go up at the time when the markets have gone down — so for us that is a pretty good outcome.”