Hard Data, Soft Data and Forecasting

From The St. Louis Fed on The Economy Blog.

People frequently scour economic data for clues about the direction of the economy. But could the many types of data cause confusion on what exactly the state of the economy is? A recent Economic Synopses essay examined some of this potential confusion.

Business Economist and Research Officer Kevin Kliesen noted that data essentially fall into two camps:

  • Hard data, such as that from government statistical agencies used in constructing real gross domestic product (GDP)
  • Soft data, such as business, consumer confidence and sentiment surveys, financial market variables, and labor statistics

Kliesen crafted two index measures of these types of data, which can be seen in the figure below.1 He noted that these indexes could be useful for quantitatively showing how different types of data can influence forecasts of real GDP and, in turn, the expectations of policymakers.

hard soft data

“The indexes exhibit the normal cyclical behavior one would expect in the data: They increase in expansions and decrease in recessions,” Kliesen wrote.

He also noted that the hard data index showed stronger economic conditions from around the beginning of the recent recovery until late 2013. More recently, however, the soft data index is showing stronger economic conditions.

Effect on Forecasts

To show the possible effects of favoring one type of data when forecasting, Kliesen ran forecasts of monthly real GDP growth using only hard data and using only soft data:

  • Forecasting growth using the hard data resulted in projected growth of a little more than 2 percent per quarter through the end of 2019.
  • Using soft data, however, resulted in a peak of a little more than 4 percent in early 2018.

He then compared the results with the consensus forecasts found in the Federal Reserve Bank of Philadelphia’s Survey of Professional Forecasters (SPF) and the Federal Open Market Committee’s (FOMC’s) Summary of Economic Projections (SEP). The results are in the table below.

Forecasts for Real GDP
Percent Changes, Q4/Q4
Hard Data Soft Data SPF SEP
2017:Q4 1.9 3.9 2.3 2.1
2018:Q4 2.2 2.9 2.4 2.1
2019:Q4 2.4 2.5 2.6 1.9
NOTES: The SEP values are taken from the March 15 release and are Q4/Q4. The SPF values use average annual data and are taken from the Feb. 10 issue.
Federal Reserve Bank of St. Louis

Kliesen concluded by saying that most forecasters and FOMC policymakers have relied more on hard data when forecasting. He wrote: “This is probably prudent, since the hard data flows are used in most macroeconomic forecasting models.”

He also noted: “However, as the upbeat forecasts from the soft data show, there appears to be some upside risk to the near-term forecast for real GDP growth. This upside risk likely reflects the widespread expectation of expansionary fiscal policy and a strengthening in global growth.”

Net Bank Tax Will Yield Just $3.86 Billion

So the big four have released data on the impact of the proposed bank tax, which was estimated to give more than $6 billion over 4 years, based on a 6 basis charge on selected liabilities.  They say on an annual pre-tax basis they would pay around $1.38 billion, or $965m post tax (as the tax would be an allowable expense).

The net effect after tax (around 30% deduction) would yield just $3.86 billion (plus a smaller amount from Macquaire at current levels.

Its a moot point whether this post tax position was included in the budget papers or not.


NAB Estimates Bank Tax Impact

NAB also told their shareholders about the impact of the proposed bank tax.

As one of NAB’s valued shareholders, I feel it is important you hear from me directly about the major bank tax announced in the Federal Budget on 9 May and what it will mean for NAB.

The tax – $6.2 billion over four years – is poor public policy that will affect every Australian.

We are concerned the tax has been developed without sufficient consultation or consideration of the impact on bank customers, shareholders, suppliers and employees – or indeed the broader economy.

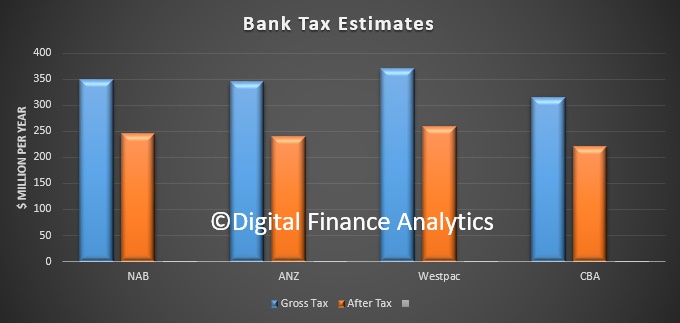
There remain many unanswered questions. But based on what the Government has announced to date, and applied to our business as it stands, the tax could cost NAB approximately $350 million annually, or $245 million post tax.

However the actual cost will not be known until the final legislation for the tax has been passed and we can fully assess its impact on NAB’s business.

NAB will continue to strongly object to this tax and will do so by engaging with you, the broader community and with the Government and Parliament.

We are encouraging a Senate committee to conduct an inquiry into the legislation to enact the tax, so Australians can have a deeper understanding of the process behind the tax and how it will work.

We have also called for the exposure draft legislation to be released for public consultation so the community can have its say. This is an important step for a reform of this scale and nature.

Given the tax is being enacted for the purposes of budget repair, we have encouraged, through our initial public response, the inclusion of an end date for the legislation once its stated objectives have been met.

The Government has said this tax can be simply “absorbed”. You know, I know and the Government knows that a tax cannot be “absorbed”. It must be passed on somewhere.

No decisions have been made on how we will seek to manage the cost of this new tax. While we must balance the interests of all of our stakeholders, the options available to us are limited.

We could reduce what we spend with our more than 1700 suppliers. Many of these are small businesses that have provided great support and service to our bank over many years. Reducing our spend on suppliers also affects our customers and shareholders.

We could increase the rates we charge borrowers or reduce the rates we pay savers.

We could invest less in new products, facilities and services for our 10 million customers.

We could invest less in our workforce; all 34,000 employees, most of whom live and work in the communities they serve across Australia.

Or we could allow this new tax to affect our profitability. This would impact our shareholders – the 570,000 people like you who own shares in the bank directly and the millions of Australians who own NAB shares through their superannuation fund.

We will continue to advocate for you, our shareholders. You invest your savings in NAB and together with all our stakeholders are what make our company what it is today.

The Board is interested in your views on this tax and how we can represent you. Please share any feedback or thoughts you might have by emailing Shareholder.Centre@nab.com.au

Thank you for your continued support.

ANZ Estimates Bank Tax Impact

ANZ today commented on the estimated financial implications of the proposed tax on bank liabilities. The proposed enabling legislation has not yet been finalised.

The tax is expected to be paid on a quarterly basis, with the first payment to be made be for the September quarter 2017. We expect that this will be deductible for tax purposes in Australia.

Based on the current draft legislation and ANZ’s 31 March 2017 Balance Sheet, we estimate that the annual financial impact of the tax would have been approximately $345 million on a before tax basis, and approximately $240 million after tax.

We note that at this stage the financial impact can only be an estimate. ANZ’s balance sheet is also undergoing change due to our strategic initiatives that will impact the size of the tax paid.

The net financial impact, including the Bank’s ability to maintain its current fully franked ordinary dividend, will be dependent upon business performance and decisions we make in response to the tax.

ANZ will continue to update the market as the legislation is finalised and further analysis is completed.

Impact of new major bank tax on Westpac

Westpac today updated the market on the new major bank budget deficit repair levy (‘Levy’) announced in the 2017 Federal Budget.

Given the limited detail available to us it is difficult to precisely calculate the Levy.  Nevertheless, given information received to date, we are able to provide preliminary estimates of the cost of the Levy for Westpac.

Based on Westpac Banking Corporation’s balance sheet at 31 March 2017, the announced 0.06 per cent (or 6 basis point) Levy would apply to approximately $615 billion of Westpac’s liabilities (‘Impacted liabilities’).  Impacted liabilities would exclude certain prescribed items including approximately $174 billion of financial claims scheme eligible deposits. The Levy is expected to be tax deductible, but will not attract franking credits (Australian tax imputation credits).

As the Levy is expected to be applied from 1 July 2017, it will impact Westpac’s Full Year 2017 financial results (year ended 30 September 2017).  On the basis of the above estimates, it would result in a new cost in our Second Half 2017 of approximately $65 million after tax.  On an annualised basis, that represents a cost of around $370 million or around $260 million after tax.  The exact cost will depend on the final form of the new legislation passed and the composition of Westpac’s liabilities.

No company can simply ‘absorb’ a new tax, so consideration is being given to how we will manage this significant impost on the bank.  We plan to consult with stakeholders, including shareholders, on the Levy.

To dimension the impact of the Levy for our shareholders, the $260 million after tax cost is equivalent to around 8 cents per share (using the above estimates).  Based on Westpac’s 2016 full year dividends of 188 cents per share, this represents 4.3% of dividends paid.

Westpac has strongly objected to the Levy on the grounds that it is an inefficient tax that targets just five companies; it places the major Banks at a competitive disadvantage relative to international peers; and it is a tax on growth because as lending and investment increases the cost of the Levy also rises.  A further objection is that the Levy currently has no end date, so it becomes a permanent tax impost on companies that are already amongst Australia’s largest taxpayers.

Property crash fears downgrade Australian banks

From The New Daily.

Fears of a property market crash have prompted S&P to downgrade the creditworthiness of almost all of Australia’s finance sector.

The global ratings agency issued a statement on Monday explaining its decision was founded on the “economic imbalances” caused by soaring private-sector debt and property prices.

“Consequently, we believe financial institutions operating in Australia now face an increased risk of a sharp correction in property prices and, if that were to occur, a significant rise in credit losses,” the agency wrote.

“With residential home loans securing about two-thirds of banks’ lending assets, the impact of such a scenario on financial institutions would be amplified by the Australian economy’s external weaknesses, in particular its persistent current account deficits and high level of external debt.”

The rating downgrades applied to 23 financial institutions, including AMP, Bank of Queensland, and the Bendigo and Adelaide Bank.

The notable exceptions were the ‘Big Four’ (AA-) and Macquarie (AA), which kept their ratings, but only because the agency presumed they would be bailed out by the government in the event of any catastrophe.

The downgrades follow a March report by OECD warning that soaring house prices and ever-rising household debt had exposed the Australian economy to “extreme vulnerability”.

The Paris-based organisation — the research arm of the world’s richest nations — said the Australian property market was showing “hints of a slowdown” that could trigger “a rout on prices and demand” that spreads to all other parts of the economy, cutting consumer spending and pushing up mortgage defaults.

House prices have increased in real terms by 250 per cent from the 1990s, the OECD said, with most of that increase occurring over the past few years, particularly hitting first-time buyers in Sydney.

At the same time, the nation’s ratio of household debt to GDP has hit a record high at 123 per cent, the third highest in the world, the OECD report found.

Meanwhile, in S&P’s downgrade, AMP Bank was cut from A+ to A, while Bank of Queensland and Bendigo and Adelaide Bank both went from A- to BBB+. All three went from a negative to stable outlook, meaning the agency does not foresee further cuts in the immediate future.

Credit ratings measure how likely an institution is to be able to repay its bond holders on time and in full. Ratings between AAA and BBB are investment grade, while BB to D are speculative grade.

An institution rated A- is considered to have a “strong capacity” to repay, but is “somewhat susceptible to adverse economic conditions and changes in circumstances”. BBB equates to an “adequate” capacity to repay.

The other affected institutions were:

  • Australian Central Credit Union
  • Auswide Bank
  • Community CPS Australia
  • Credit Union Australia
  • Defence Bank
  • Fisher & Paykel Finance
  • G&C Mutual Bank
  • Greater Bank
  • IMB
  • Liberty Financial
  • mecu
  • Members Equity (ME) Bank
  • MyState Bank
  • Newcastle Permanent
  • Police Bank
  • Qudos Mutual
  • QPCU
  • Rural Bank
  • Teachers Mutual

S&P joined the other two major ratings agencies last week in maintaining the Australian government’s AAA rating, but with a negative outlook.

CBA Reveals Impact of The Bank Tax

Commonwealth Bank Chairman, Catherine Livingstone AO, today emailed shareholders outlining the estimated impact of the Federal Government’s recently announced bank levy on the Group. We also had Government confirmation that it will be tax deductible and the impact of this is also shown in the CBA announcement.

Commonwealth Bank today sent the below communication to shareholders outlining the estimated impact of the Federal Government’s recently announced bank levy on the Group.

We have limited information on which to base our calculations, however we estimate that the levy will amount to approximately $315 million per annum, $220 million after tax. This is based on the Group’s current financial position and subject to any further amendments made through the parliamentary process.

The liability base on which the levy is calculated will exclude approximately $240 billion of deposits which are covered by the Financial Claims Scheme, as at 31 March 2017.

Shareholder communication:

Dear shareholder,

The recently announced Federal Budget included a new levy on the five largest financial institutions in the country.

We have expressed serious concerns that the new levy is a poorly designed policy, done without consultation, which impacts not just on the banks but also on our shareholders and customers.

The Commonwealth Bank paid $3.6 billion in tax in the 2016 financial year, making us Australia’s largest taxpayer.

We have limited information on which to base our calculations, but from 1 July 2017, we estimate that the new levy for the Commonwealth Bank will be approximately $315 million per annum ($220 million after tax). This is based on the Group’s current financials and subject to any further amendments made through the parliamentary process.

The budget announcement also included a number of other measures which potentially intrude into the operations of the banks and have significant implications for good corporate governance. For example, the fact that regulators will be empowered to override your Board calls into question the established fundamental governance framework which governs publicly listed companies.

Commonwealth Bank has consistently returned on average 75% of profits as dividends to more than 800,000 shareholders each year. In addition, millions of Australians have also benefitted through their superannuation funds. The remainder of your company’s profits are reinvested for future growth, so that we can serve our customers better, while continuing to deliver for shareholders and the broader Australian economy.

We are deeply concerned the new levy undermines our ability to achieve these goals.

Last Monday, Commonwealth Bank lodged an official submission to Federal Treasury outlining our concerns about the tax. You can read our full submission by clicking here.

Many questions and concerns have been raised regarding this new tax. We will endeavour to respond to as many questions as we can. To stay up to date with our comments, please check our CBA Newsroom site.

Your CEO, Ian Narev, and I would like to hear your views and respond to any questions you may have on the new tax. We therefore intend to hold an interactive telephone “Town Hall” discussion for shareholders in the lead up to our Annual General Meeting in November. Details and invitations will be issued with our full year results in August.

In the meantime, I thank you for taking the time to read about our views on the tax.

Bendigo and Bank of Queensland Downgraded By S&P

The latest assessment from S&P is finely balanced, on one hand calling out the elevated risks emanating from rising household debt and risks of a property correction, whilst on the other suggesting that recent regulatory intervention should help to manage the adjustment.

But overall, risks are higher and their revised credit profiles reflect this with more than 20 entities downgraded. Whilst the majors rating has not changed – reflecting the implicit government guarantee that their “too-big-to-fail” status gives them, and Suncorp remains at its current A+/Stable rating; both Bendgio Bank and Bank of Queensland took a downgrade to BBB+/Stable.

The consequence for these regionals is that funding costs just went up (and probably by more than a 6 basis point tax on the majors would have given in relative benefit). They have high customer deposits, but again the regional bank playing field is tilting against them when it comes to long term funding.

The majors would be downgraded if Australia is:

Our outlooks on the long-term issuer credit ratings on the four major Australian banks remain negative reflecting our view that pressure remains on the Australian government’s likely support for these banks. We expect to lower our issuer credit ratings on these major banks and their core subsidiaries if we lowered our long-term local currency sovereign rating on the Commonwealth of Australia (AAA/Negative/A-1+) or if we reclassified our assessment of the Australian government’s supportiveness toward systemically important private sector banks to supportive from highly supportive.

Mortgage Book Risks – LTI The Key

An excellent research piece from institutional investment fund JCP Investment Partners, picked up in the AFR today.  Their granular analysis of the mortgage sector (including leveraging our data), underscores the risks in the mortgage books, and explains the RBA’s recent change of tune on household finances.

As a young bank analyst learning the trade in the early 1990’s, understanding credit and capital was the primary focus. Discussions with seasoned bank credit officers provided much insight and learnings.

In credit, I learnt that security/collateral is ‘makeweight’ and one should only lend on ability to service and repay from cash flow. Hence the old mortgage lending rule of thumb; lend no more than 3x gross income unless it’s a doctor, then maybe stretch it to 4x. On this basis, a loan is generally repaid within 10 years, ceteris paribus – a suitable outcome for both lender and borrower.

In the UK, this is embedded in regulation. The Prudential Regulation Authority (PRA) and the Financial Conduct Authority (FCA) ensure that mortgage lenders do not extend more than 15% of their total number of new residential mortgages at loan to income (LTI) ratios at to or greater than 4.5x.

Understanding the borrower’s capacity to service as time moves on is paramount. Many bank bad debts are caused by future changes in borrower circumstances. Accordingly, a bank’s corporate loan book is generally reviewed annually.

However, mortgages don’t have the same level of scrutiny, yet the amount borrowed could be higher and the lender more exposed. Take the eventual transition from “interest only” to “principal & interest”; where does the borrower find the additional 40% repayment obligation?

The Australian credit system now looks over exposed to one asset class – the residential home. A function of both very low mortgage credit risk weights and the disintermediation of corporate debt.
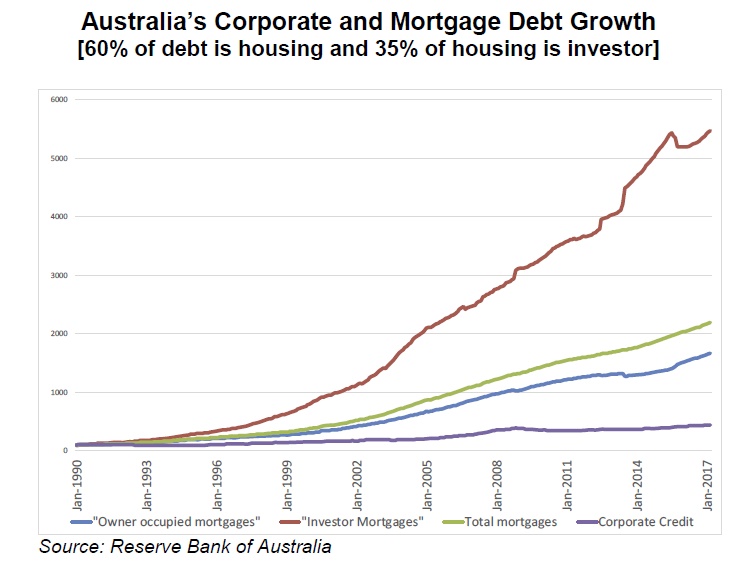
Given the dynamics of the Australian housing market over the last three to five years; low interest rates, proliferation of interest only products coupled with low income and employment growth, the embedded risks in the mortgage system have increased materially.

When one scrutinises the typical bank earnings release (some 250 pages of information), the loan to income ratio is not mentioned or disclosed, yet it is one of the most important credit metrics for an analyst/investor to
understand.

We suspect the old 3x gross income rule has been fundamentally breached. Data from the RBA, HILDA, APRA and the major banks, plus our own proprietary sources confirm this. Indeed, we believe gross incomes could have been capitalised to well over 6x, which would partly explain the rapid increase in Melbourne and Sydney house prices.

What is the difference between 3x and 6x? At least 15 years in repayment terms, assuming no material change in income and the level of interest rates. However, the Australian cash rate has never been lower than its current 1.50%, and the rest of the developed world is beginning to move rates up.

A recent conversation with a high-end Sydney mortgage broker was a revealing insight to practices “if we included private school fees and child care costs, there would be no borrow”. Expenses are quite simply fudged. Gone is, the historical rational reliance on gross income and 3x that as the maximum mortgage lend. The banks appear to have weakened underwriting standards to pursue the asset backed lend – sustaining credit fuelled house prices.

Then consider the mortgage broker revenue model. An upfront payment of ~65bps and a trail of ~16bps – this makes large interest only mortgages very lucrative.

As exuberance towards the Australian home grew to now irrational levels, the old credit rules of thumb appears to have been left by the wayside. Banks talk about mortgage account numbers, but not values. Banks talk about LVRs, but not LTIs. Banks talk about averages, but not distributions. And Banks talk about loss rates of a mere 2bps, but fail to capture a full credit cycle.

We draw from the paper “Stabilising and Healing the Irish Banking System: Policy Lessons” Dirk Schoenmaker, Duisenberg School of Finance 12 January 2015. The Minsky ‘financial instability’ hypothesis captures the typical credit cycle quite well; five stages from the emerging boom to the eventual bust … human behaviour the primary driver:

1. Credit expansion: characterised by rising asset prices;
2. Euphoria: characterised by overtrading;
3. Distress: characterised by unexpected failures;
4. Discredit: characterised by liquidation; and
5. Panic: characterised by the desire for cash

Minsky’s financial instability hypothesis highlights the procyclicality of the financial system; risk is under-estimated in good times, and overestimated in bad times. Moreover, the more debt is built up in the upswing, the more severe is the deleveraging in the downswing. Thus, the importance of equity capital for banks. Financial fragility builds over time as information about counterparties decays; the loan to income ratio underwriting discipline is lost. A crisis may arise when a (possibly immaterial) shock causes lenders to suddenly have incentives to produce information, what is the loan to income ratio?

Could the current action in the Federal Court of Australia, Australian Securities and Investment Commission vs. Westpac Banking Corporation, be that seemingly small shock that causes lenders and investors to request more information and adjust future mortgage sizes? The marginal buyer is then less financially equipped to pay more. ASIC simply has to establish that Westpac breached provisions of the National Consumer Credit Protection Act 2009 that require a lender to assess whether a loan would be ‘unsuitable’ for the consumer (sections 128, 131 and 133). While the Act does not define, what constitutes an ‘unsuitable’ loan, section 131(2) expressly provides that a loan must be assessed as ‘unsuitable’ if the consumer will be, or is likely to be unable to meet their payment obligations either at all, or only with substantial hardship (section 131(2)(a)).

Or, could it be the Regulators and Central Bankers eventual understanding of the embedded risk in the Australian mortgage system that will cause them to respond with further control and restriction? Credit fuels a bubble, and its ultimate rationing and eventual withdrawal deflates it. In Ireland, it is postulated by Schoenmaker that “‘Groupthink’ among bankers, supervisors and central bankers may explain that the dangers of the strong build-up of house prices were not appreciated” – The euphoria stage, where capital misallocation exacerbates the fervour.

This is where we are today

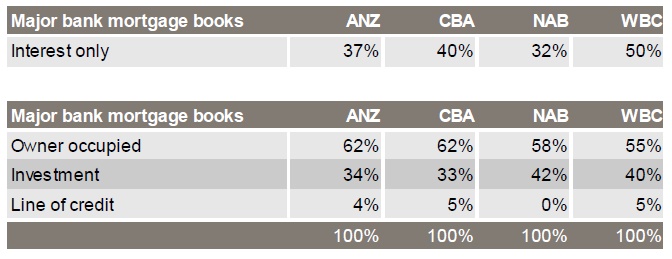
Post the global financial crisis of 2007/08, most economies de-levered. However, in Australia we kept on going on, 6% cagr owner occupied mortgage growth and 8% cagr investor mortgage growth. Interest only loans were ~30% of mortgage credit in 2012, today they’re ~42% and well above investor credit: Westpac is especially concerning at 50%.

Proprietary data

Collecting quality information is central to our research process. We have assembled a range of data from APRA, the RBA, the ABS, HILDA, the major banks and Digital Finance Analytics.

We then ran a query which broke down the mortgage system, by value, on two metrics – Loan to Income (“LTI”) and Loan to Value (“LVR”). Both metrics are dynamic, in that they pick up current income and current collateral values. By value is an important distinction as most of the Banks’ publish data averages, and distributions by number.

There are enough very low mortgage accounts which distort the averages. It is not uncommon for a borrower to essentially fully pay the mortgage but keep the account open with a nominal outstanding amount as a “rainy day” facility.
The findings

  • 49% of credit outstanding is held by households
    with: Current LTI ratio > 4.0x; the average LTI is 6.4x
  • Current LVR > 50%; the average LVR is 78%
  • These households represent 70% of owner occupied credit.
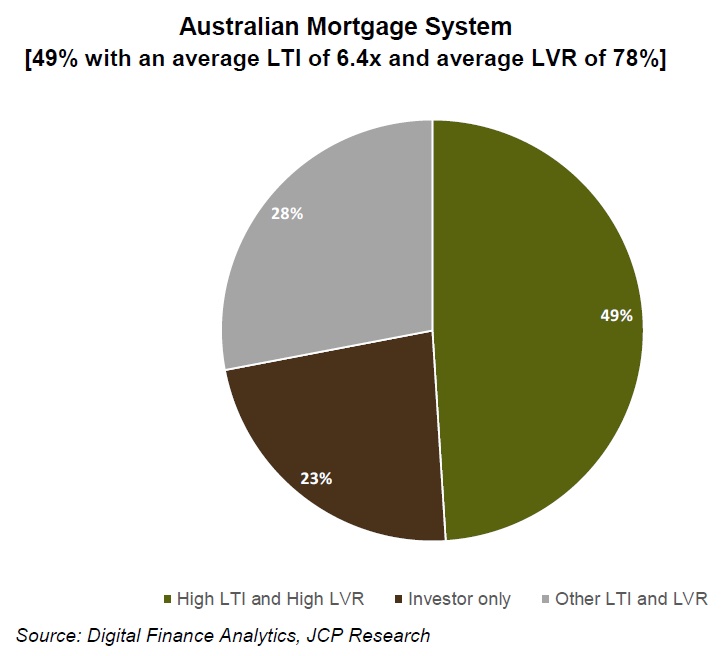
At first glance this was somewhat of a surprising outcome. But when put into the context of very low interest rates, the proliferation of interest only mortgages and the rapid appreciation of house prices in Sydney and Melbourne, it makes more sense.

Older loans (7+ years) started much smaller, are more likely paired with houses that have risen substantially, and more likely to be amortising (not interest only).

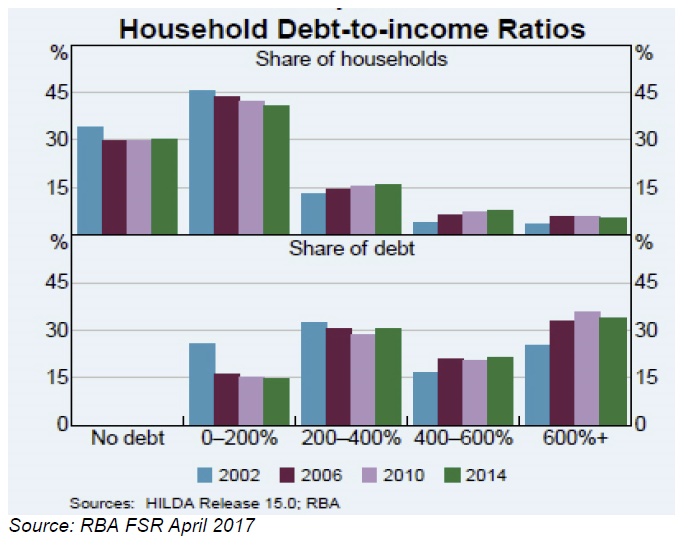
These results are corroborated with the RBA’s recent Financial Stability Review analysis of the 2014 HILDA data (shown below). More than 50% of debt was held by household, with a 4.0x or larger LTI, regardless of LVR. Our analysis suggests the level has increased a further 5-10% since 2014.
We identified three specific cohorts that appear to pose the most risk:

  • Professional Households
  • Young Pretenders with stretched budgets
  • Young Families

Almost one third of the High LTI / High LVR exposure is held by high income households with an average of $250k in gross income. Despite being less than 2% of all households they represent 17% of the mortgage book, with an average mortgage outstanding of $1.6m. In addition, almost half have an investment property loan also.

Younger households last into the property market always suffer; amongst these we identify two groups with high LTI’s and high LVR’s; the “Young Pretenders” and “Young Families”. Bank lending behaviour has put these groups at risk also.

The “Young Pretenders” with an average income of $110k and a mortgage outstanding of $810k are burdened with an eye-watering average LTI of 7.4x. Despite being less than 0.5% of households, they represent 2.5% of the mortgage book.

The “Young Families” with high LTI and high LVR appear slightly better placed, with $80k in gross income vs. $420k mortgage outstanding. Clearly less leverage, and only 4.1% of the book, but with question marks surrounding treatment of expenses in home loan applications, and generally high costs of living faced by this cohort, actual stress may be very high.

Interest only could be Australia’s sub-prime. Interest only loans proliferate throughout the mortgage book, across cohorts and circumstances. Only one trend emerges; interest only households tend to have lower incomes and higher amounts of credit outstanding and tend to use interest only to borrow more. With caps on interest only loans, only time will tell if such households can afford the mortgages they have.

Buffers are sometimes touted as the offset to systematic stress in the mortgage book. However, our analysis shows the buffers primarily reside with the low risk cohort. That is 60% of the buffers (five months) are with the low risk households with low LTI’s and/or low LVR’s, this cohort represent only 30% of the debt. The borrowers who need the buffers don’t have them.

Needless to say, the system looks vulnerable. The old LTI ratio has left the banking lexicon, exposing a risk that we may have over capitalised incomes and hence over extended credit into certain cohorts.

The long virtuous housing wealth cycle could easily transition to a vicious cycle. Smaller mortgages to deleveraging, flat to decreasing house prices and exuberant to melancholic animal spirits will likely expose much bad lending behaviour.

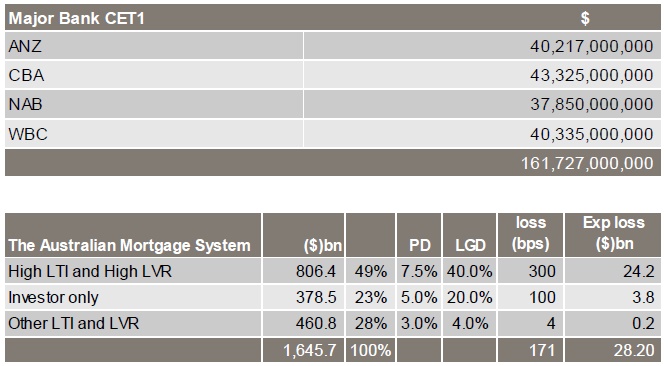
If we breakdown the system by our cohorts and apply a sensible Probability of Default (PD) and Loss Given Default (LGD) to each, 20% of bank equity capital is at risk (refer tables below). If we apply the Irish scenario to the high-risk cohort; 20% impairment rate with 50% provision cover, then 50% of bank equity capital is destroyed.

Ten years on, the Irish mortgage system remains weighed down with 25% non-performing loan ratios, as banks balance antiquated personal insolvency laws, politics and hope for economic recovery and write backs. Caught in the middle of the Anglo-Saxon system of easy credit provision and the Roman system of strong creditor’s rights.

Probability of default (PD) – the likelihood of a default over a time horizon. It provides an estimate of the likelihood their a borrower will be unable to meet its debt obligations.

Loss given default (LGD) – is the share of an asset that is lost if a borrower defaults.

20% of Equity Capital at Risk

The Australian mortgage system, February 2017.

Latest reported major bank core equity positions and forecast losses given likely PDs and LGDs.

PDs and LGDs formulated based on APRA tables and JCP judgement.
In summary, we see significant risk in Australian commercial bank lending books. The risk in a banks book is a function of recent lending behaviour, especially in a market with low rates, high interest-only shares, and quickly growing prices.

Reproduced with permission.

Note their disclosures:

The information contained in these papers is general advice only. This advice has been prepared without taking into account client objectives, financial situation or needs. Because of that, clients should, before acting on the advice, consider the appropriateness of the advice, having regard to the client’s objectives, financial situation and needs. If the advice relates to the acquisition or possible acquisition of a financial product, clients should obtain a PDS relating to the product, consider the PDS and seek professional advice before making any decision about whether to acquire the product. JCP cannot guarantee the success of the return of capital of any investment in the product. Any forecasts or opinions are JCP’s own at the date of the paper and may be subject to change without notice.

Suncorp 3Q17 Update – Tough Times

Suncorp Bank today provided its quarterly update on Bank assets, credit quality and capital as at 31 March 2017, as required under Australian Prudential Standard 330.

The home lending portfolio grew modestly over the quarter, reflecting challenging market conditions.

Suncorp Banking and Wealth CEO David Carter said the Bank continued to focus on targeted segments of the market, prioritising risk selection and quality, and was well positioned in its standing relative to regulatory changes.

“We responded early to signals by the regulators to improve our position in relation to changes to macro-prudential settings, particularly APRA’s interest-only and investor lending,” Mr Carter said.

“We have been deliberate in shaping the portfolio through our focus on risk selection and expect modest growth in home and business lending as our competitors align to more conservative positions.”

Business lending growth was flat, with strong new business volumes offset by repayments from successfully completed property developments and favourable conditions for agribusiness customers leading to repayment of loans.

Credit quality across Suncorp Bank’s business loan portfolio remains sound, with very little exposure to the higher risk lending segments of inner-city apartments and businesses affected by the resources industry slowdown.

The benefits of prudent risk management are reflected in the continued strong credit quality performance over the quarter, with impairment losses of $7 million, or 5 basis points of gross loans and advances (annualised).

The Bank’s funding strength was demonstrated during the quarter through the successful pricing of a $1.25 billion Residential Mortgage-Backed Security (RMBS) and an increase in the Net Stable Funding Ratio (NSFR) position, closing at 109%.

Following the payment of the interim FY17 dividend to Suncorp Group Limited, the Bank’s Common Equity Tier 1 (CET 1) ratio continues to be strong at 9.19% and remains above the target range of 8.5% to 9.0%.
Suncorp is also in the process of determining the impacts on the business, following several announcements in the Federal Budget impacting the financial services sector.

“Australia has a strong banking system and Suncorp supports the principles of the Financial Services Inquiry to achieve competitive neutrality,” Mr Carter said.

“The Treasurer announced two measures that have the potential to support competitive neutrality – the Bank levy and the harmonisation of supervision of the ADI and non-ADI sector.

“These measures have the potential to further improve the effectiveness of the macro prudential settings that have recently been introduced and will go some way to realising a more level playing field.”