The FOMC is expected to announce a 25 bp hike in the federal funds rate’s midpoint to 1.125% on Wednesday, June 14. Despite March 14’s 25 bp hiking of fed funds to a 0.875% midpoint, the 10-year Treasury yield fell from March 13’s 2.62% to a recent 2.20%. If the 10-year Treasury yield does not climb higher following June 14’s likely rate hike, the scope for future rate hikes should narrow.
At each of its end-of-quarter meetings, the FOMC updates its median projections for economic activity, inflation, and the federal funds rate. At the March 2017 meeting, the FOMC’s median projections for the year-end federal funds rate were 1.375% for 2017, 2.125% for 2018, and 3.0% for 2019 and beyond. However, the recent 10-year Treasury yield of 2.20% implicitly reflects doubts concerning whether the fed funds rate’s long-run equilibrium will be as high as 3.0%.
Perhaps, the FOMC will supply a lower long-run projection for fed funds. Nevertheless, in order to ward off speculative excess in the equity and corporate credit markets, the FOMC may wisely decide to overestimate the likely path of fed funds. The last thing the FOMC wants to do is help further inflate an already overvalued equity market.
Moreover, equity market overvaluation has pumped up systemic liquidity by enough to narrow high-yield bond spreads to widths that now under-compensate creditors for default risk. According to a multi-variable regression model that explains the high-yield bond spread in terms of (1) the VIX index, (2) the average EDF (expected default frequency) metric of non-investment grade companies, (3) the Chicago Fed’s national activity index, and (4) the three-month trend of nonfarm payrolls, the high-yield spread’s recent projected midpoint of 410 bp exceeds the actual spread of 380 bp. Moreover, after excluding the VIX index from the model, the predicted midpoint widens to 500 bp. The 90 bp jump by the predicted spread after excluding the VIX index is the biggest such difference for a sample that commences in 1996. The considerable downward bias imparted to the predicted high-yield spread by the recent ultra-low VIX of 10.2 points highlights the degree to which a richly priced and highly confident equity market has narrowed the high-yield bond spread. (Figure 1.)
High-yield spreads can narrow amid Fed rate hikes
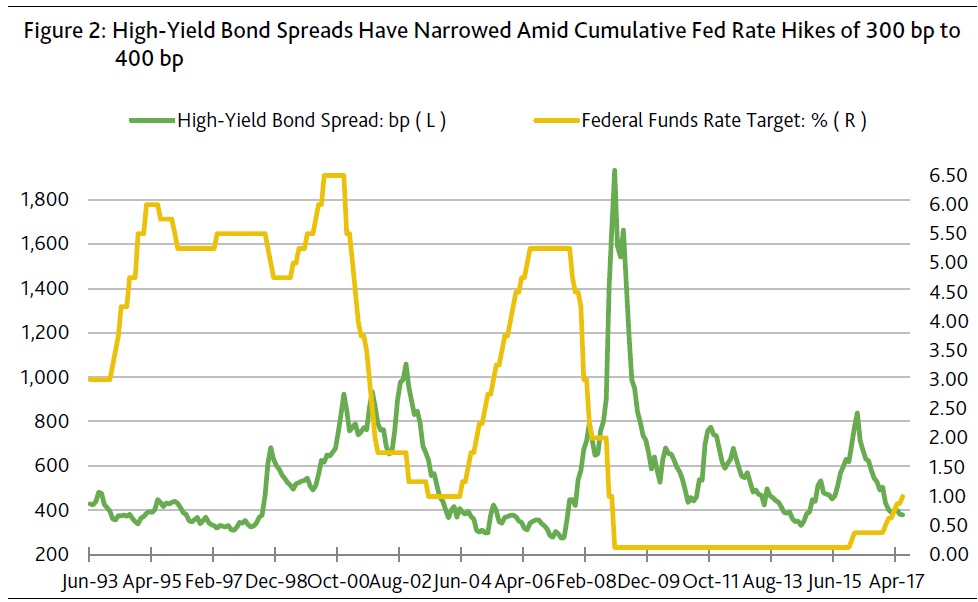
There is absolutely nothing unusual about financial market conditions easing amid Fed rate hikes. When the fed funds’ midpoint was hiked from 0.125% to 0.375% in December 2015, the high-yield bond spread quickly swelled from a November 2015 average of 697 bp to February 2016’s 839 bp. However, though the midpoint is likely to reach 1.125% at the FOMC’s upcoming meeting of June 14, the high-yield spread has since narrowed to a recent 380 bp. (Figure 2.)
Early on, Fed rate hikes often were followed by thinner corporate bond yield spreads. For example at the start of the first tightening cycle of 1991-2000’s economic upturn, fed funds was hiked from year-end 1993’s 3.0% to 5.5% by year-end 1994. Despite that 2.5 percentage point hiking of fed funds, the high-yield bond spread managed to narrow from Q4-1993’s 439 bp to Q4-1994’s 350 bp. Not until the 10-year Treasury yield dipped under August 1998’s 5.5% fed funds rate did the high-yield spread widen beyond 600 bp.
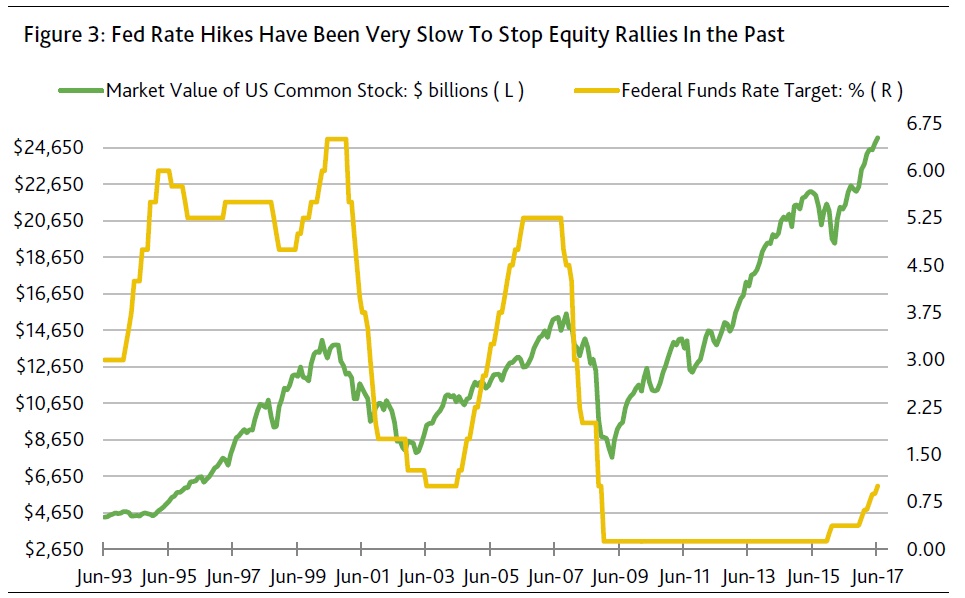
It’s also worth recalling how the market value of US common stock soared higher by 19.4% annualized, on average, from January 1994 through March 2000 despite a hiking of fed funds from 3.00% to 5.75%. However, once fed funds reached 6.00% in March 2000, a grossly overvalued equity market finally crested and began a descent that would slash the market value of US common stock by a cumulative -43% from March 2000’s top to October 2002’s bottom. (Figure 3.)
The series of Fed rate hikes that occurred during 2002-2007’s recovery told a similar story. Notwithstanding a steep and rapid ascent by fed funds from the 1% of June 2004 to 5.25% by June 2006, the high-yield bond spread averaged an extraordinarily thin 340 bp from July 2004 through July 2007. At the same time, the VIX index averaged a very low 13.2 points despite the span’s 425 bp hiking of fed funds. Moreover, from June 2004 through October 2007, the market value of US common stock advanced by nearly 11% annualized, on average.


