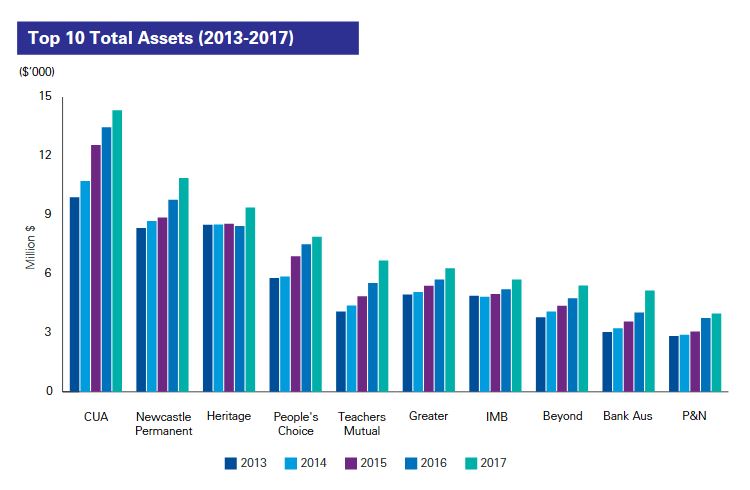
KPMG has released their 2017 Mutuals Industry Review. Under the hood, the sector is under pressure, despite asset growth. COBA said they welcome the backing from KPMG, which highlighted strong financial performance. We are not so sure. Sure, assets are growing, but at what cost?
KPMG Australia’s Mutuals Industry Review 2017 found strong balance sheets, asset growth and home loan lending growth as more Australians respond to the customer owned difference.
“We welcome KPMG’s analysis that customer owned banking offers a compelling and strong alternative,” COBA Acting CEO Dominic Dunn said.
“The review notes our strong performance in a challenging operating environment.
“Importantly it found that banking competition reforms will help the customer owned sector continue to grow and offer more products and services to more Australians.
“We particularly highlight the perspective on our sector’s investment in new and emerging technology. As KPMG points out:
“…six of the top 10 mutuals already partner with the Apple Pay, Android Pay and Samsung Pay systems, compared to just one of the majors. New opportunities for collaboration, the arrival of the New Payments Platform, and the growth of Australia’s fintech sector will open up new doors for mutuals as they concentrate on attracting the next generation of consumers.”
“Our sector was also acknowledged in the report for its investment in new mobile offerings, refreshed web design and improved digital experience.
“Customer owned banking institutions collectively have four million customers and $108 billion in total assets and deliver an unmatched customer focus to the banking market.
“Today’s annual review from KPMG is further evidence of why consumers should consider switching to a customer owned banking alternative.”
However, it is worth looking at the detail in the report. KPMG says:
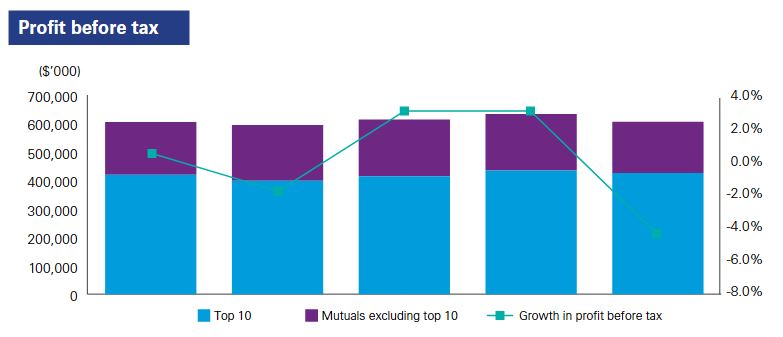
Profits before tax (PBT) declined by 4.3 percent (2016: grew 3.1 percent) to $605.7 million (2016: $633.0 million). This compares to the major banks which saw profits grow by 7.6 percent. The top 10 had a combined profit before tax of $425.5 million, down from $434.5 million in 2016. This represents 70.2 percent (2016: 68.6 percent) of PBT earned by mutuals. The mutuals sector is continually challenged to maintain profitability in the highly competitive banking environment.
Mutuals reported total net interest income of $2,150.3 million in 2017 (2016: $2,080.0 million). Of this, 64.5 percent was earned by the top 10 (2016: 63.9 percent).
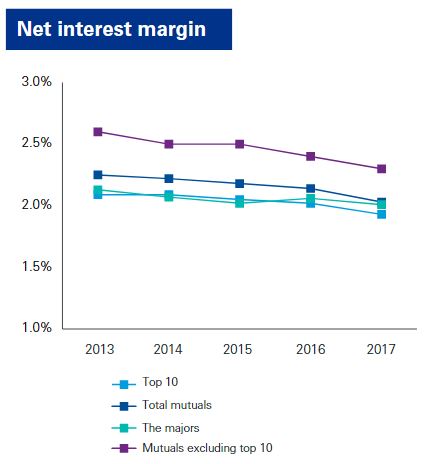
The net interest margin (NIM) continued to tighten and decreased to 2.03 percent (2016: 2.14 percent). The increasing pressures on net interest margin is a result of historically low interest rates and increasing competition in the marketplace. As such, mutuals have sacrificed margins to maintain and grow the membership base.
The NIM for the top 10 fell by 9 bps (2016: 3 bps) to 1.93 percent (2016: 2.02 percent), whereas the NIM for the majors has remained relatively stable at 2.01 percent in 2017.
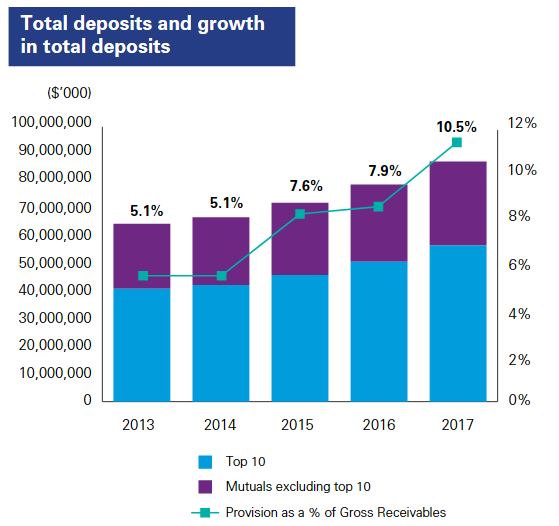
Given their limited access to wholesale funding sources, retail deposits remain an important funding source for mutuals – almost the sole source. 2017 saw mutuals grow their deposit base by 10.5 percent (2016: 7.9 percent) to $87.3 billion (2016: $79.1 billion). This was above system growth of 6.0 percent and above the majors’ growth of 5.4 percent. This result reflects the continued focus by mutuals towards membership acquisition, achieved through competitive product and service offerings to raise funds from household deposits. This has been made possible by investing in technology and delivering enhanced customer experiences.
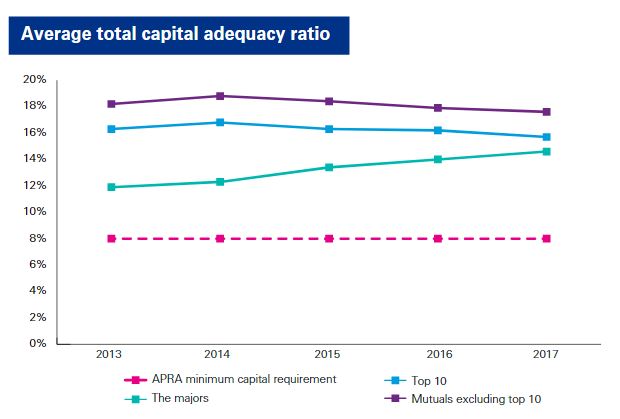
The average capital adequacy ratio dropped 30 basis points (2016: 40 basis points) to 17.2 percent (2016: 17.5 percent) in 2017, representing a decline in capital levels for the fourth consecutive year. This reflects the increasing prioritisation of effective capital use by mutuals. As limited equity funding is inherent within the mutuals’ current business model and capital growth through new profits have been constrained this year, mutuals have looked to existing capital bases to fund balance sheet growth.
Despite greater capital utilisation, mutuals have continued to maintain capital levels significantly in excess of APRA’s minimum requirements of 8 percent. Earlier this year, APRA announced requirements for ‘unquestionably strong’ capital adequacy ratios which will see ADIs using the internal ratings-based (IRB) approach raise minimum capital requirements by approximately 150 bps from current levels, by 2020. ADIs using the standardised approach to capital adequacy are expected to raise minimum capital requirements by approximately 50 bps over the same period. While this action improves resilience in the banking industry on a macro level, it also brings the majors and mutuals closer on the playing field. There is an opportunity for mutuals to take the market share lost by the majors, should the majors increase interest rates in response to APRA’s new capital settings during the transition period.
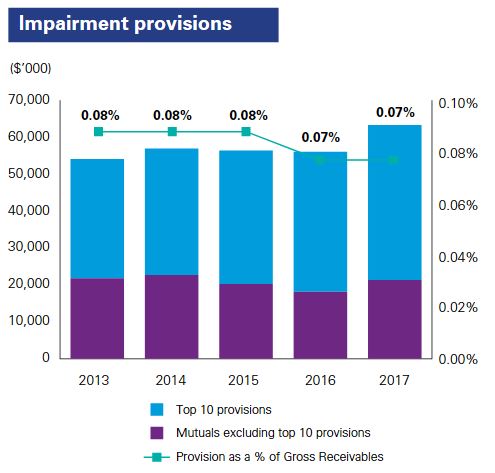
2017 saw mutuals increase their loan provisions by 13.0* percent to $63.3 million (2016: $56.0 million). This was in response to heightened risk in the operating environment as interest rates remain low and housing affordability continues to decline. These sentiments have been shared across the industry with Standard & Poor’s (S&P) recently downgrading the credit ratings of 23 ADIs, 13 of which were mutuals, due to concerns over a rise in significant credit losses arising from the risk of sharp corrections in property prices.
Total loan write-offs of $29.2 million (2016: $29.0 million) remained largely the same as last year, up 0.7 percent from 2016. Looking ahead, we expect to see larger and more volatile provisions for loan impairment on balance sheets, as mutuals implement an expected credit loss model with AASB 9 Financial Instruments coming into effect on 1 January 2018.
* Impairment provisions exclude the impacts of early adoption of AASB 9 Financial Instruments.
 One final observation. KPMG said, from their survey:
- Don’t close branches just yet: 45 percent of respondents still want to apply for a home loan at a branch.
- Digital reigns supreme for research and servicing home loans: 87 percent of
respondents indicated that digital channels are their preferred choice for researching and servicing their home loan.
This is out of kilter with our research, which may indicate a demographic and technographic skew of Mutual customers. The future is clearly digital and home loans are not immune!

