The latest APRA Monthly Banking Statistics to January 2018 tells an interesting tale. Total loans from ADI’s rose by $6.1 billion in the month, up 0.4%. Within that loans for owner occupation rose 0.57%, up $5.96 billion to $1.05 trillion, while loans for investment purposes rose 0.04% or $210 million. 34.4% of loans in the portfolio are for investment purposes. So the rotation away from investment loans continues, and overall lending momentum is slowing a little (but still represents an annual growth rate of nearly 5%, still well above inflation or income at 1.9%!)
 Our trend tracker shows the movements quite well. (August 2017 contained a large adjustment.
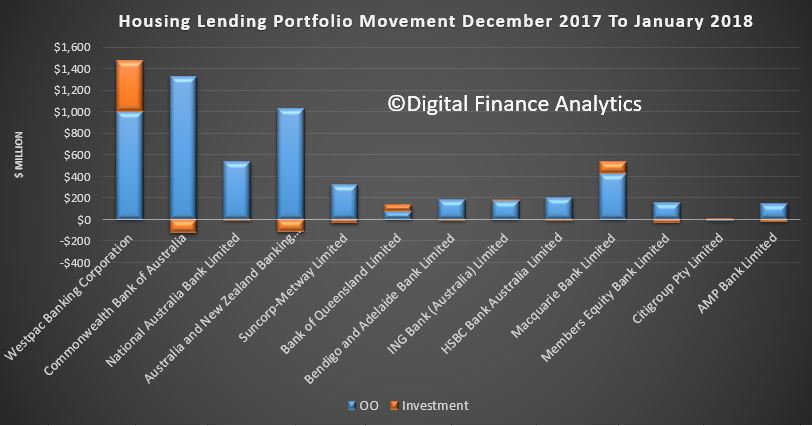
 Looking at the lender portfolio, we see some significant divergence in strategy. Westpac is still driving investment loans the hardest, while CBA and ANZ portfolios have falling in total value, with lower new acquisitions and switching. Bank of Queensland and Macquarie are also lifting investment lending.
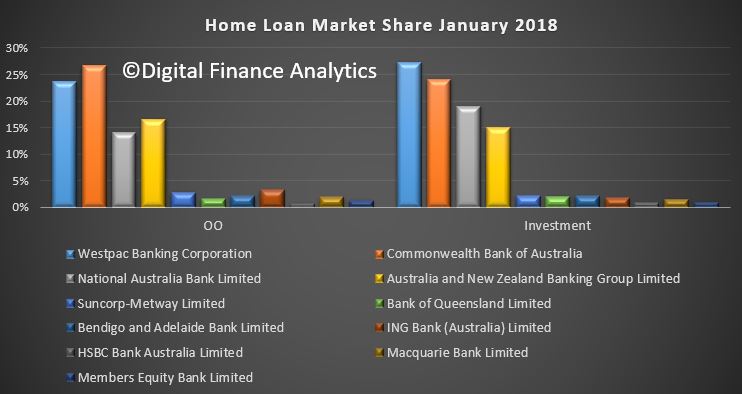
 The market shares are not moving that much overall, with CBA still the largest OO lender, and Westpac the largest Investor lender.
Looking at investor portfolio movements for the past year, again significant variations with some smaller players still above the 10% speed limit, but the majors all well below (and some in negative territory).
 We will report on the RBA data later on, which gives us an overall market view.

