The ABS released housing finance statistics today to the end of August 2018. The most striking observation is that lending flows for owner occupied buyers appear to be following the lead from the investment sector. Both were down. This is consistent with our household surveys.
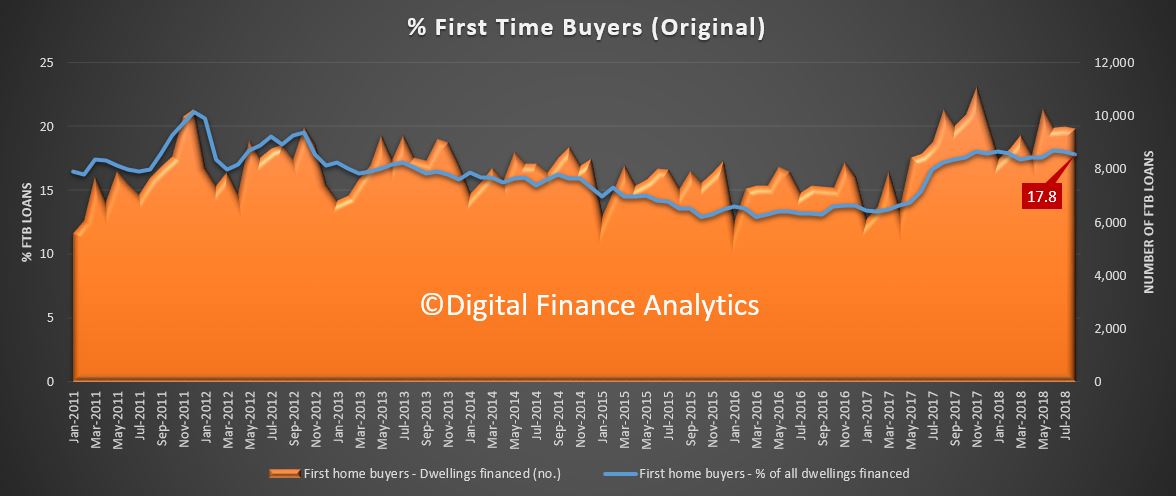
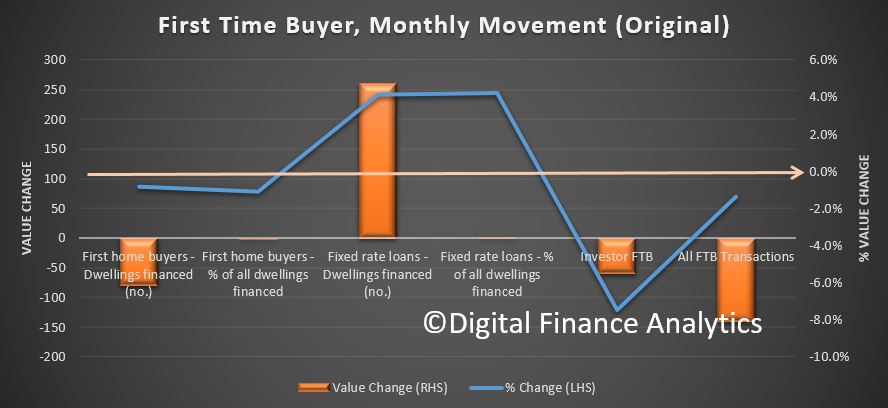
Looking at the original first time buyer data, the number of new loans fell from 9,614 in July to 9,534 in August, a fall by 80, or 0.8%. As a proportion of all loans written in the month, the share by first time buyers fell from 18% to 17.8%.
 The number of non-first time buyers remained about the same. The average first time buyer loan fell just a little to $345,000. Looking at the DFA investor segment of first time buyers – which is not reported in the official data, there was a further fall.
 Thus our overall first time buyer tracker reveals a further slide in activity. Perhaps more are wanting to catch a bargain in a few months, although our surveys suggested the main issue is the inability to get a loan in the now tighter lending environment.
![]() Looking at the trend lending flows, the only segment of the market which was higher was a small rise in refinanced owner occupied loans. These existing loans accounted for 20.5% of all loans written, up from 20.3%, and we see a rising trend since June 2017, from a low of 17.9%. Total lending was $6.3 billion dollars, up $31 million from last month.
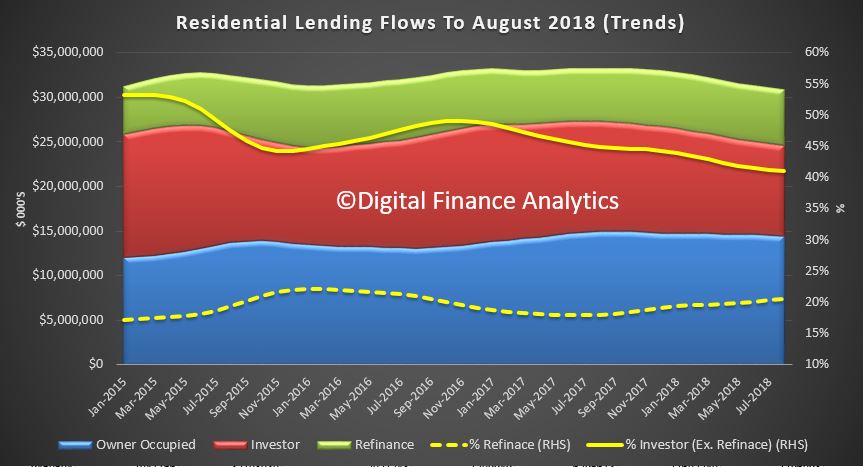
Looking at the trend lending flows, the only segment of the market which was higher was a small rise in refinanced owner occupied loans. These existing loans accounted for 20.5% of all loans written, up from 20.3%, and we see a rising trend since June 2017, from a low of 17.9%. Total lending was $6.3 billion dollars, up $31 million from last month.
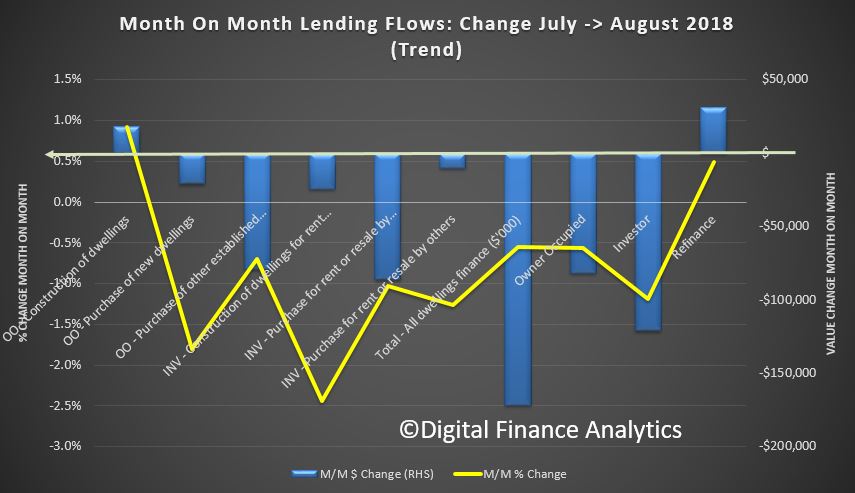
Investment loan flows fell 1.2% from last month accounting for $10 billion, down 120 million. Owner occupied loans fell 0.6% in trend terms, down $81 million to $14.5 billion. 41% of loans, excluding refinanced loans were for investment purposes, the lowest for year, from a high of 53% in January 2015.
 Looking at the moving parts, only refinance, and owner occupied construction loans rose just a little, all other categories fell.
 On these trends,remembering that credit growth begats home price growth, the reverse is also true. Prices will fall further, the question remains how fast and how far? We will be revising our scenarios shortly.
