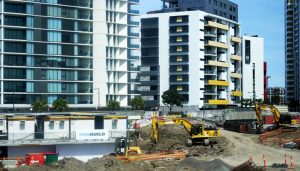
The number of dwellings approved in Australia fell by 1.1 per cent in October 2018 in trend terms, according to data released by the Australian Bureau of Statistics (ABS) today.
NUMBER OF TOTAL DWELLING UNITS
The trend estimate for total dwellings fell 1.1% in October.
NUMBER OF PRIVATE SECTOR HOUSES
The trend estimate for private sector houses approved fell 0.5% in October.
NUMBER OF PRIVATE SECTOR DWELLINGS EXCLUDING HOUSES
The trend estimate for private sector dwellings excluding houses fell 1.8% in October.
VALUE OF NEW RESIDENTIAL BUILDING
The trend estimate for value of new residential building approved fell 1.5% in October and has fallen for ten months.
“The trend for total dwellings has been steadily declining over the past twelve months,” said Justin Lokhorst, Director of Construction Statistics at the ABS. “The decrease in October was mainly driven by private sector dwellings excluding houses, which fell 1.8 per cent. Private sector houses also declined, by 0.5 per cent.”
Among the states and territories, dwelling approvals fell in October in the Northern Territory (12.5 per cent), South Australia (5.0 per cent), Western Australia (4.4 per cent), Queensland (2.9 per cent) and New South Wales (2.3 per cent) in trend terms. Victoria (2.4 per cent) and the Australian Capital Territory (0.8 per cent) were the only states to record an increase in dwelling approvals in trend terms, while Tasmania was flat.
NEW SOUTH WALES
The trend estimate for total number of dwelling units in New South Wales fell 2.3% in October. The trend estimate for private sector houses rose 0.2% in October.
VICTORIA
The trend estimate for total number of dwelling units in Victoria rose 2.4% in October. The trend estimate for private sector houses rose 0.6% in October.
QUEENSLAND
The trend estimate for total number of dwelling units in Queensland fell 2.9% in October. The trend estimate for private sector houses fell 1.3% in October.
SOUTH AUSTRALIA
The trend estimate for total number of dwelling units in South Australia fell 5.0% in October. The trend estimate for private sector houses fell 2.6% in October.
WESTERN AUSTRALIA
The trend estimate for total number of dwelling units in Western Australia fell 4.4% in October. The trend estimate for private sector houses fell 3.7% in October.
Approvals for private sector houses fell 0.5 per cent in October in trend terms. Private sector house approvals fell in Western Australia (3.7 per cent), South Australia (2.6 per cent) and Queensland (1.3 per cent). Victoria (0.6 per cent) and New South Wales (0.2 per cent) recorded increases.
In seasonally adjusted terms, total dwellings fell by 1.5 per cent in October, driven by a 4.8 per cent decrease in private dwellings excluding houses. Private houses rose 2.7 per cent in seasonally adjusted terms.
The value of total building approved fell 1.5 per cent in October, in trend terms, and has fallen for twelve months. The value of residential building fell 1.4 per cent while non-residential building fell 1.8 per cent.


Dwellings approved in Australia fell by 1.1 per cent in October
Thank you! It’s not very nice is it, looks like this baby is starting to rolll over!