The ABS Residential Price Series also includes transaction data across the country, separated between houses, and other (described as attached). In some cases units may fall into the house bucket, according to the ABS supporting information, due to weaknesses in the data.
We are able to look at the transaction trends, across each state, and they show that to December 2017, the latest date of publication, the volume of settlements overall are significantly lower.
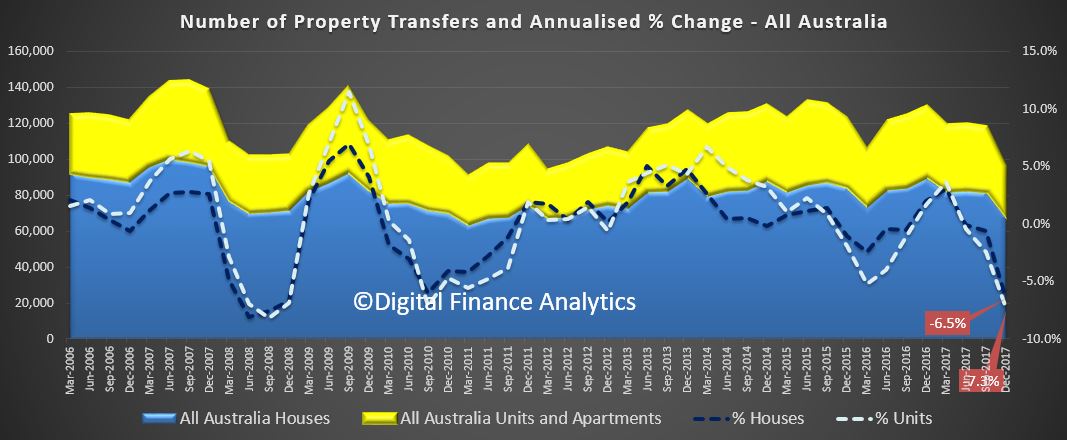
Here is the all Australia plot. The blue area shows the count of houses, the yellow area the volume of transfers for other than houses. We also plot the annualised growth rates. It shows apartment transfers are down more than 7%, and houses down 6.5% to December 2017.
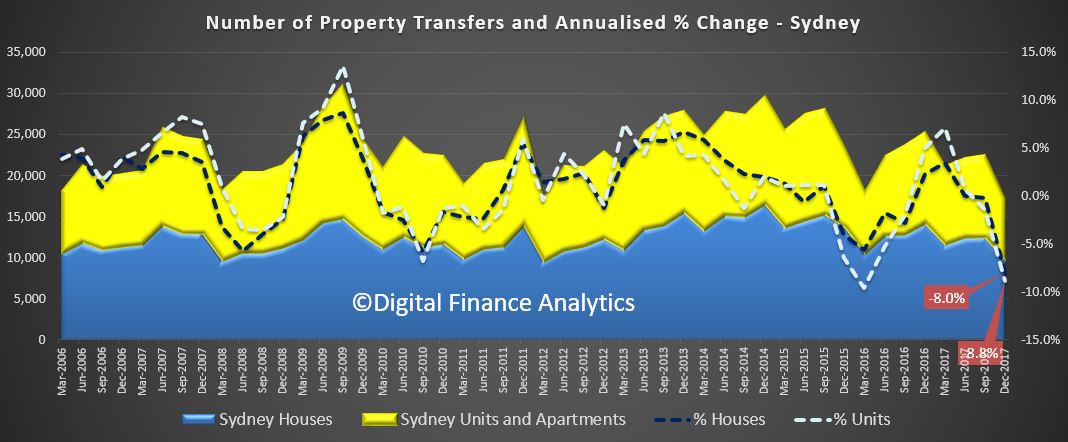
 Looking at the individual markets, Sydney both house and unit transfers are more than 8% down to December 2017.
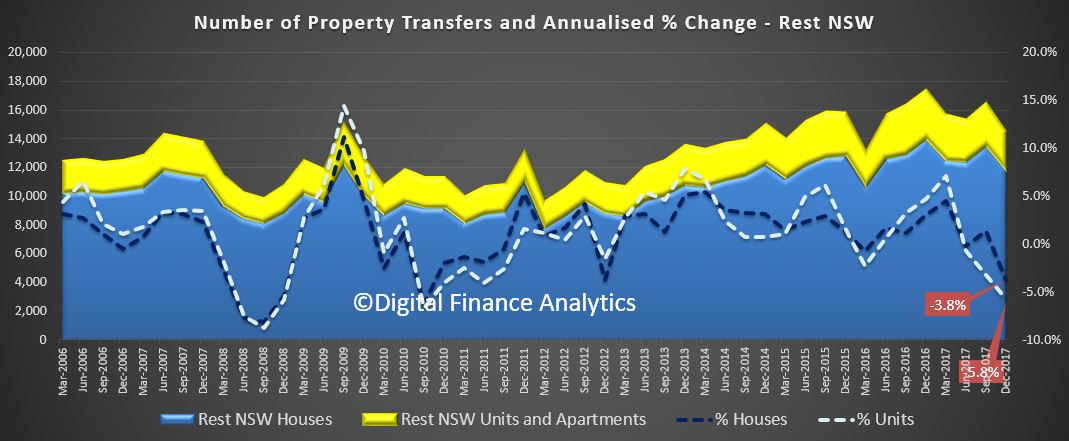
 Across the rest of NSW, house transfers are down 3.8% and unit transfers are down 5.8%.
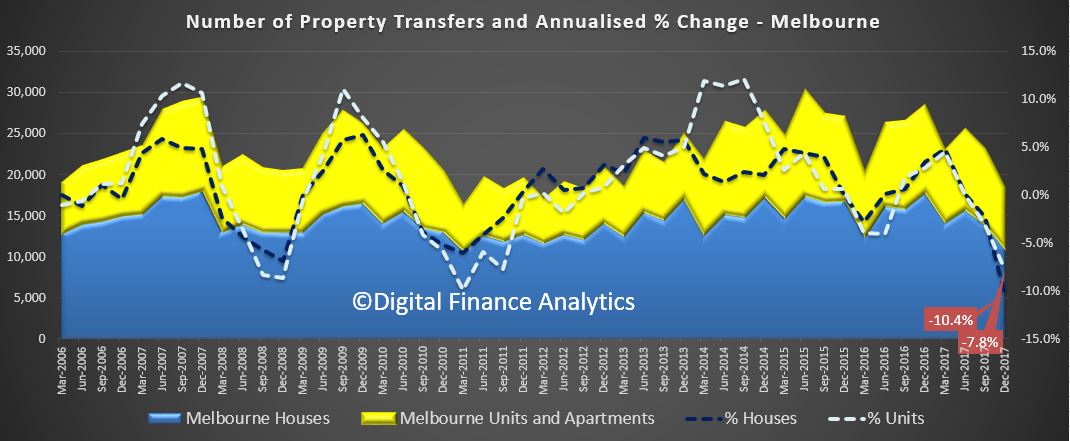
 Turning to Melbourne, still seen by many as the “leading market”, houses are down 7.8% and units and apartments, down 10.4% to December 2017.
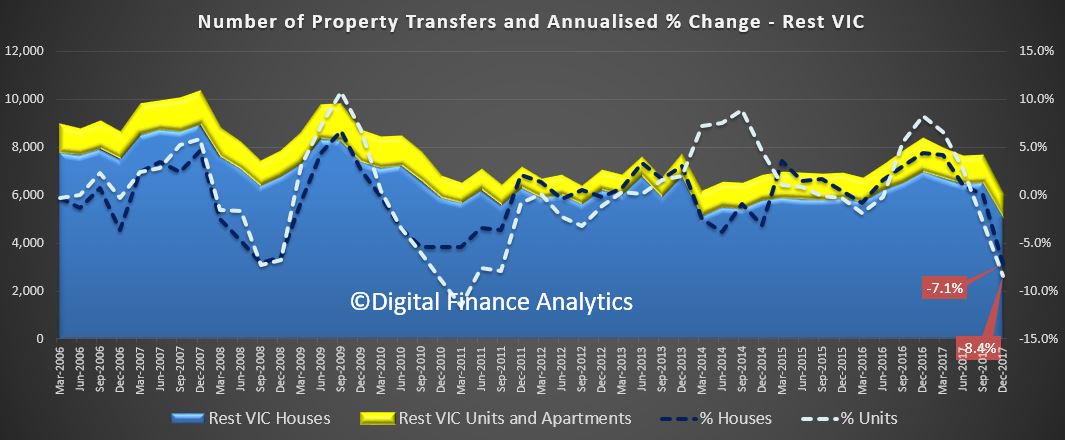
 Across the rest of the state, units were down 8.4% and houses down 7.1%.
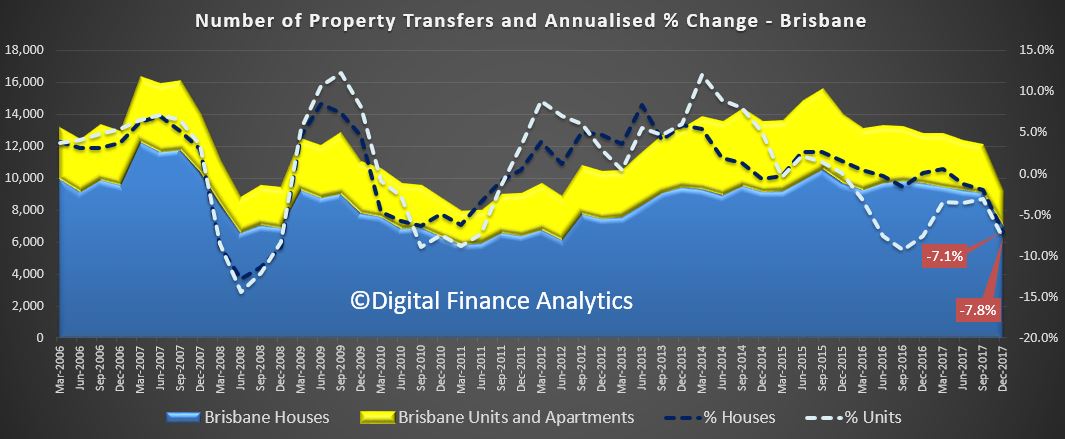
So up to Brisbane, where both house and unit transfers have fallen by more than 7% to December 2017.
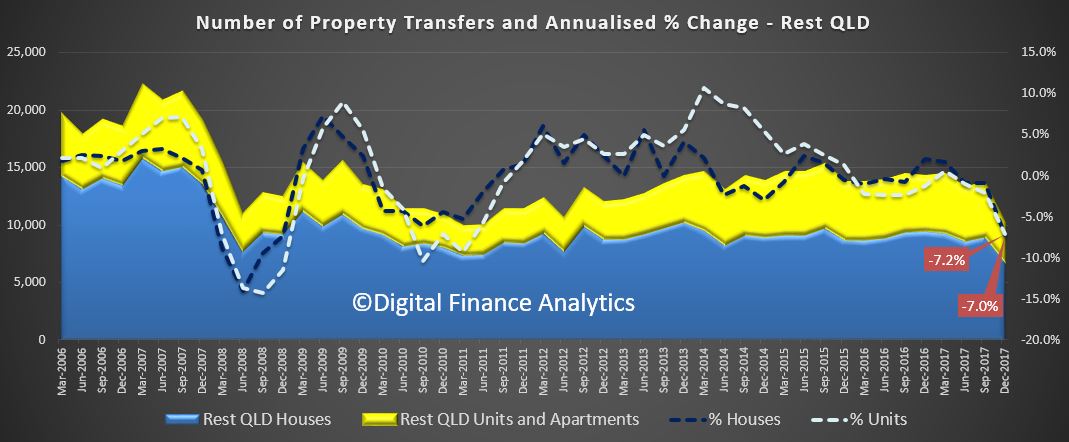
 We can also see falls across the rest of the state, again looking at houses and unit transfers, both of which fell by more than 7%.
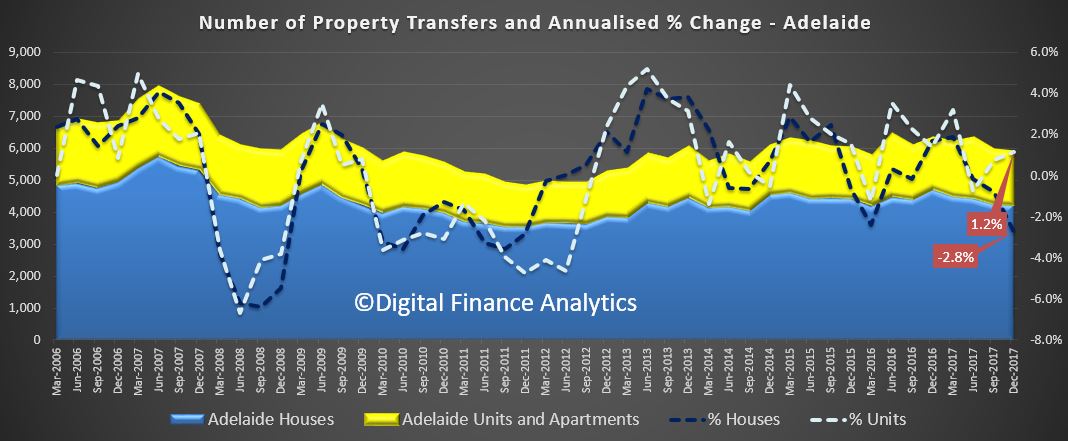
 Next we go to South Australia. Here in this smaller, yet slightly more buoyant market units were up in Adelaide by 1.2%, whilst house transfers were down 2.8%.
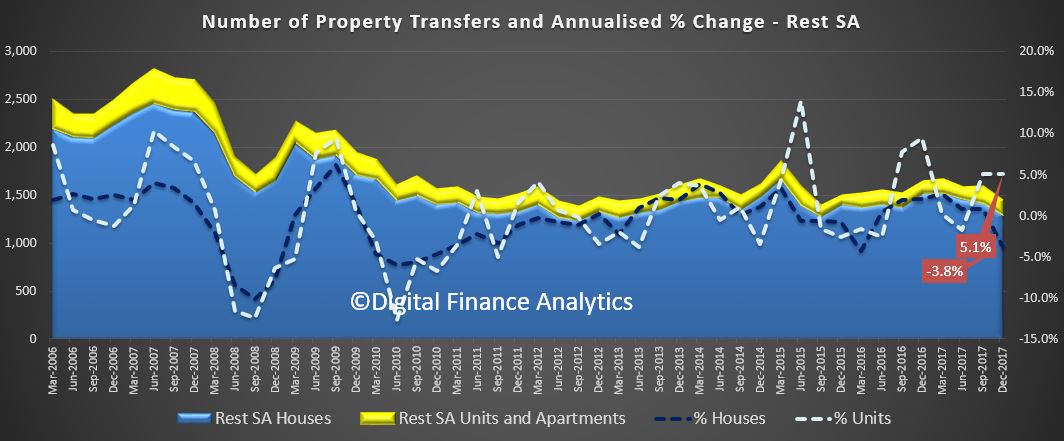
 Across the rest of SA, unit transfers were up 5.1% while houses were down 3.8%.
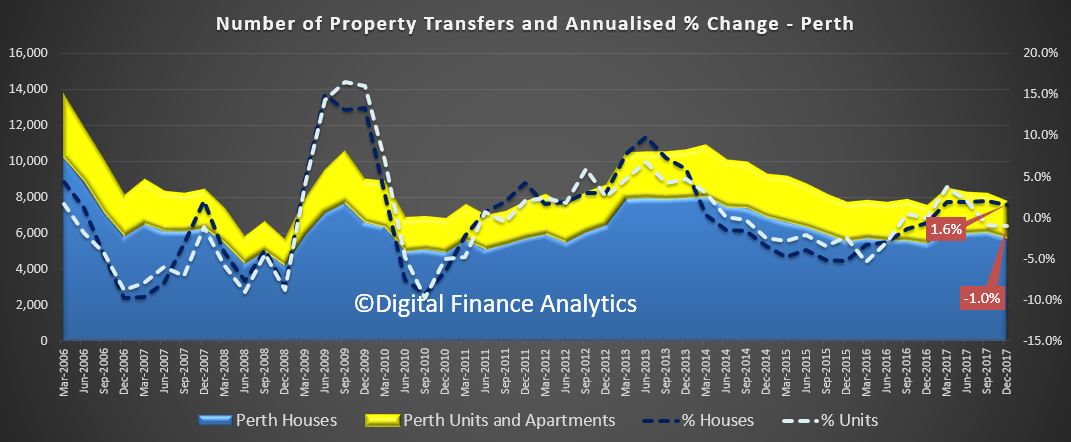
 Then across to WA. Here of course property has been under pressure for some time, following a peak in 2009-10 and 2013. In Perth, unit transfers were down 1% and houses up 1.6%.
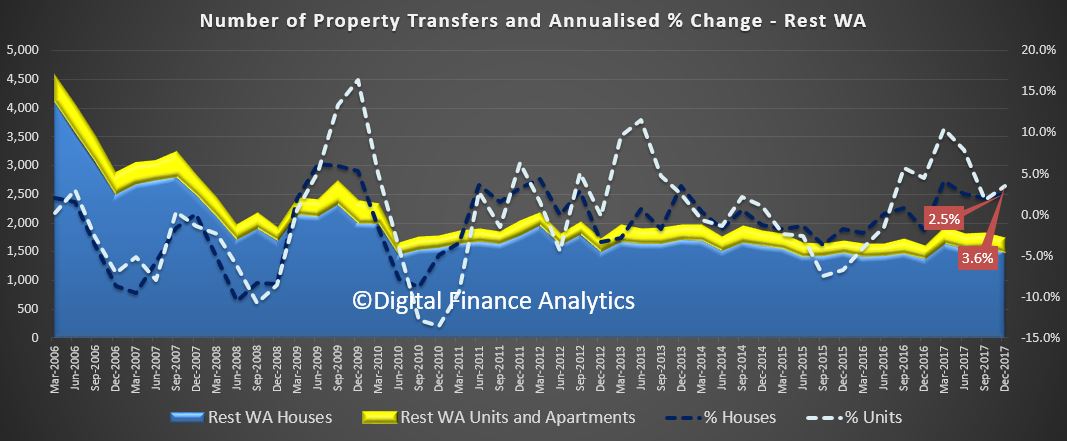
 Across the rest of WA both unit and houses grew by 3.6% and 2.5% respectively.
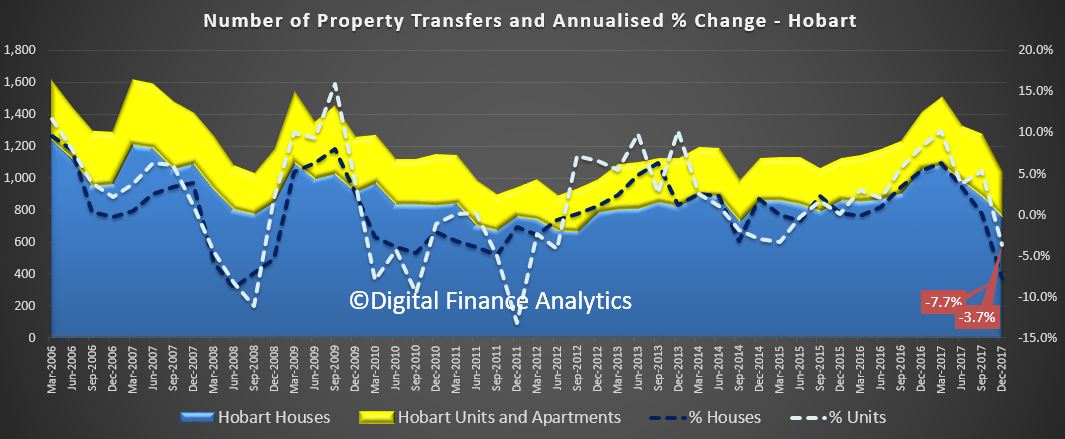
 In Tasmania, another “growth” state, transfers in Hobart were down 3.7% for units, and 7.7% for houses to December 2017
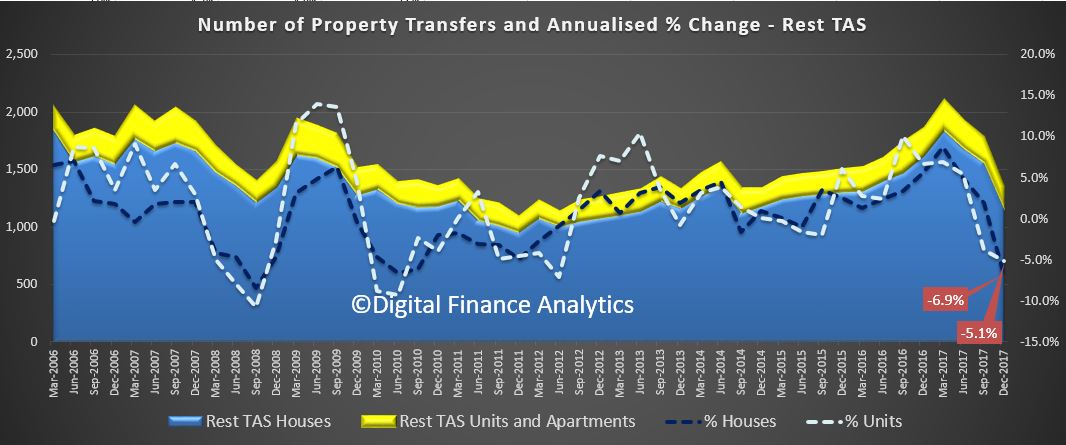
 Beyond Hobart, across the rest of the state, house transfers were down 5.1% and units were down 6.9%.
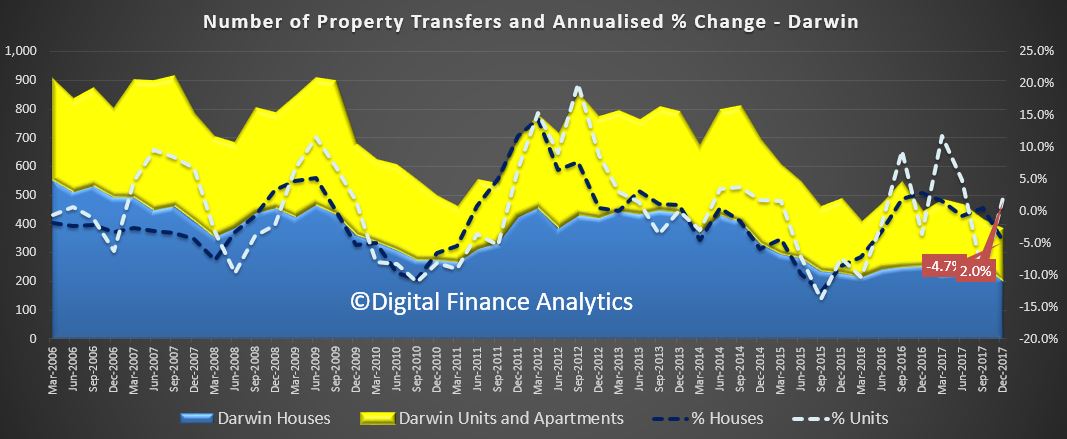
 In Darwin, unit transfers rose by 2%, while houses fell 4.7% to December 2017.
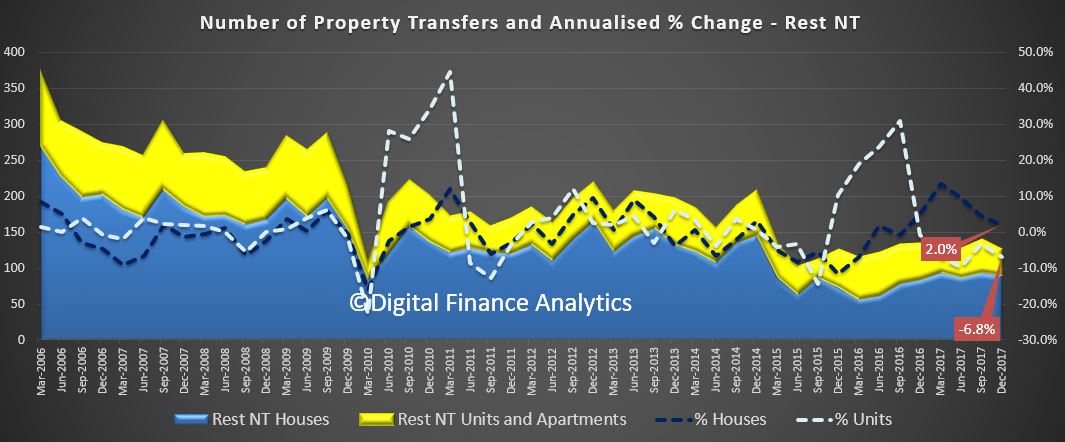
 Across the rest of NT, unit transfers fell 6.8% and houses rose 2%
 Finally, in Canberra, houses fell a significant 7.2% to December 2017, and units a massive 16.5%.
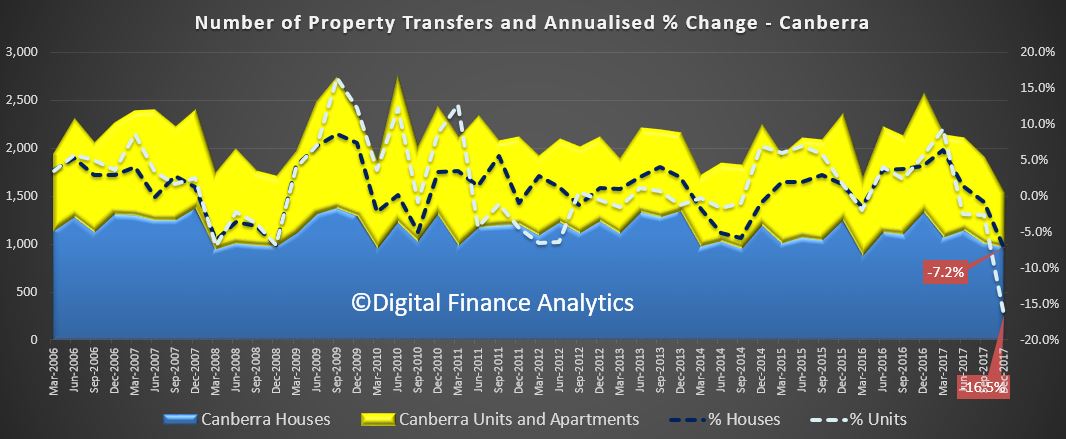 Standing back we see that units in particular have lost momentum, thanks to the lack of momentum in the investment sector, in particular. But more importantly, this data was set before the more recent lending tightening has hit, so expect to see more falls in transaction volumes ahead.
A clear sign the market is on the decline!

