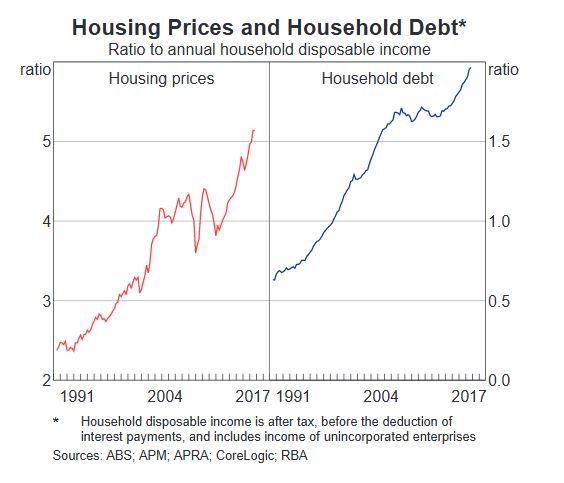
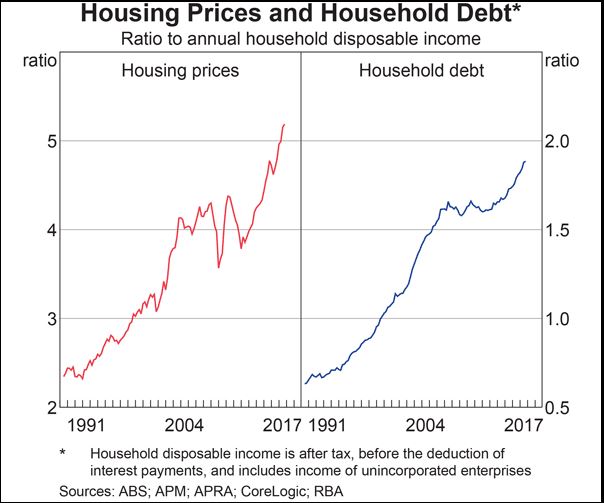
The RBA has quietly revised down the household debt to income ratio stats contained in E2 statistical releases and their chart pack. It has dropped by 6% from 199.7 down to 188.4.
This is on top of the reduction in the growth in investment mortgages we discussed before.
More rubbery numbers, we suspect trying to play down the size of the mortgage debt problem. RBA please explain!
This is the original chart from February (199.7).

This is the revised version, now available from the RBA site. Also they changed the scale, so it looks better too!
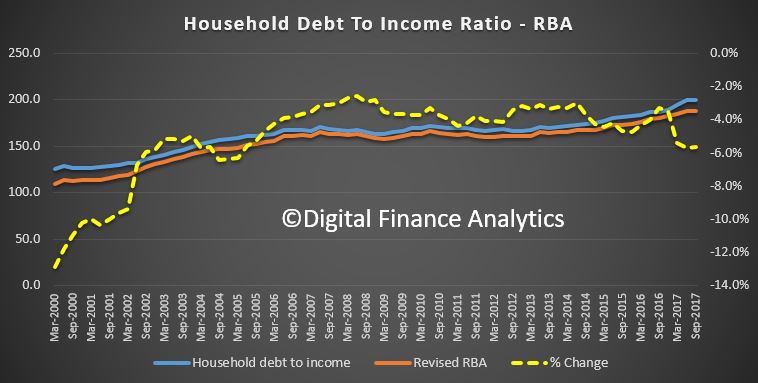
 Now, we happen to retain the previous versions of the underlying RBA E2 series which by the way is derived from the ABS data series, and massaged by the RBA. Household debt is sourced from ABS Cat No 5232.0. Debt includes debt owed by unincorporated enterprises, and does not appear to have changed.
We can track the changes the RBA made to the series. Last months figure dropped a magical 6%, to 188.4. It runs right across the series. The blue line is the original series, the orange one the revision.
 This may have something to do with superannuation accounts, but unless I missed it, there has been no explanation of the changes.
If you know why it changed, do let me know!
UPDATE: I spoke to the RBA. “The ABS made an error in the original release of the Financial Accounts (on the 20/12/2017) and subsequently revised the data on 1 February 2018. Details of the revisions are provided here”. The RBA’s statistical tables were consequently updated for the revisions on 2 February 2018.
This is what the ABS said: 01/02/2018: This release incorporates amendments to the household and general government (national and state and local) accounts payable and total liability series; and household net worth. The amendments are due to a correction to the implementation of an update of the Australian Accounting Standards Board (AASB 1056 Superannuation Entities) which relates to superannuation funds recognising for the first time employer sponsor receivables for Public Sector defined benefit schemes. The household and superannuation assets were correctly reported; however the counterparty to the superannuation receivable asset had been reported as a payable from household rather than general government. The mis-allocation occurred from September quarter 2016 onwards, when the update to AASB 1056 occurred.
This has been corrected in 9 excel tables. The impacted tables are Table 14, Table 18, Table 27, Table 29, Table 31, Table 33, Table 34, Table 35 and Table 49. The household sector summary and the sectoral analysis have been updated accordingly. The correction will also be included in the RBA household debt to income ratio which is calculated using ABS data. This will be published on the RBA website.
Weird it corrects the series back to the year 2000 and before.
